11 Ecoregion summary: historical sites
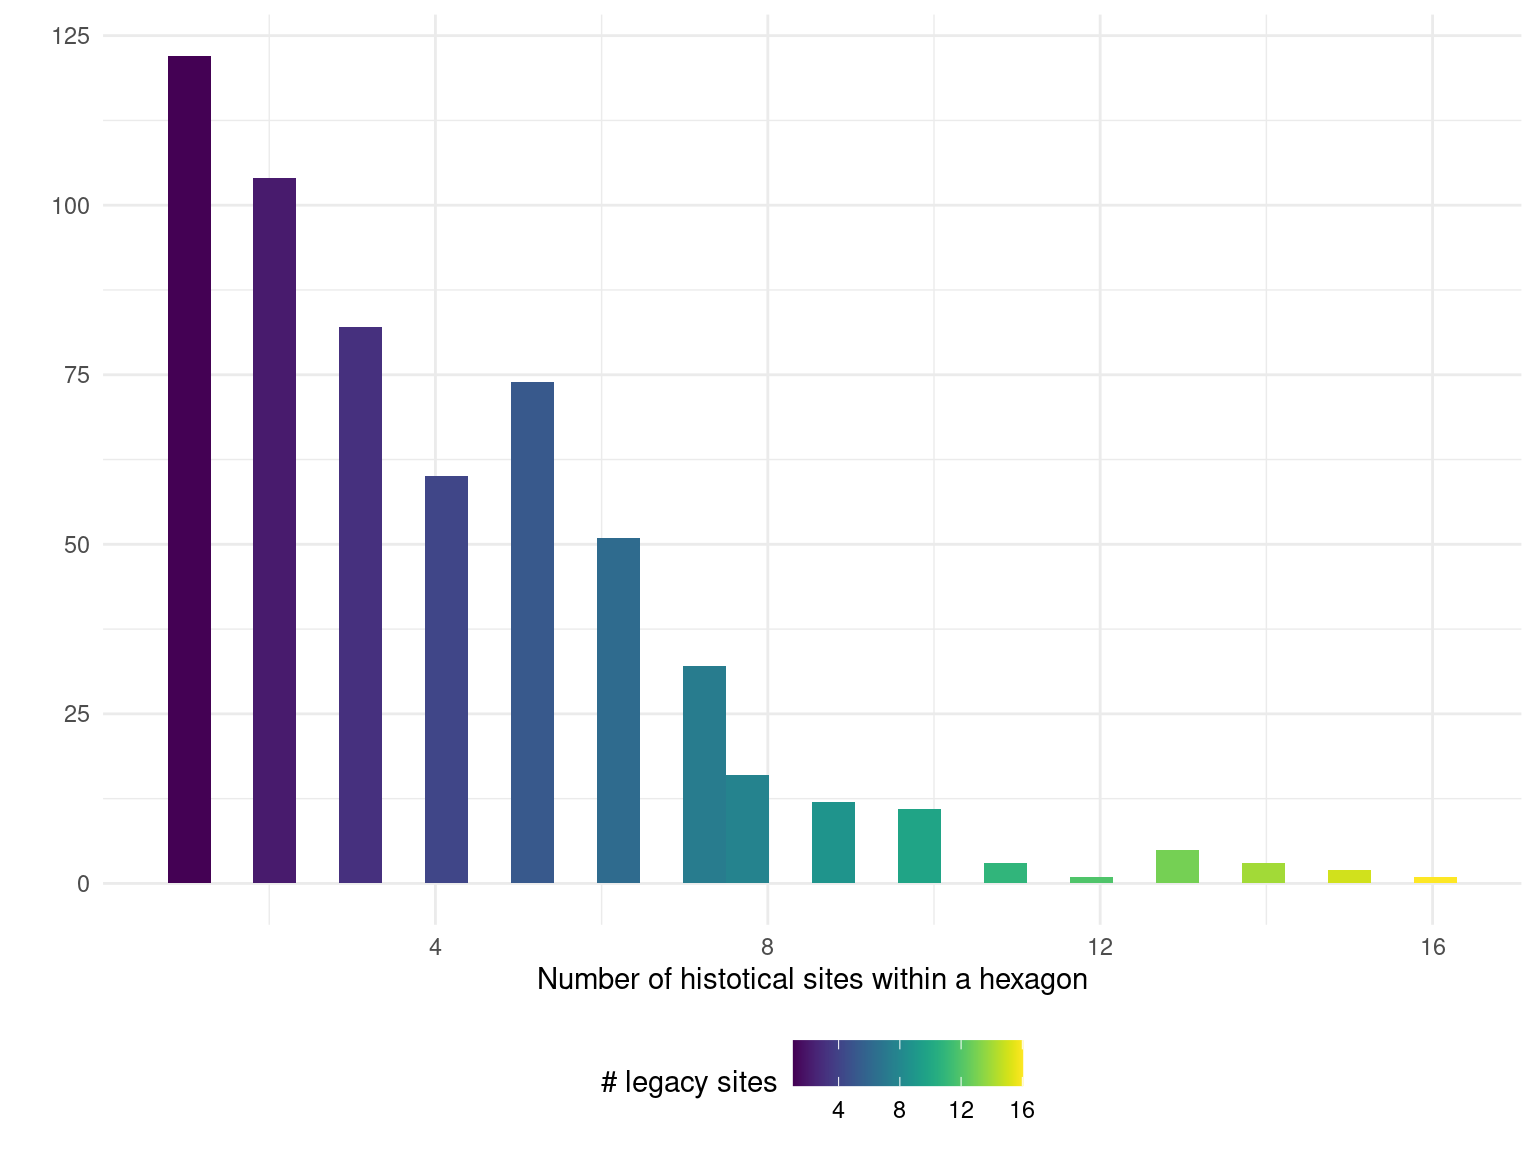
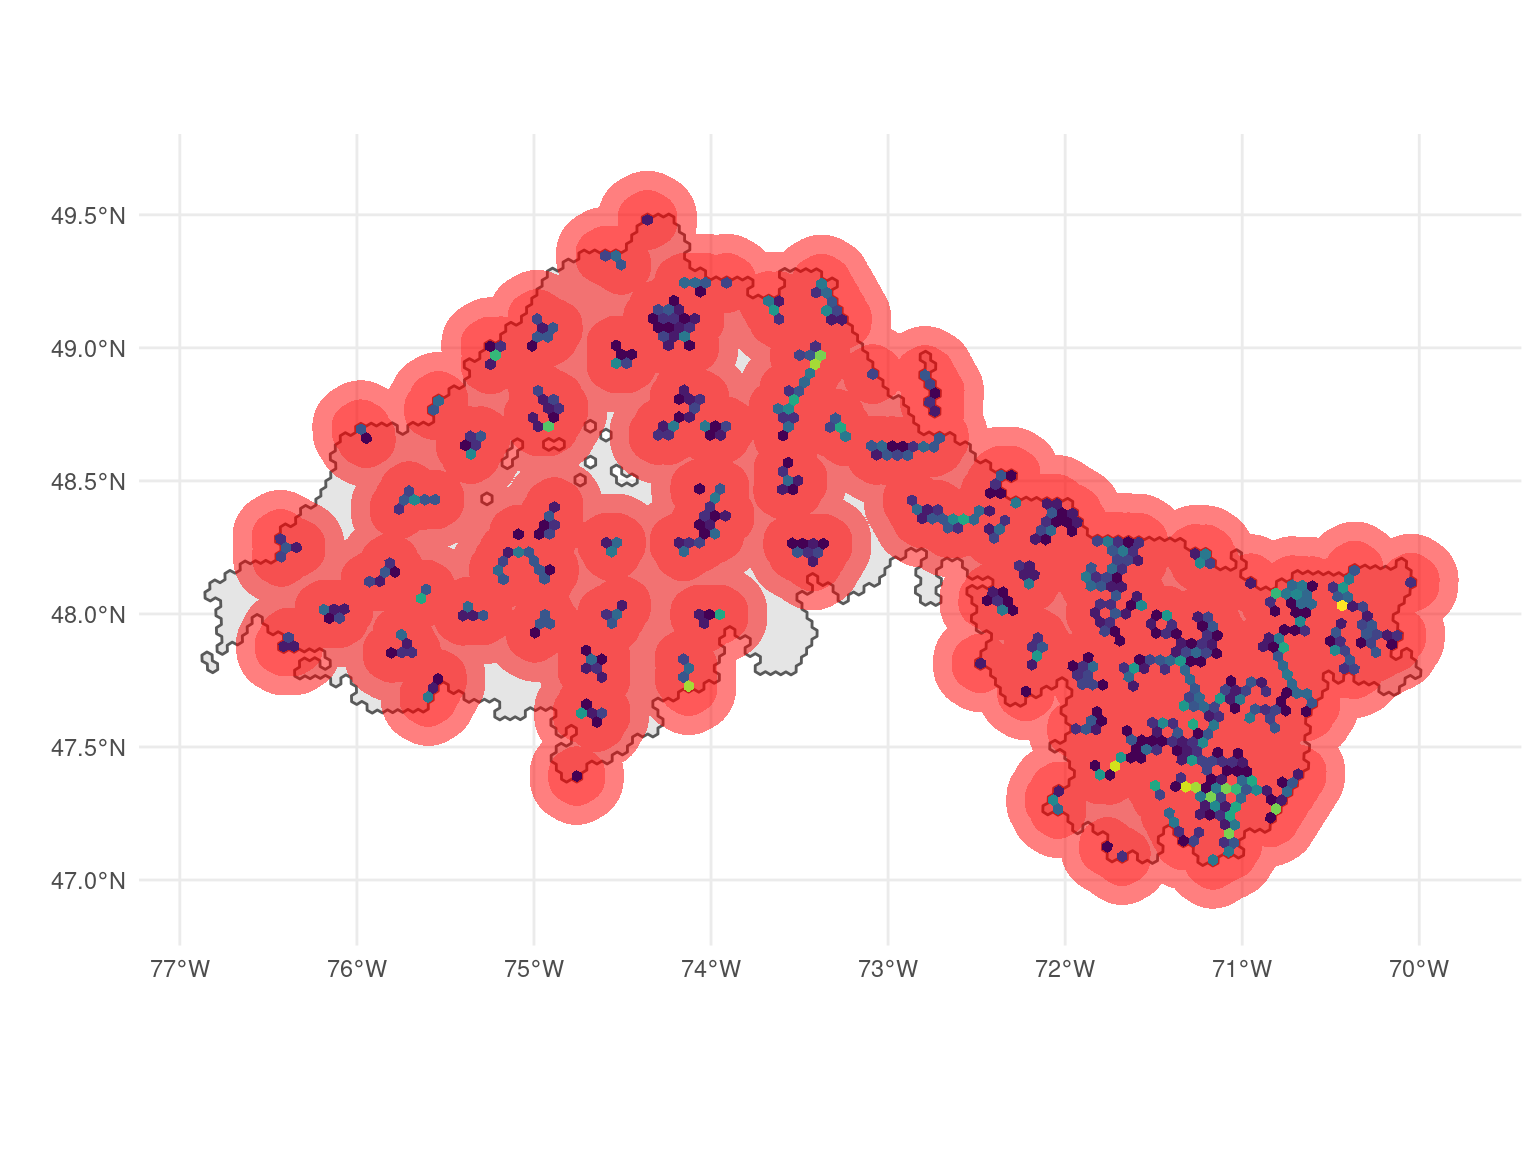
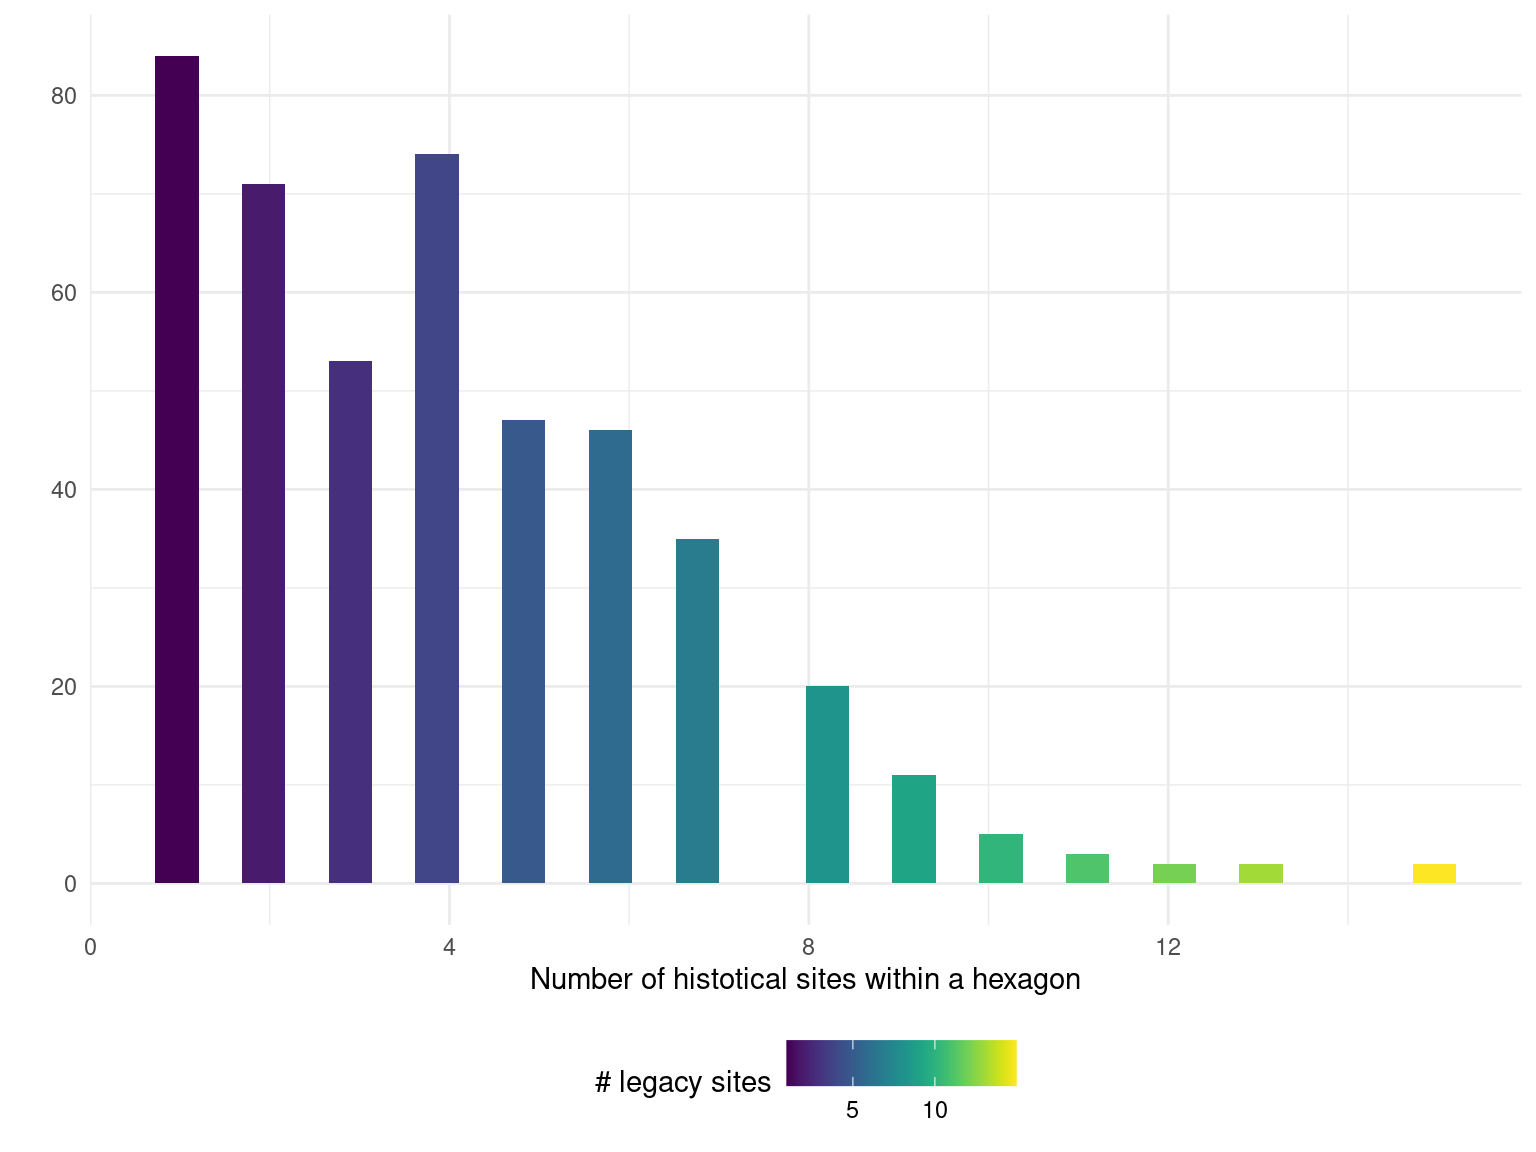
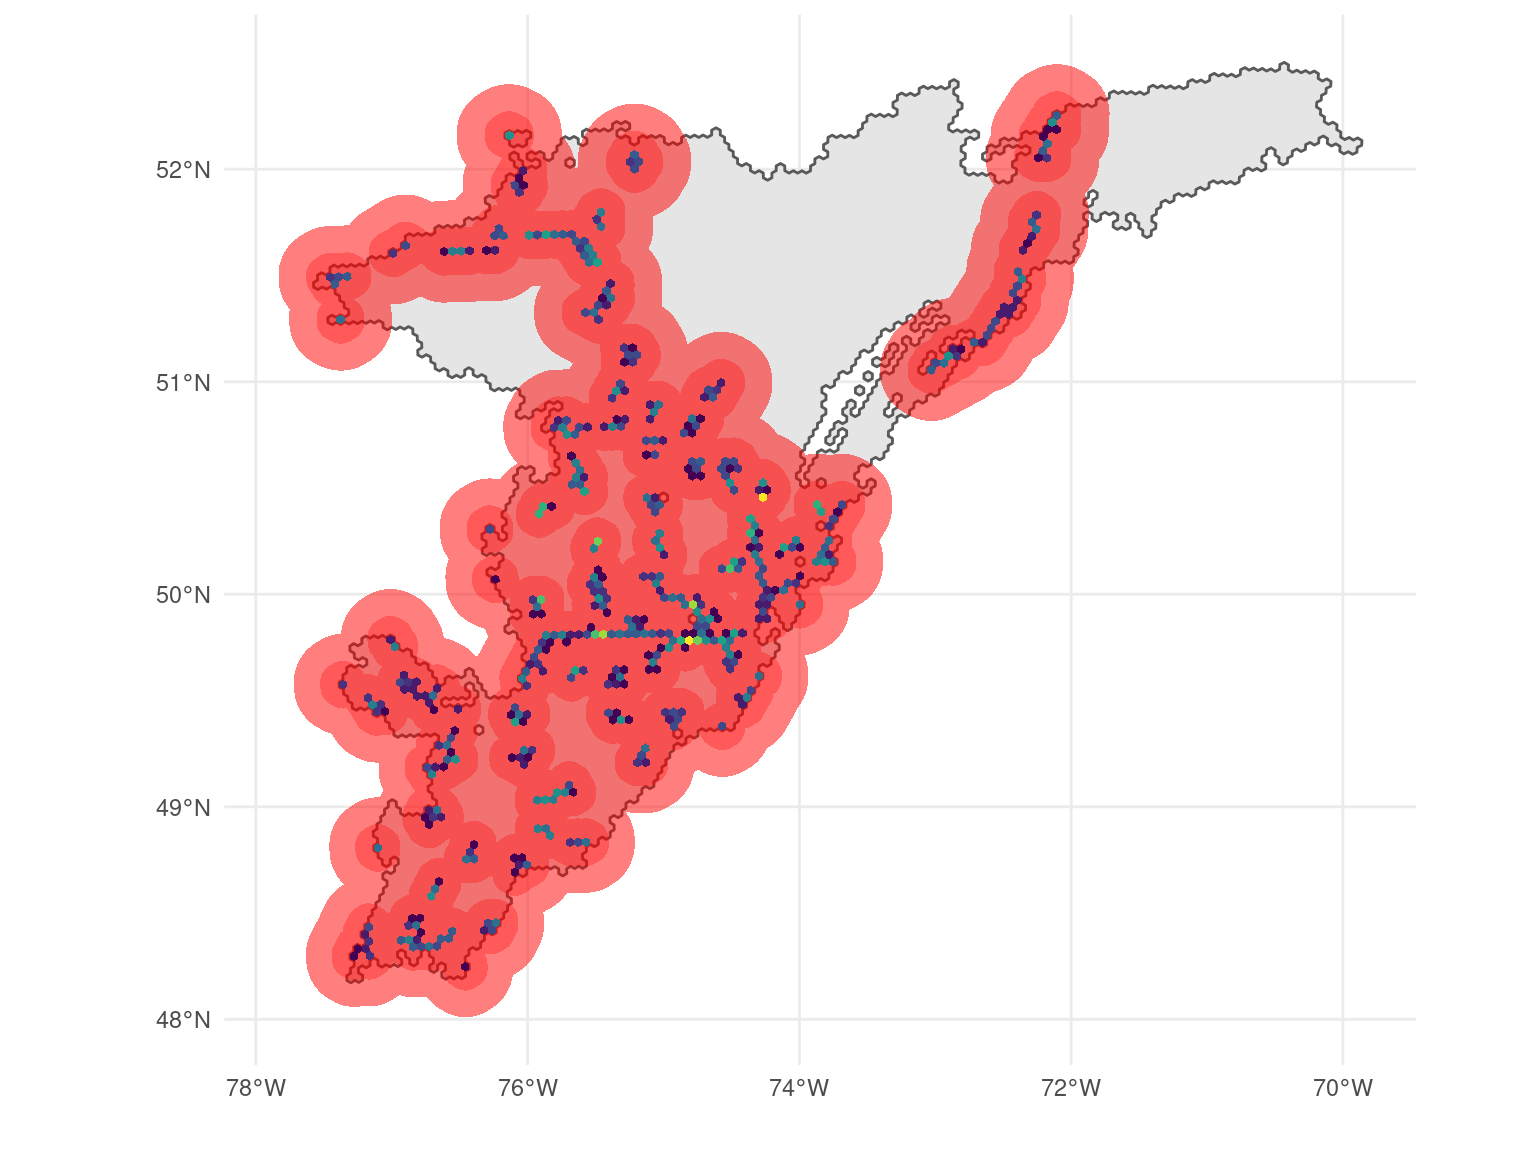
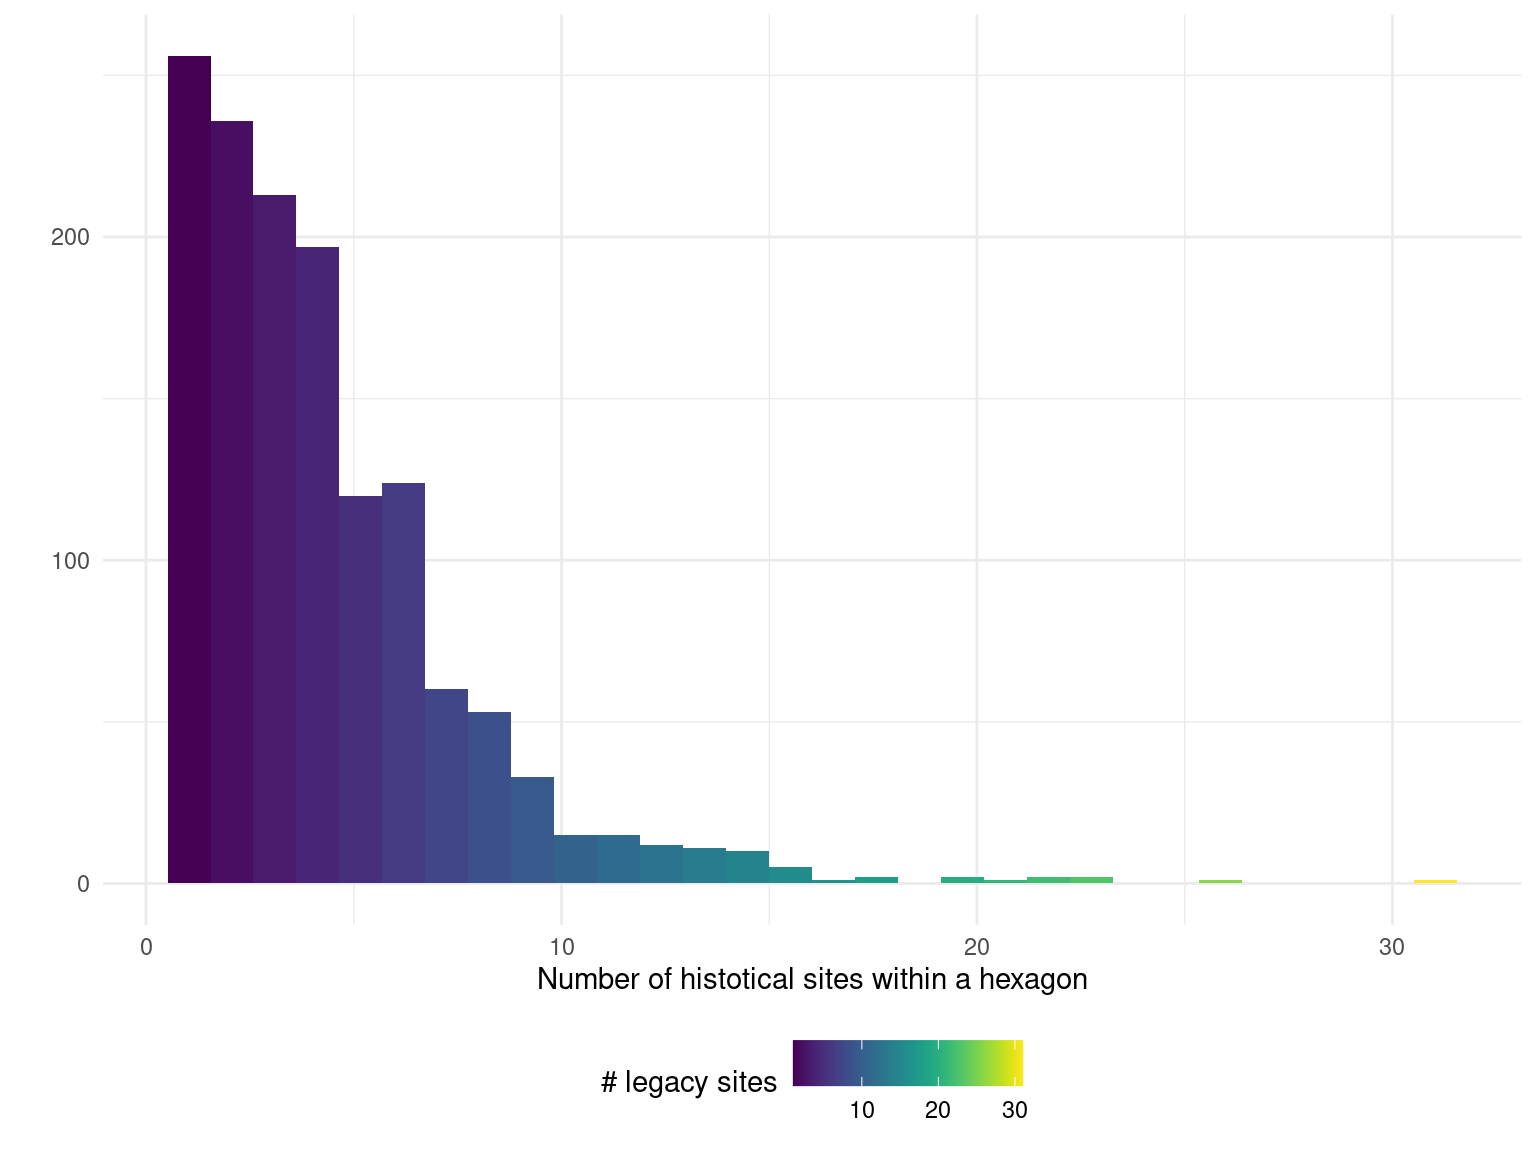
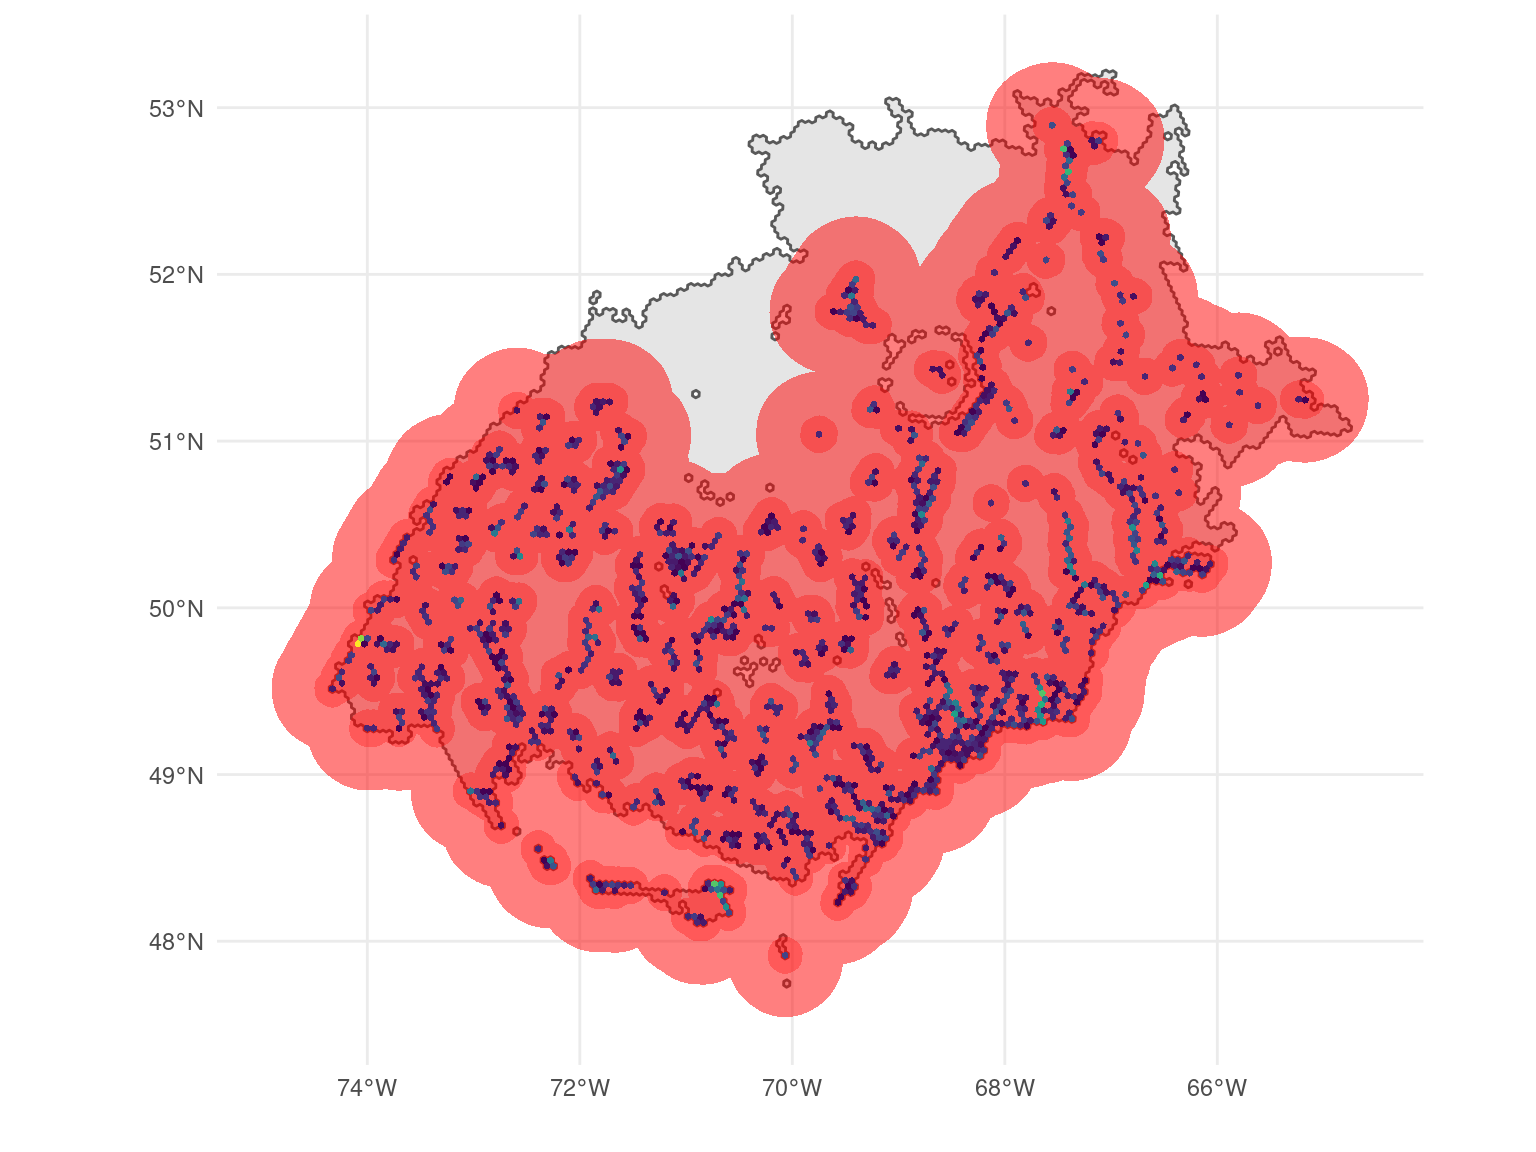
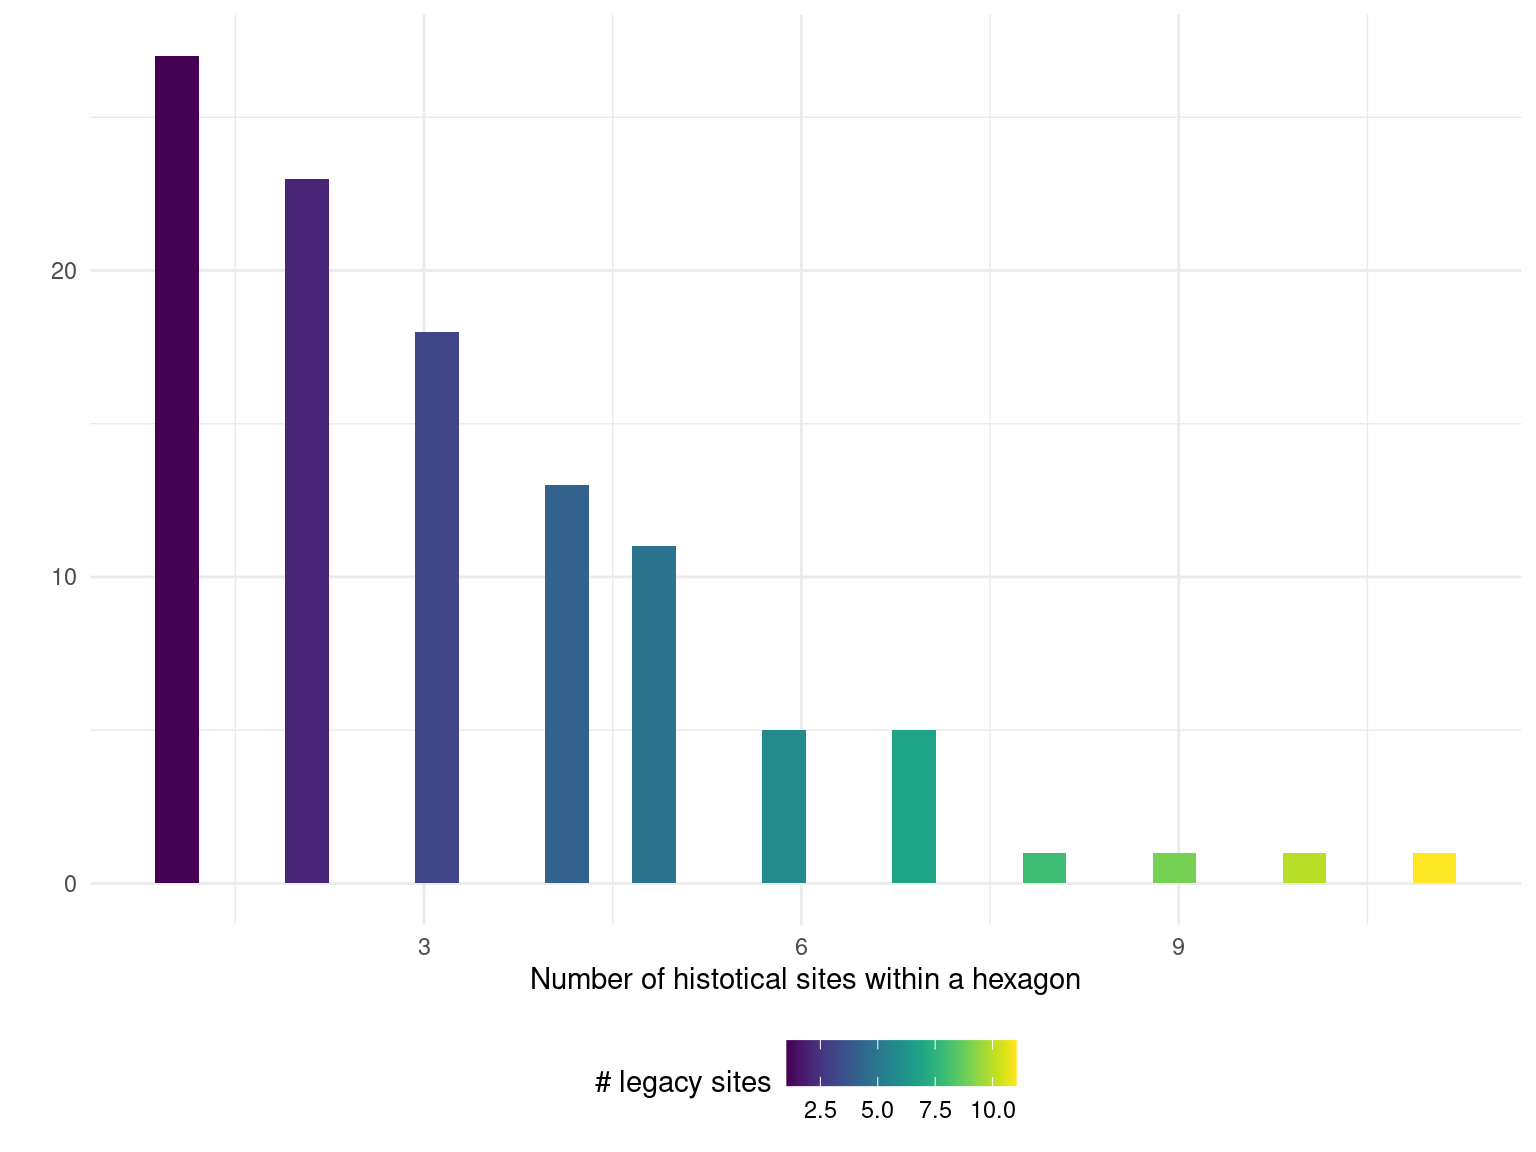
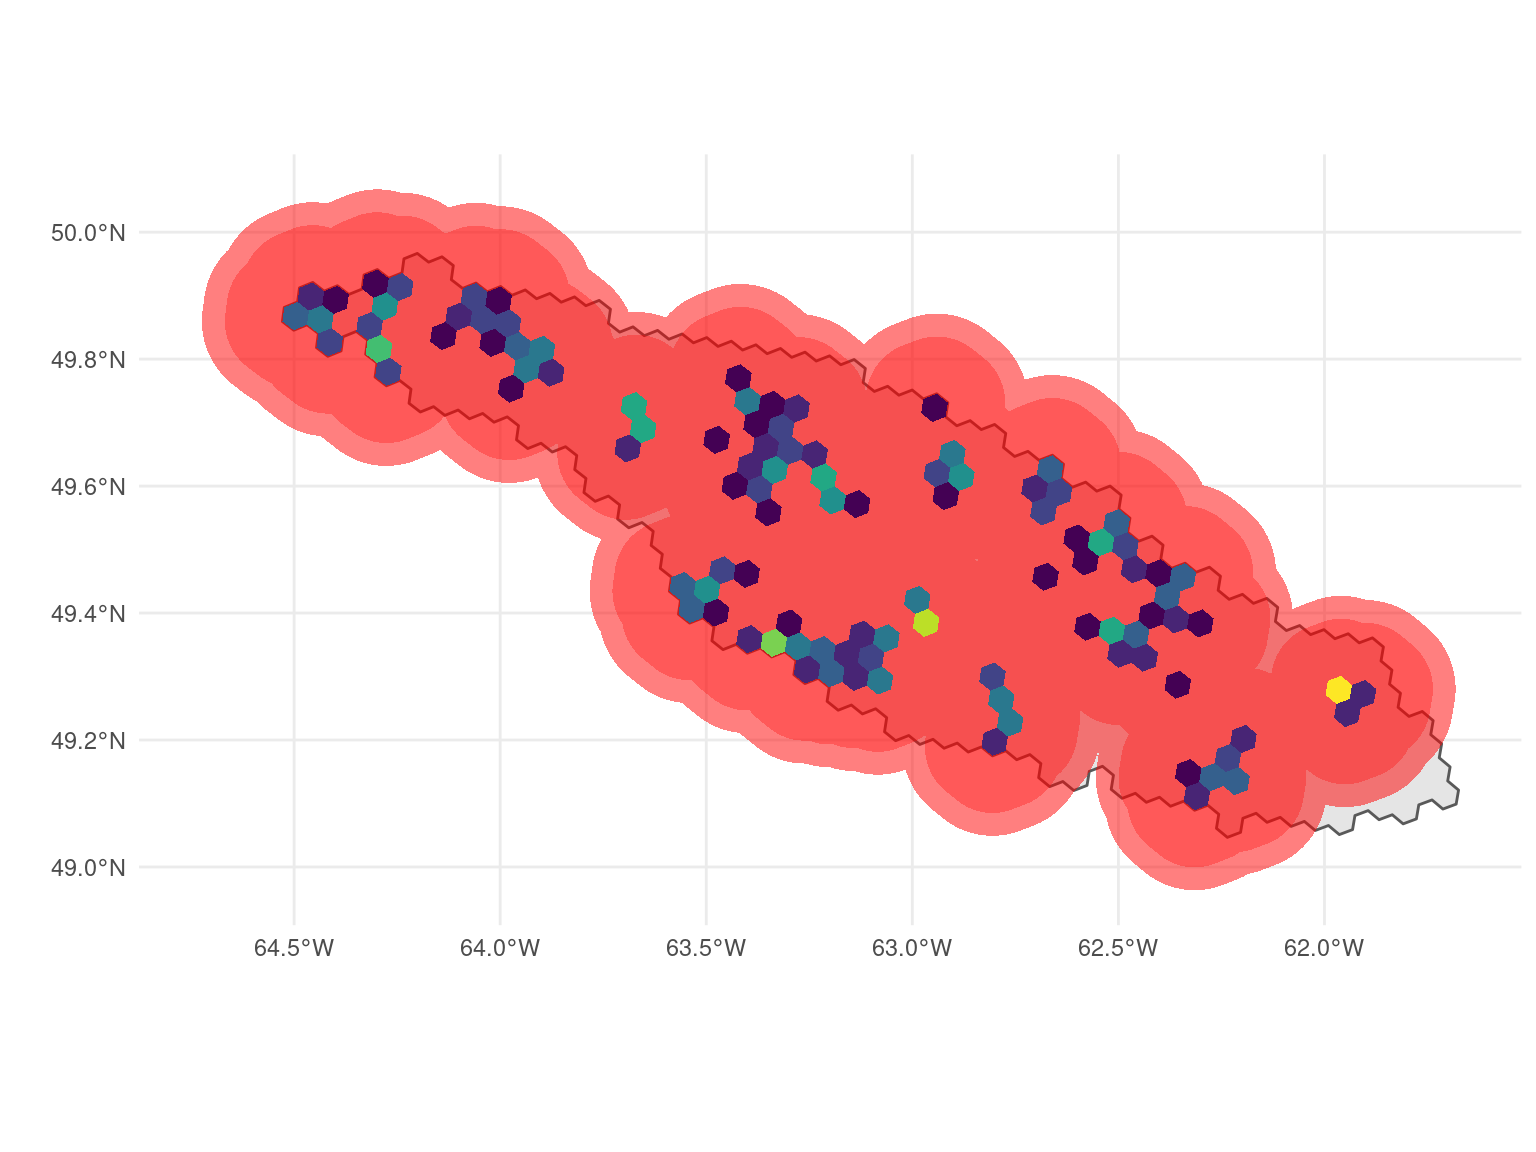
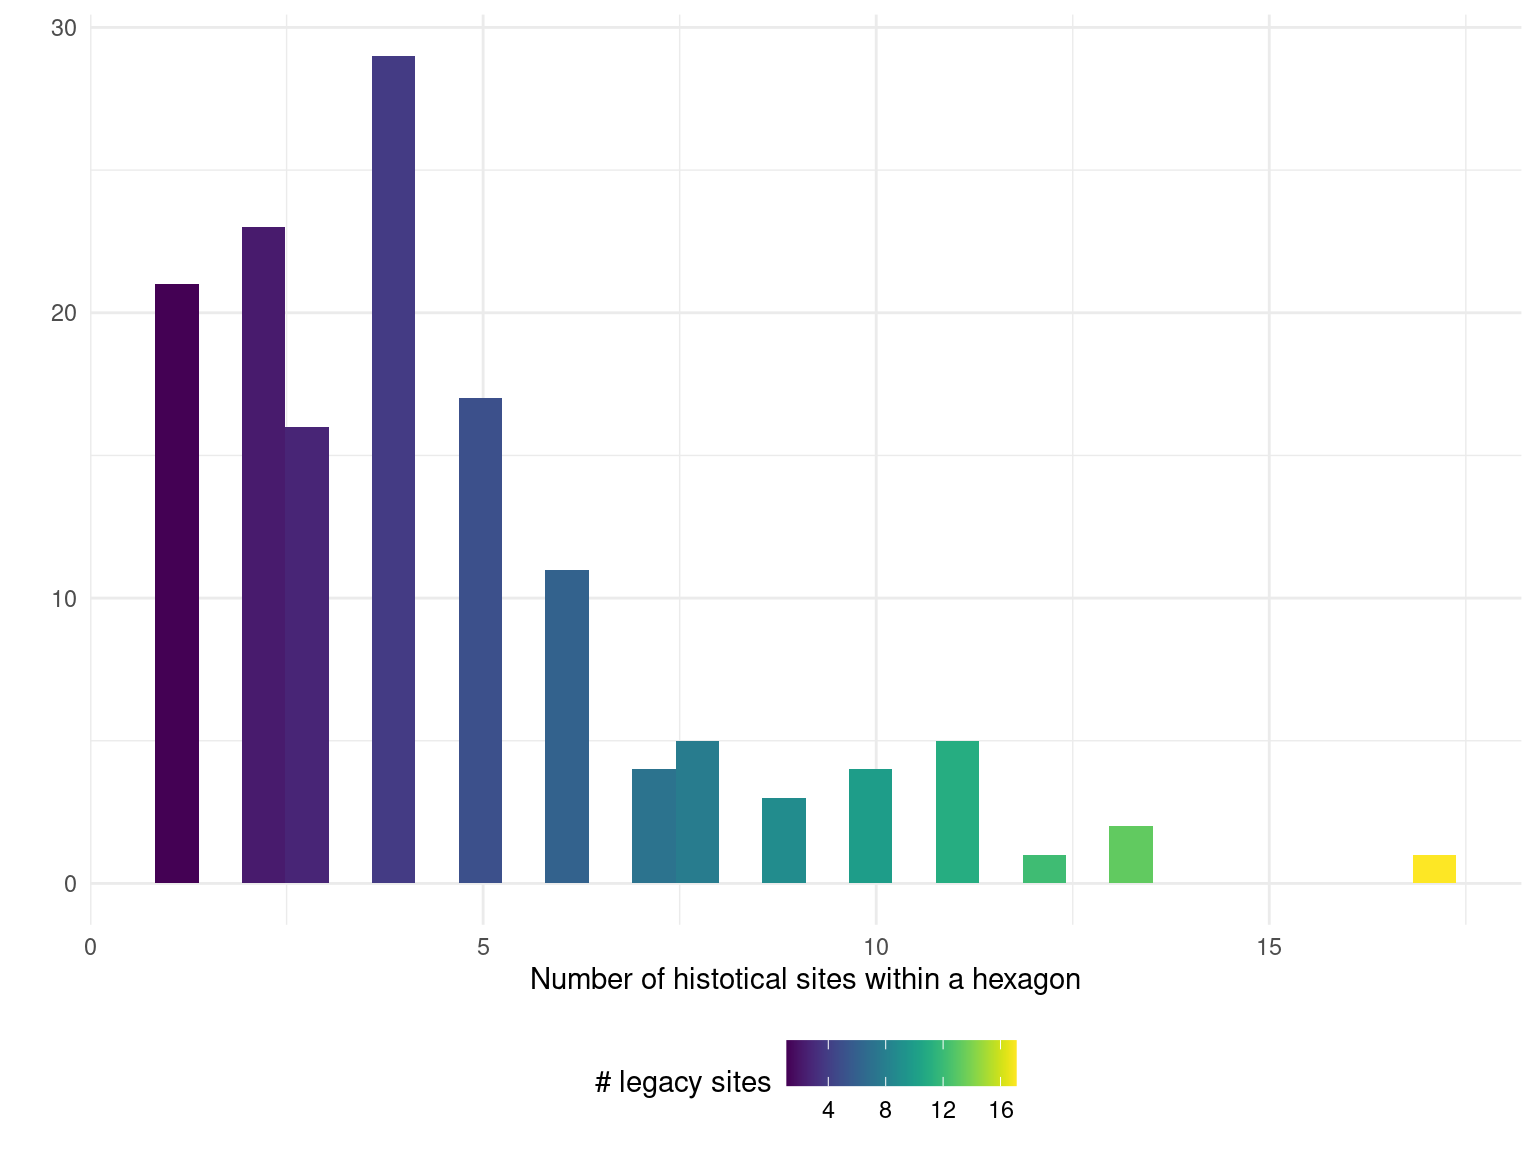
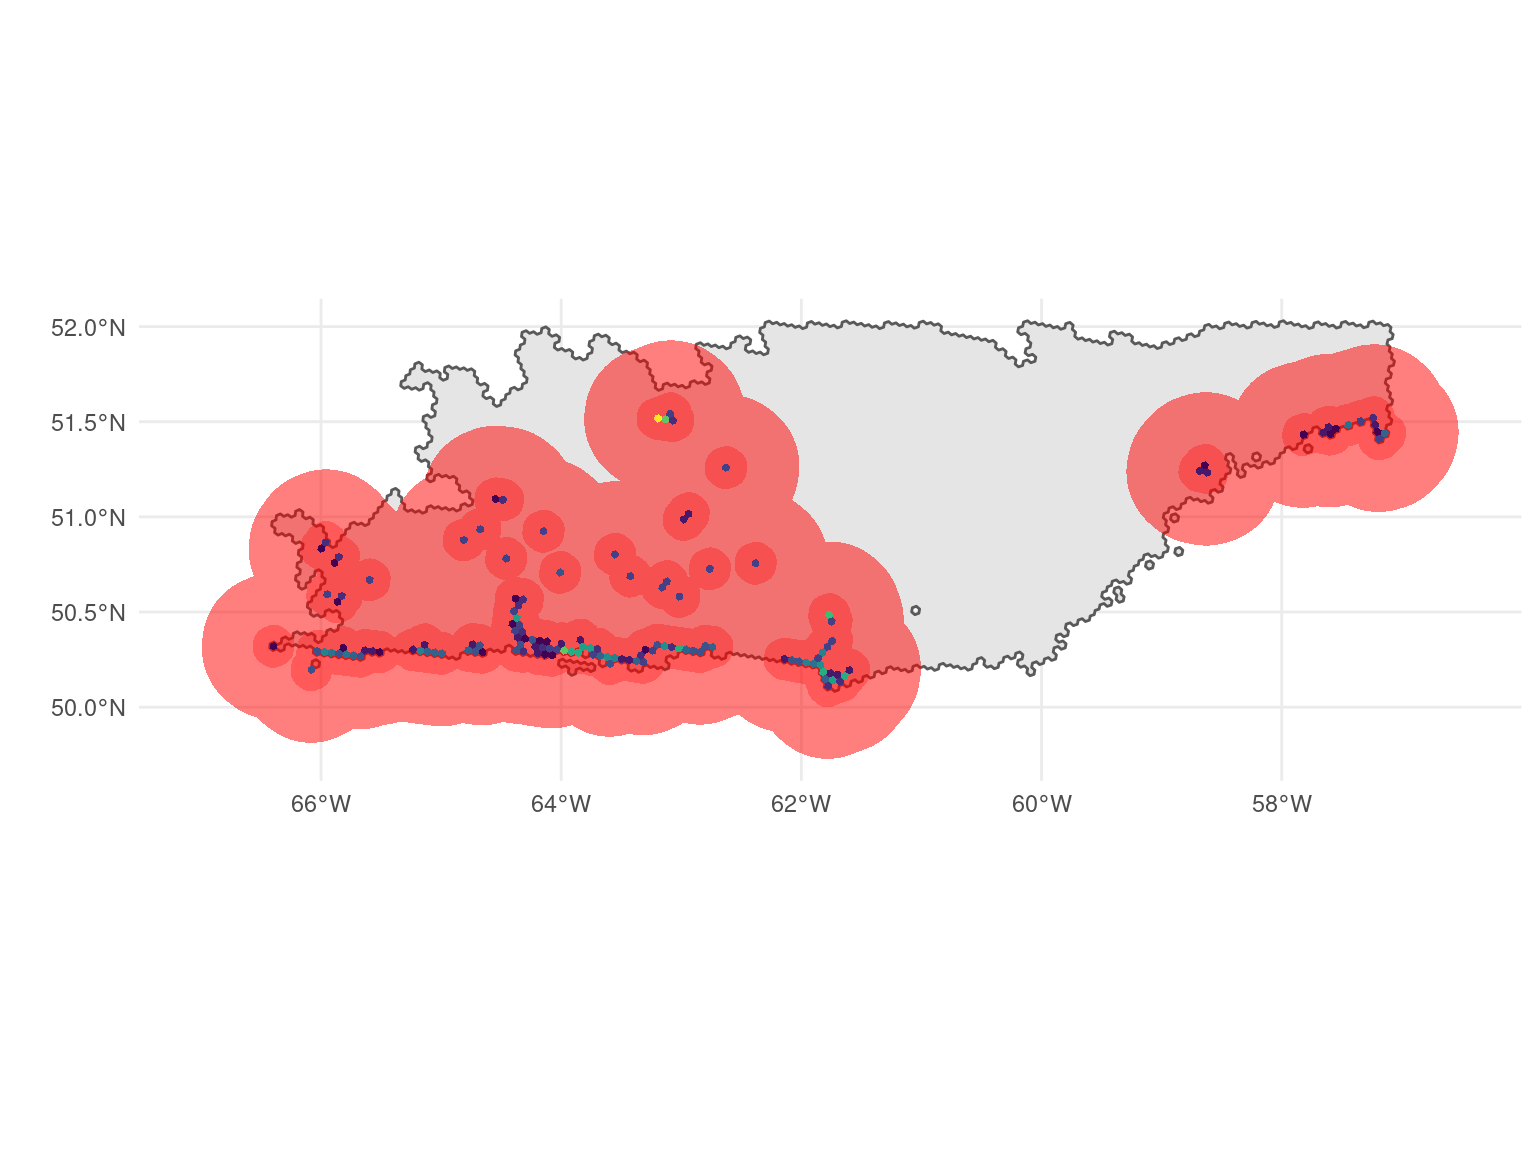
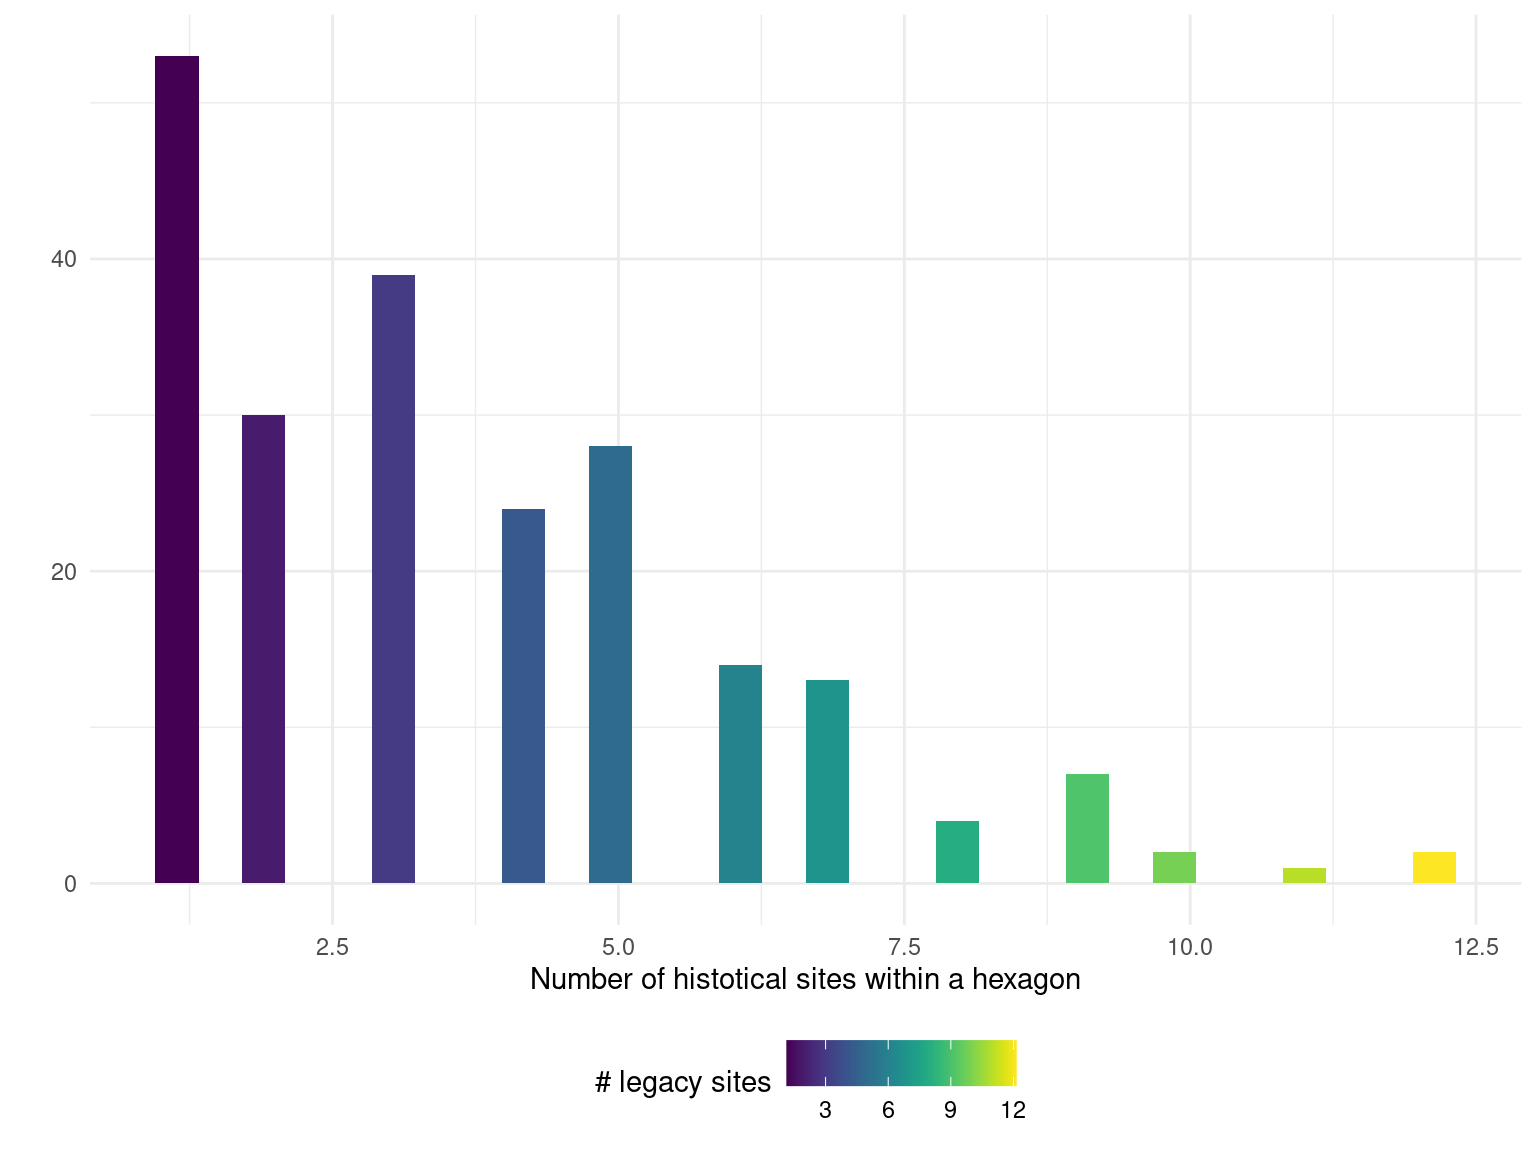
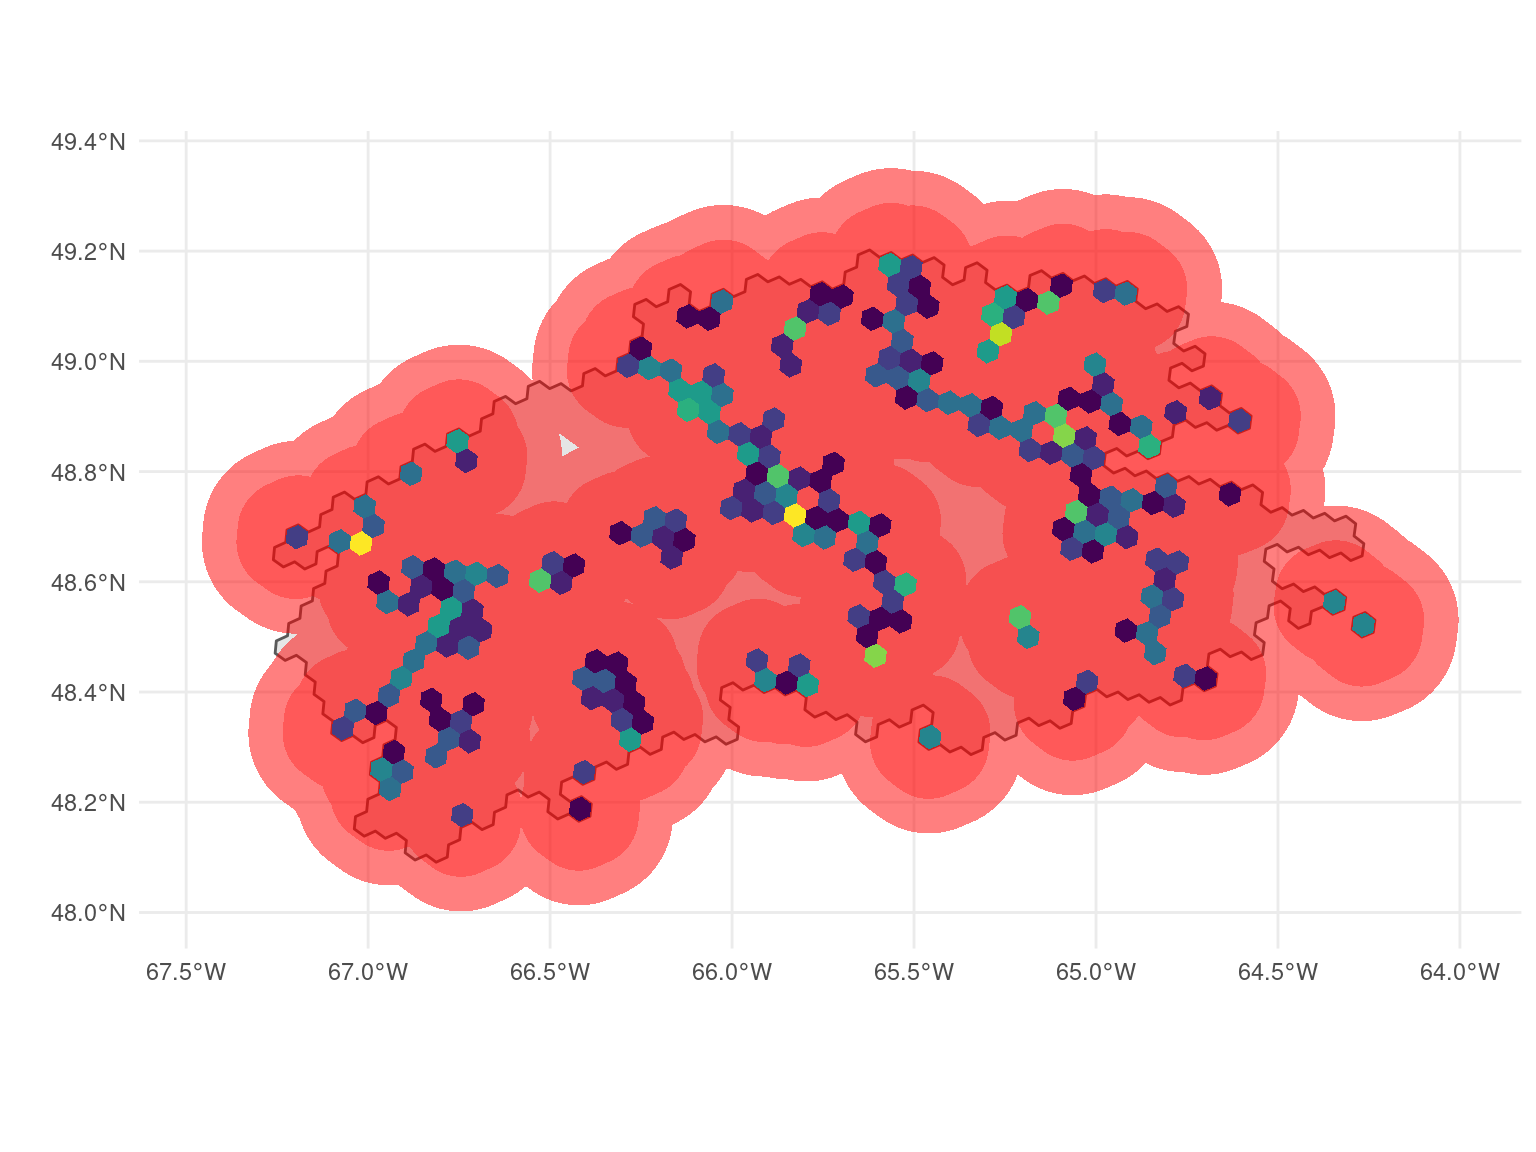
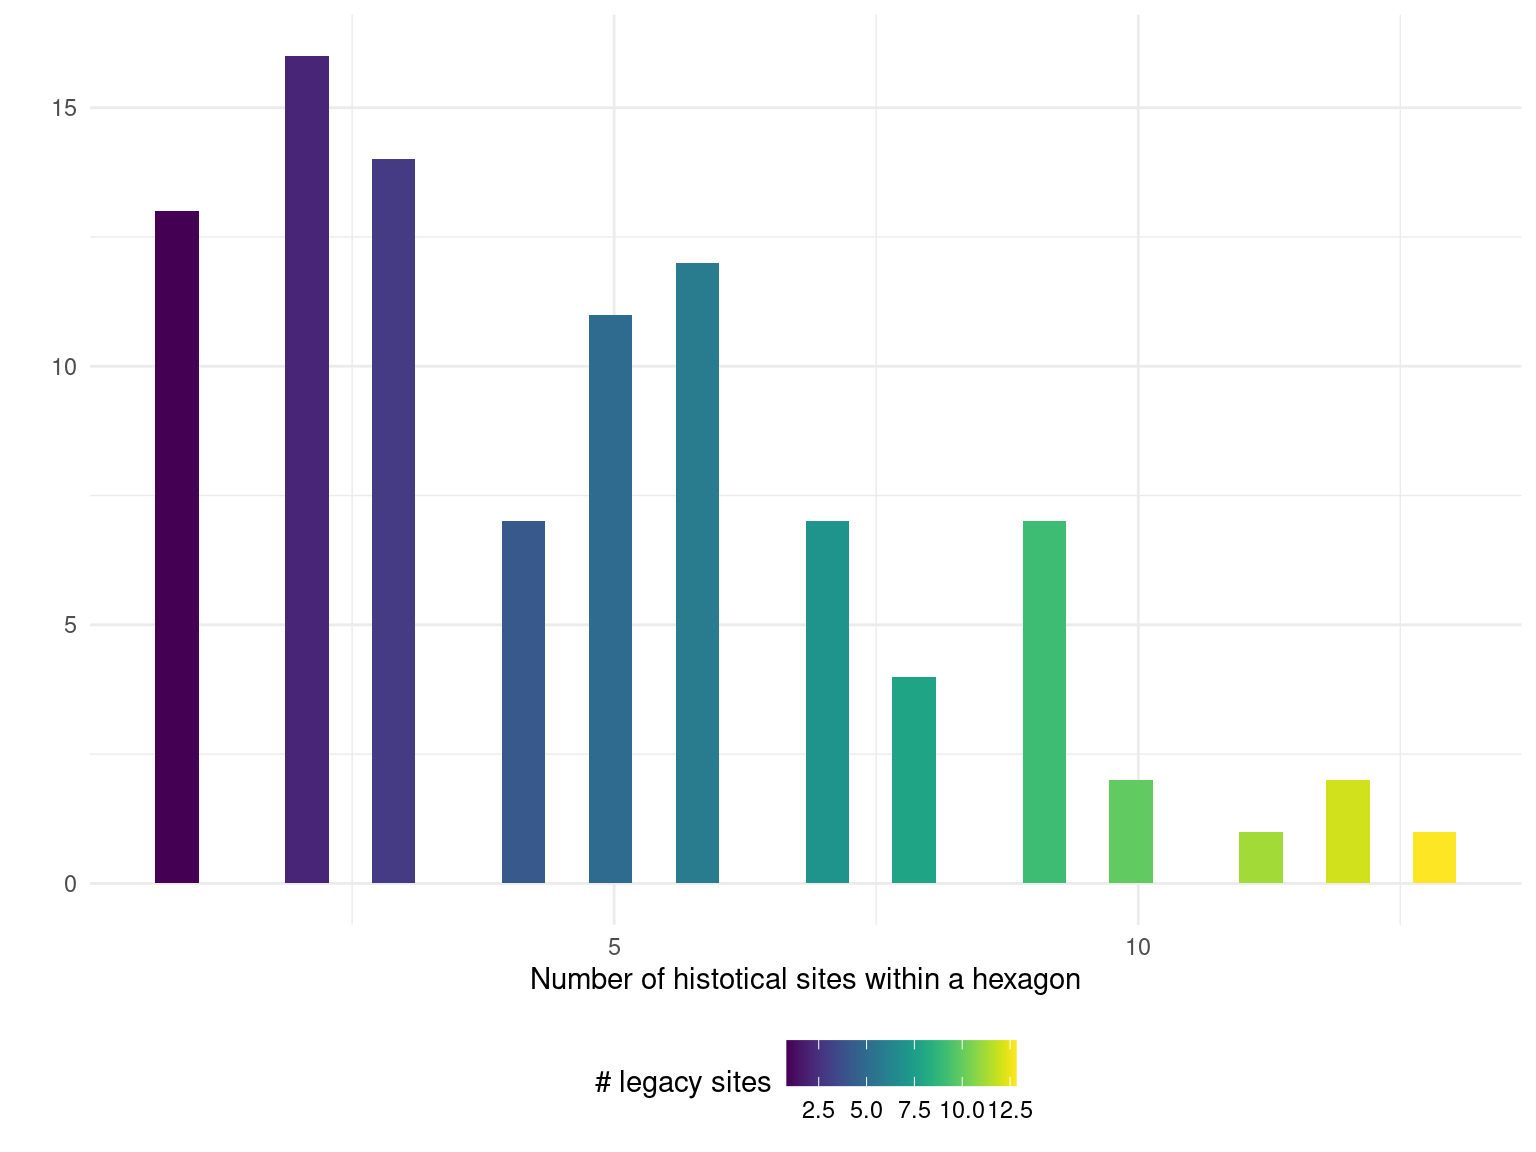
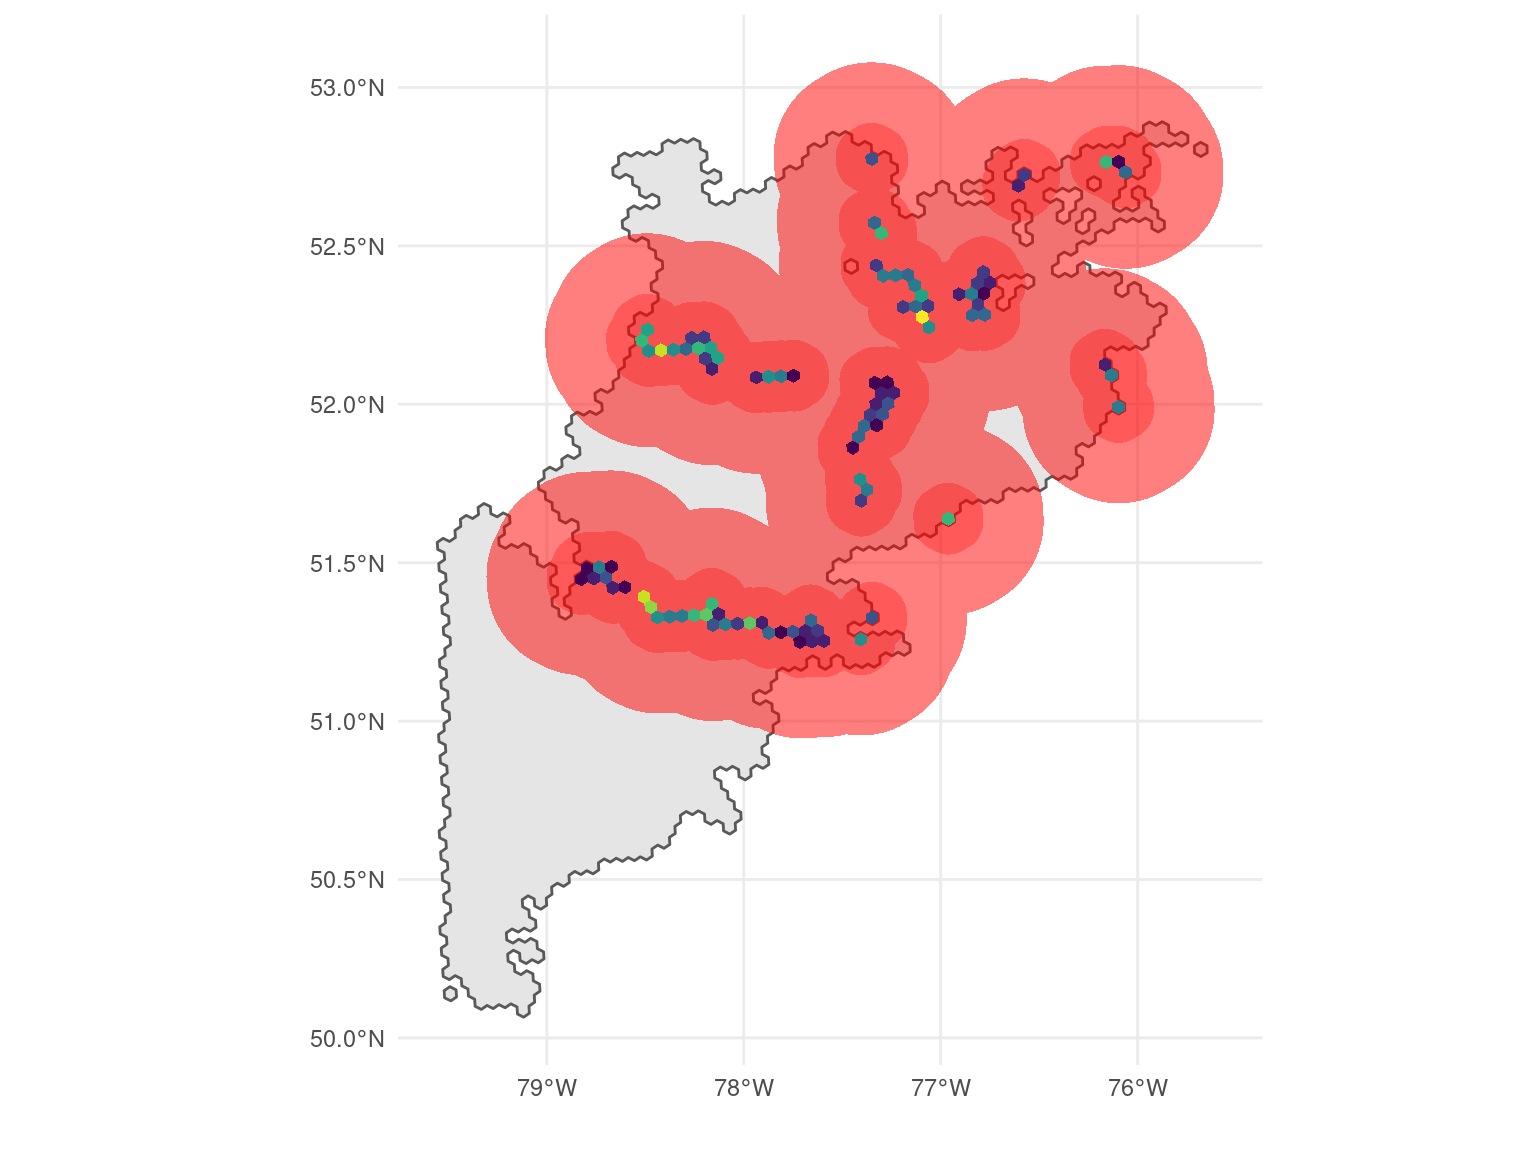
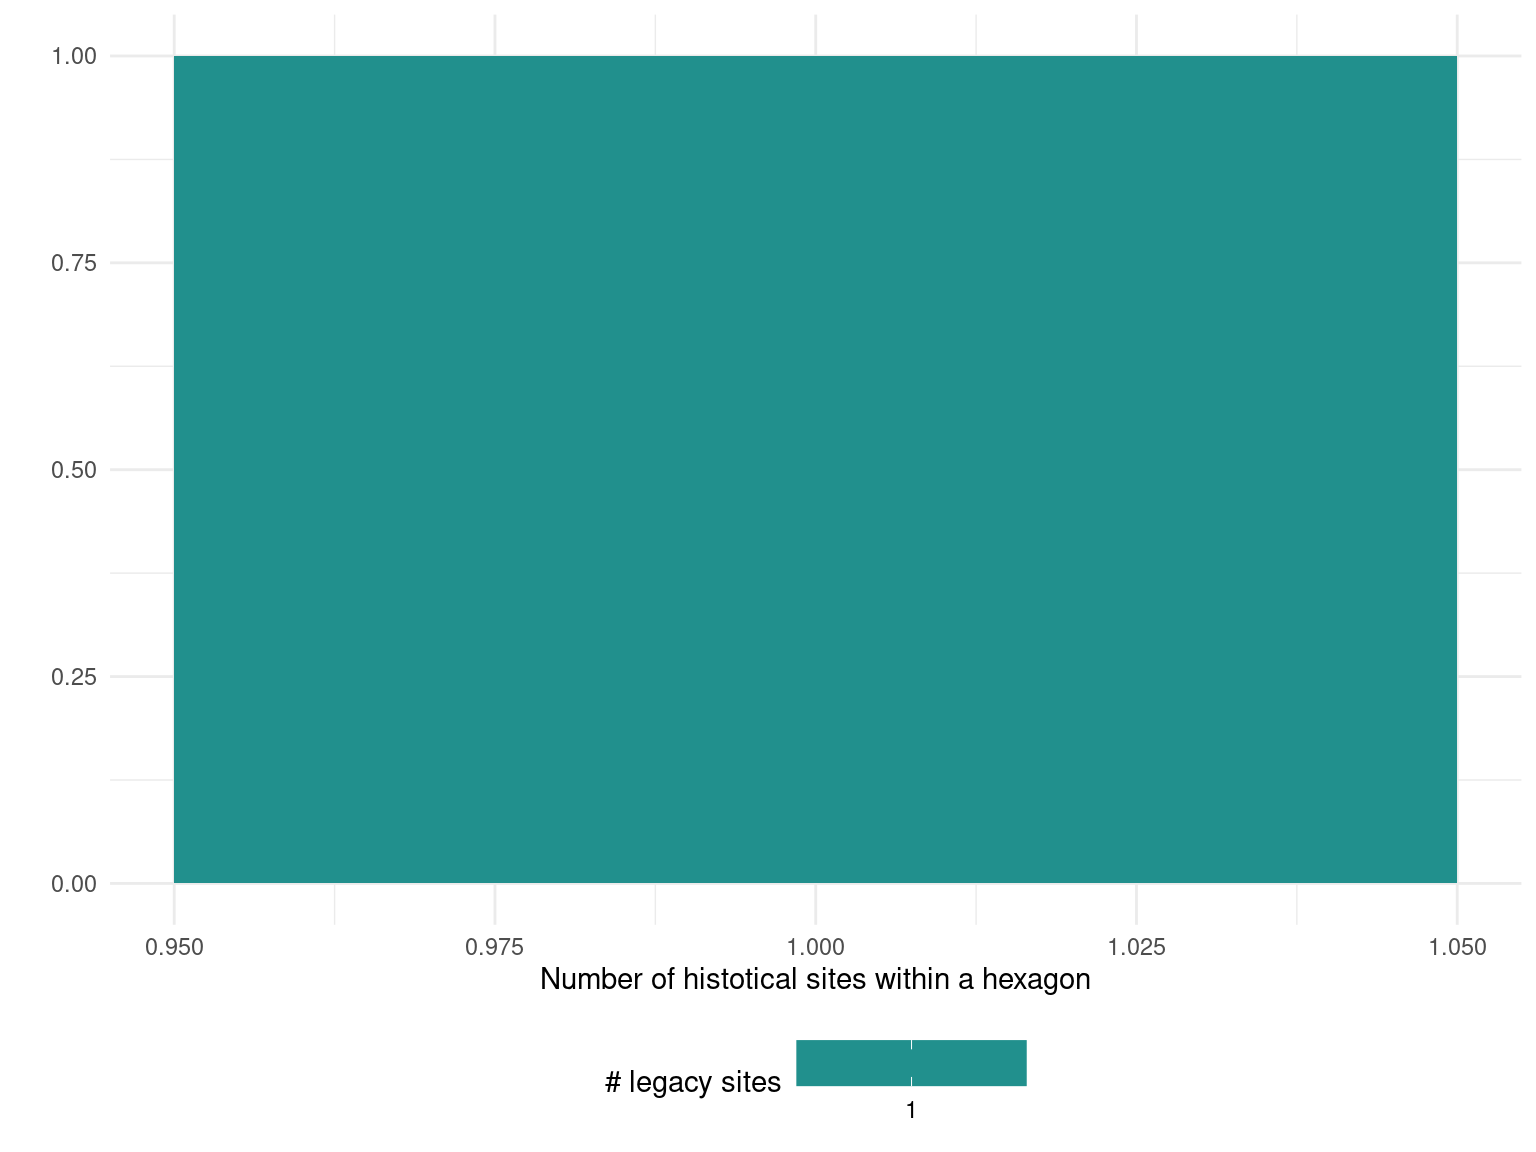
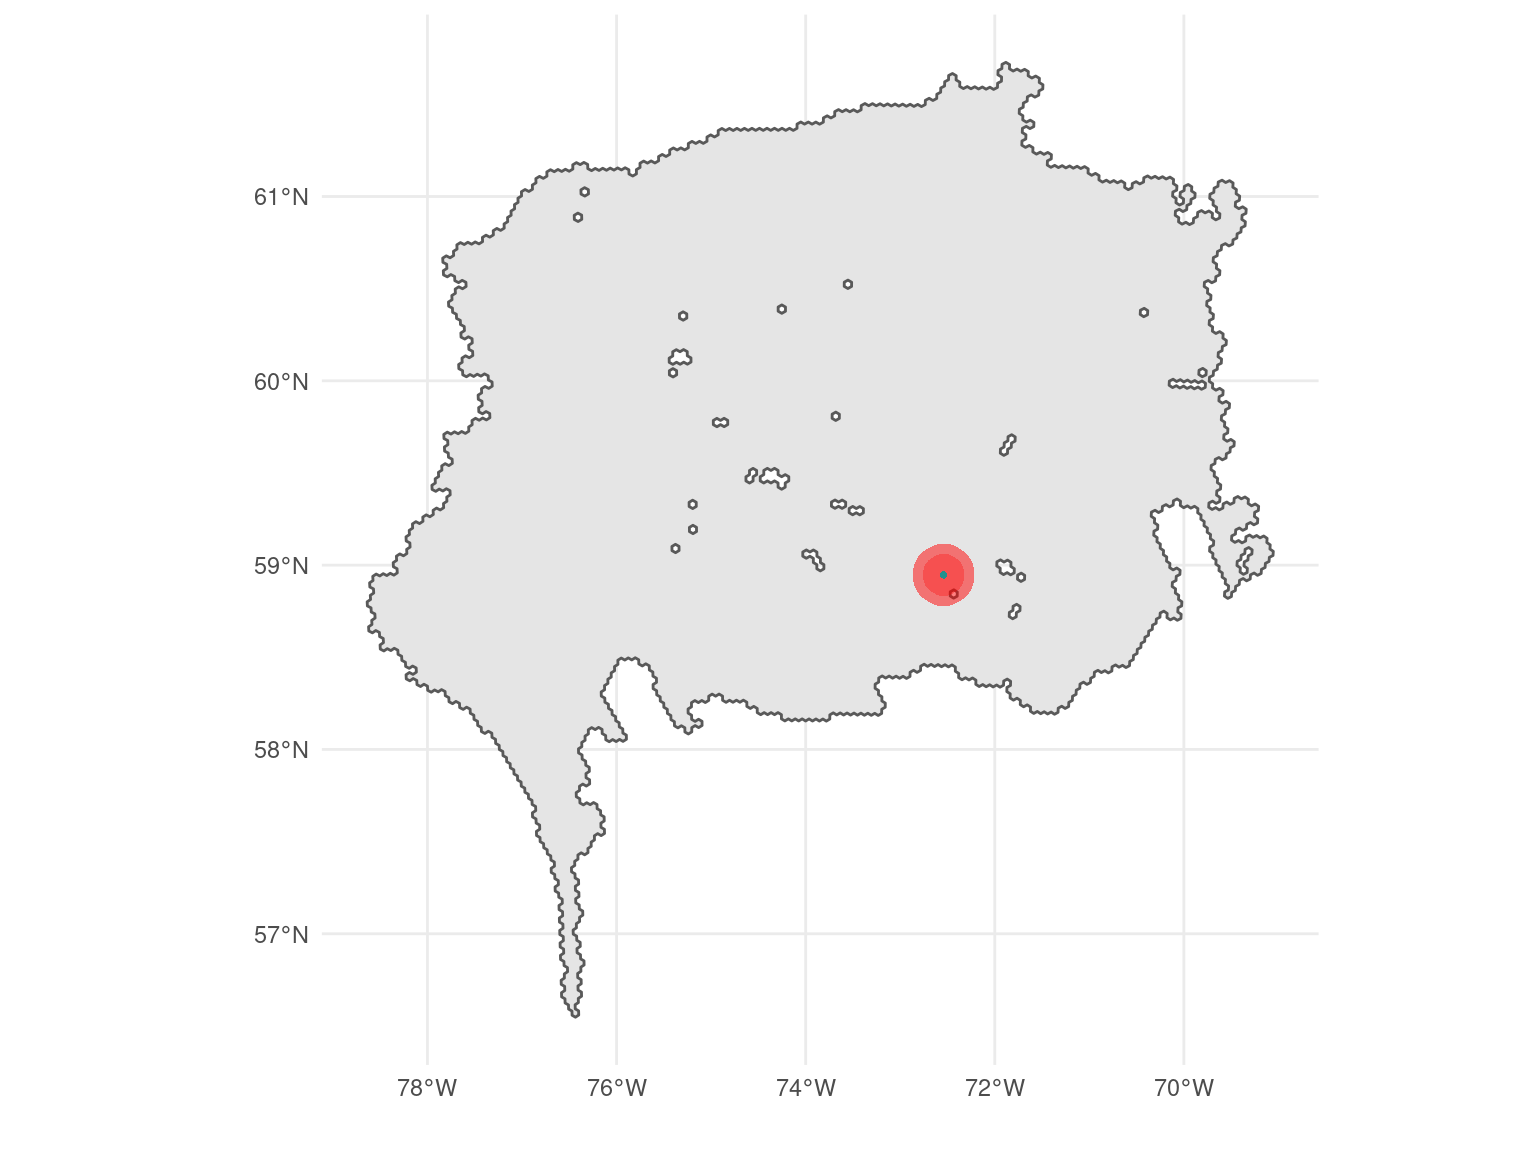
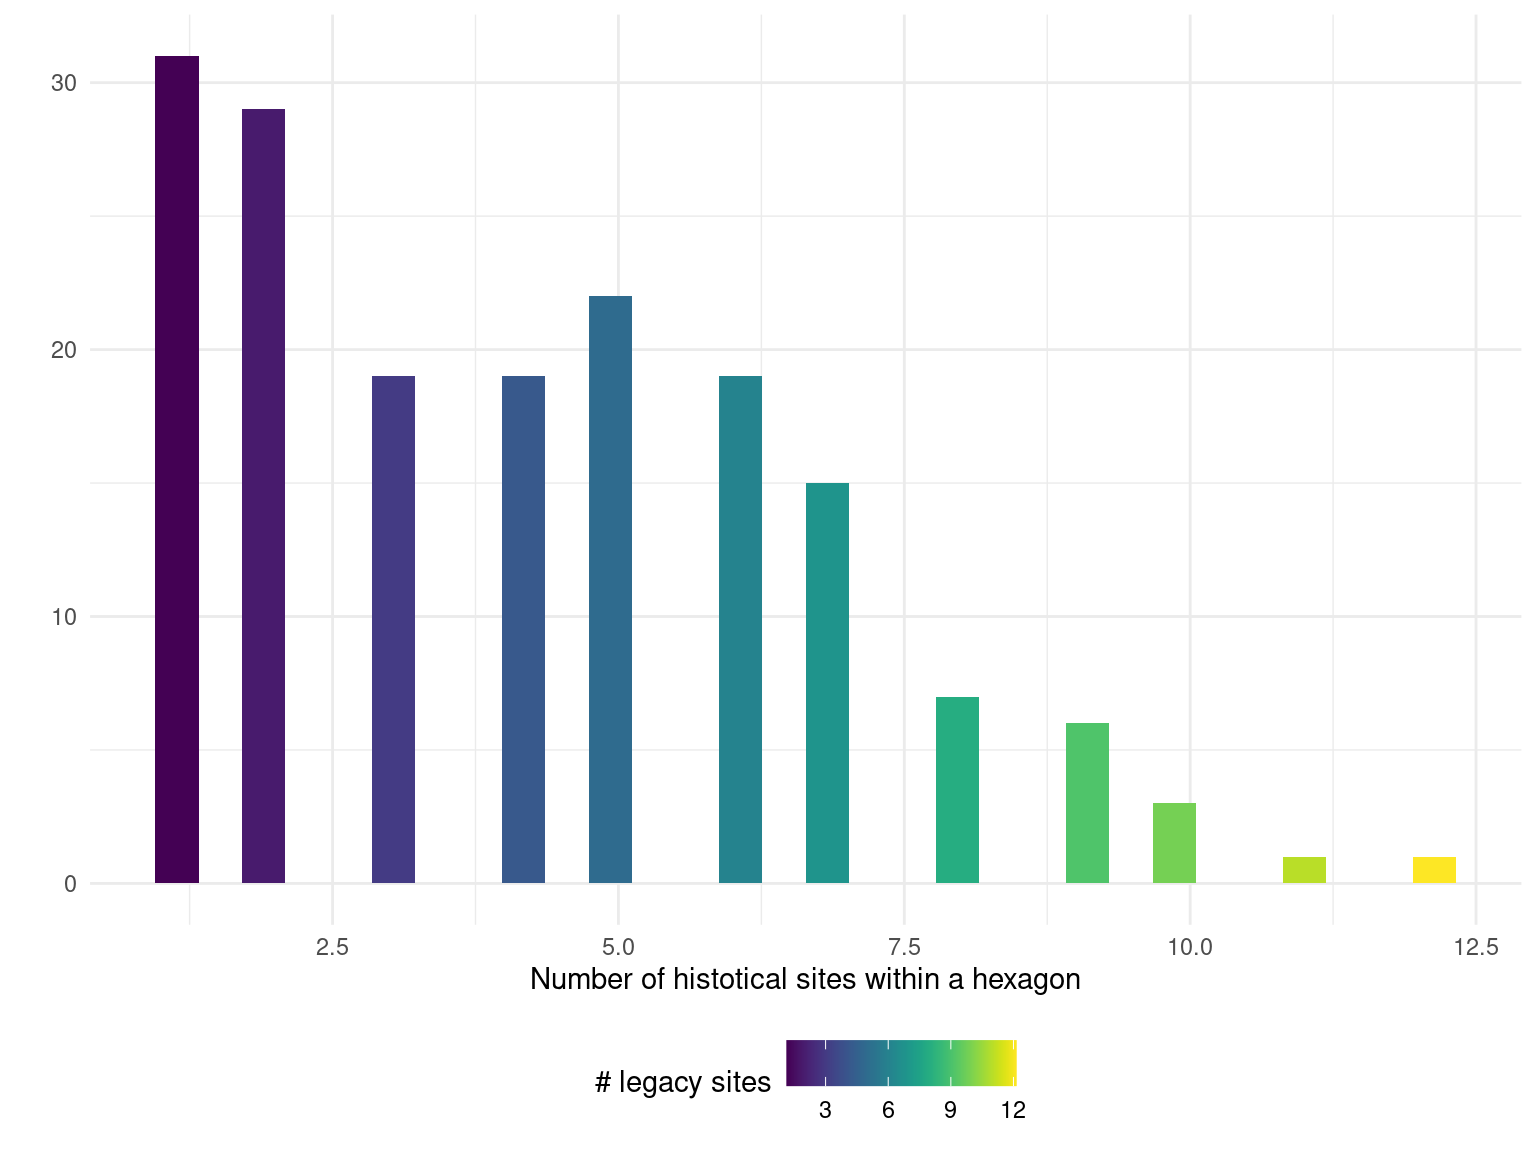
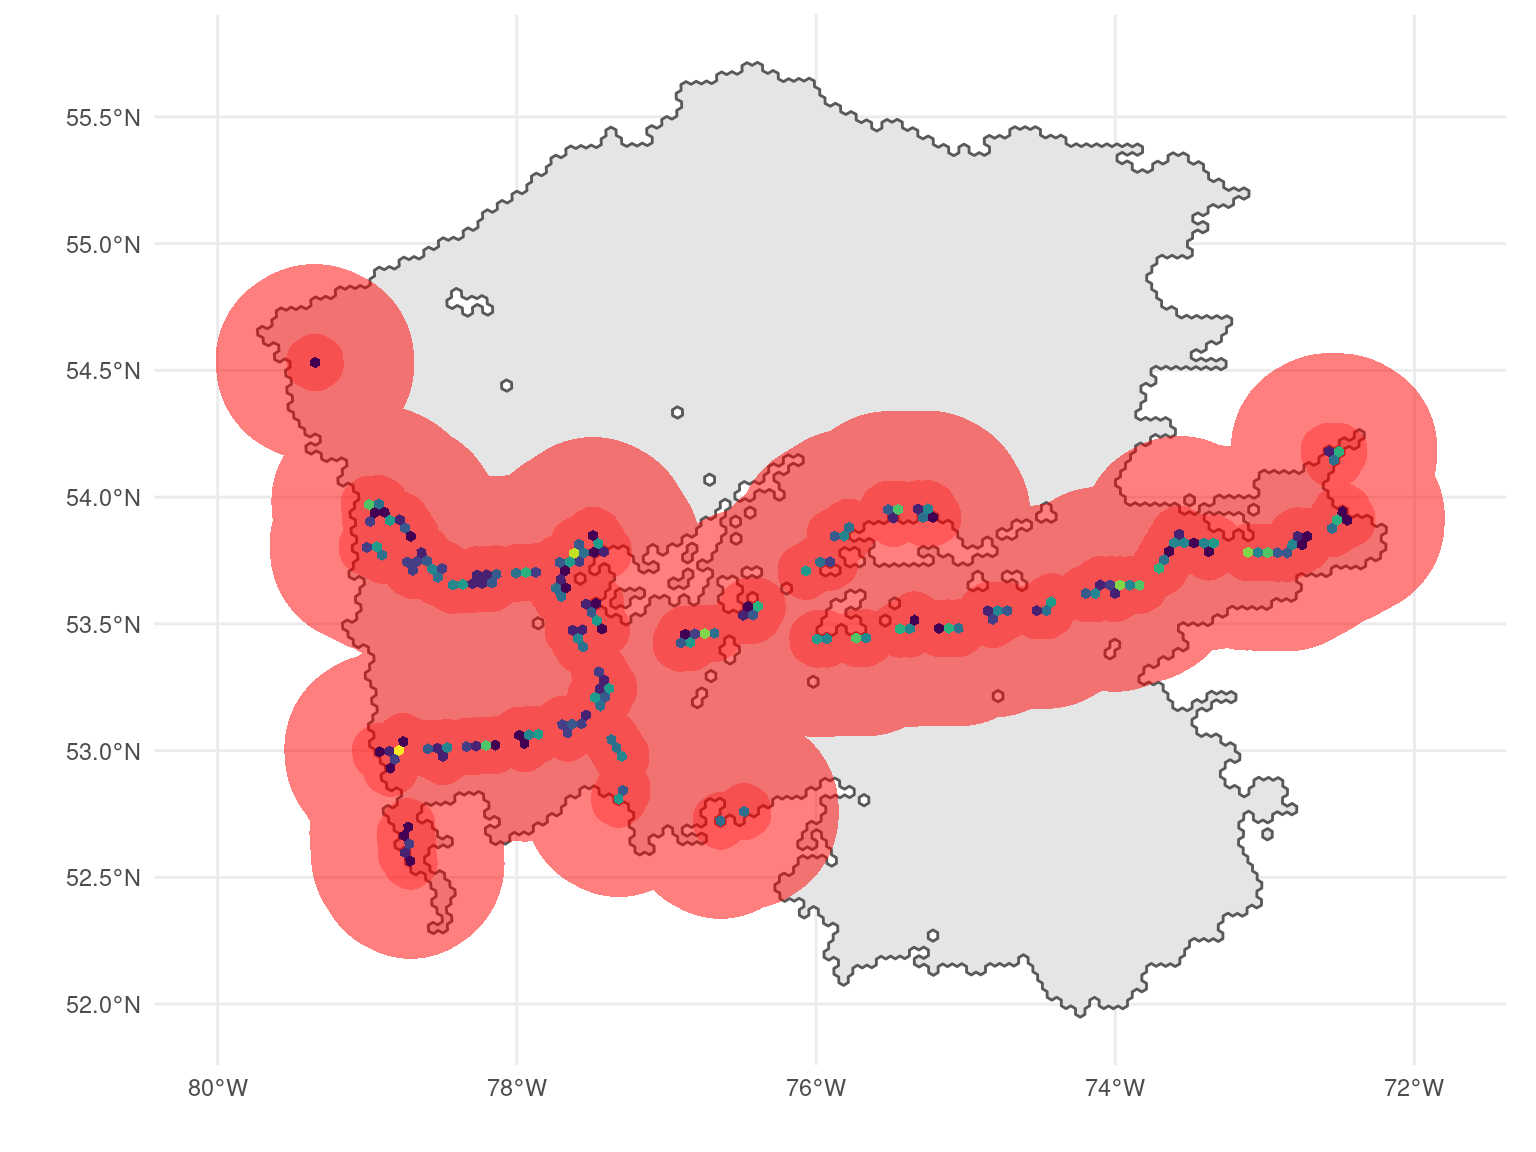
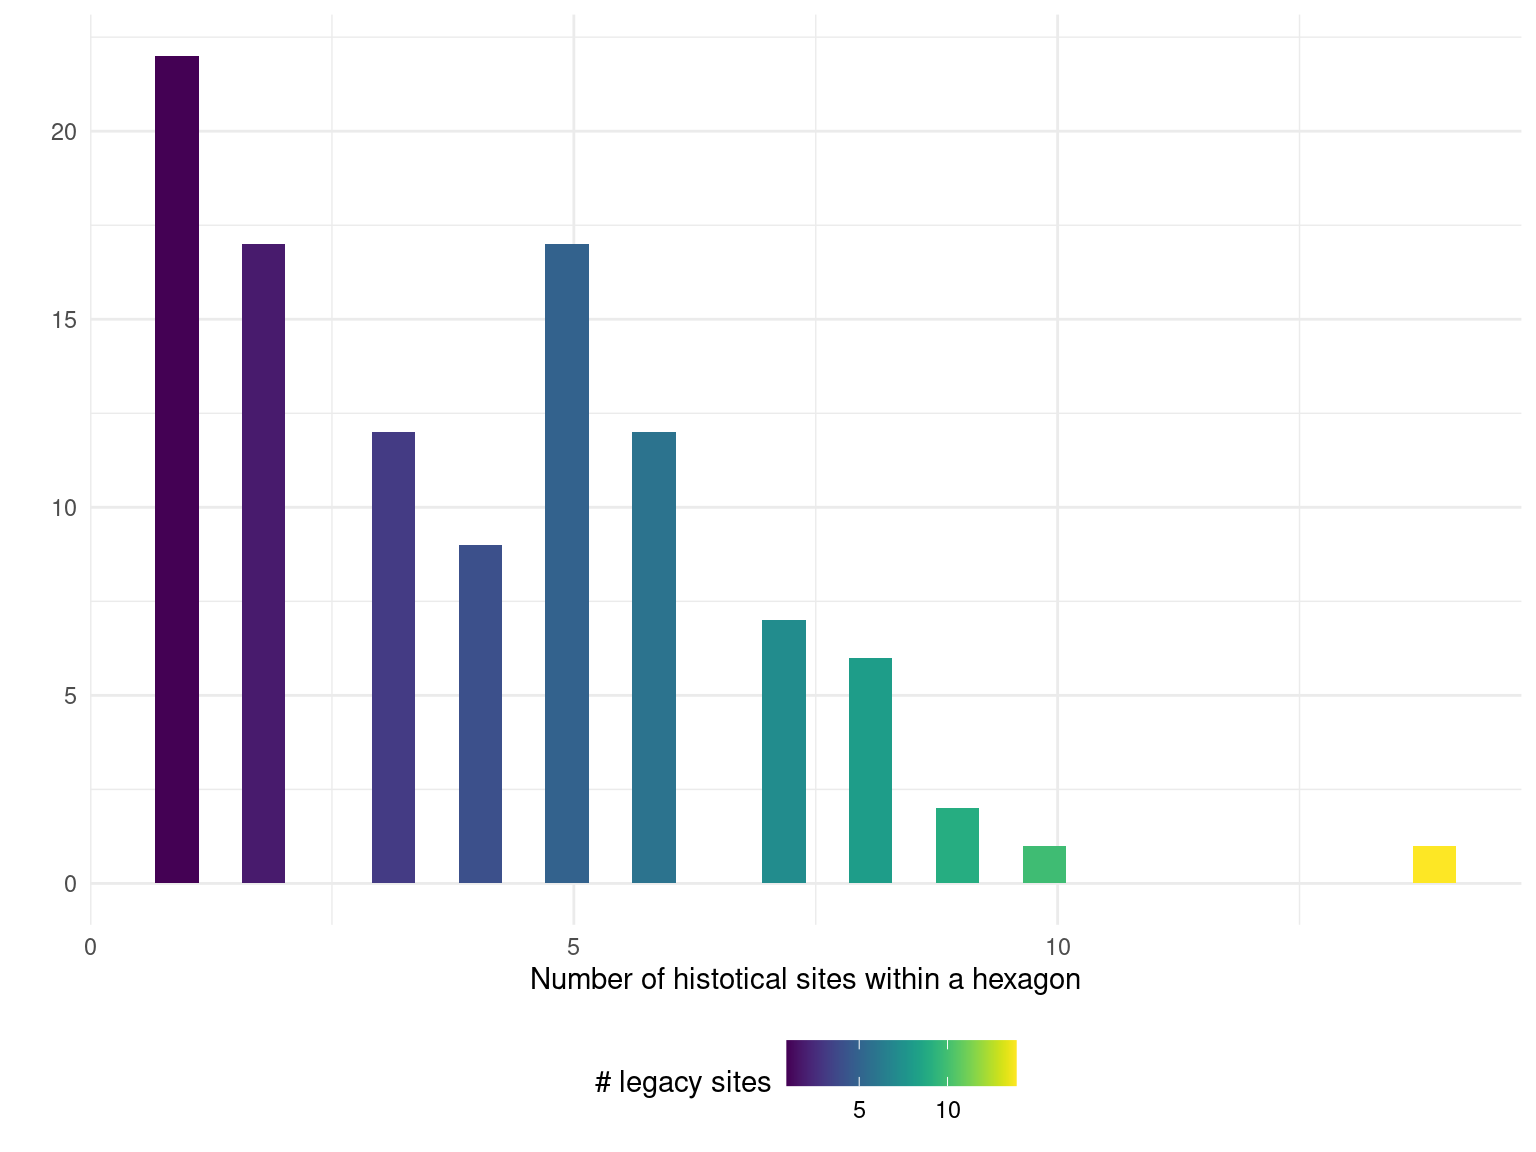
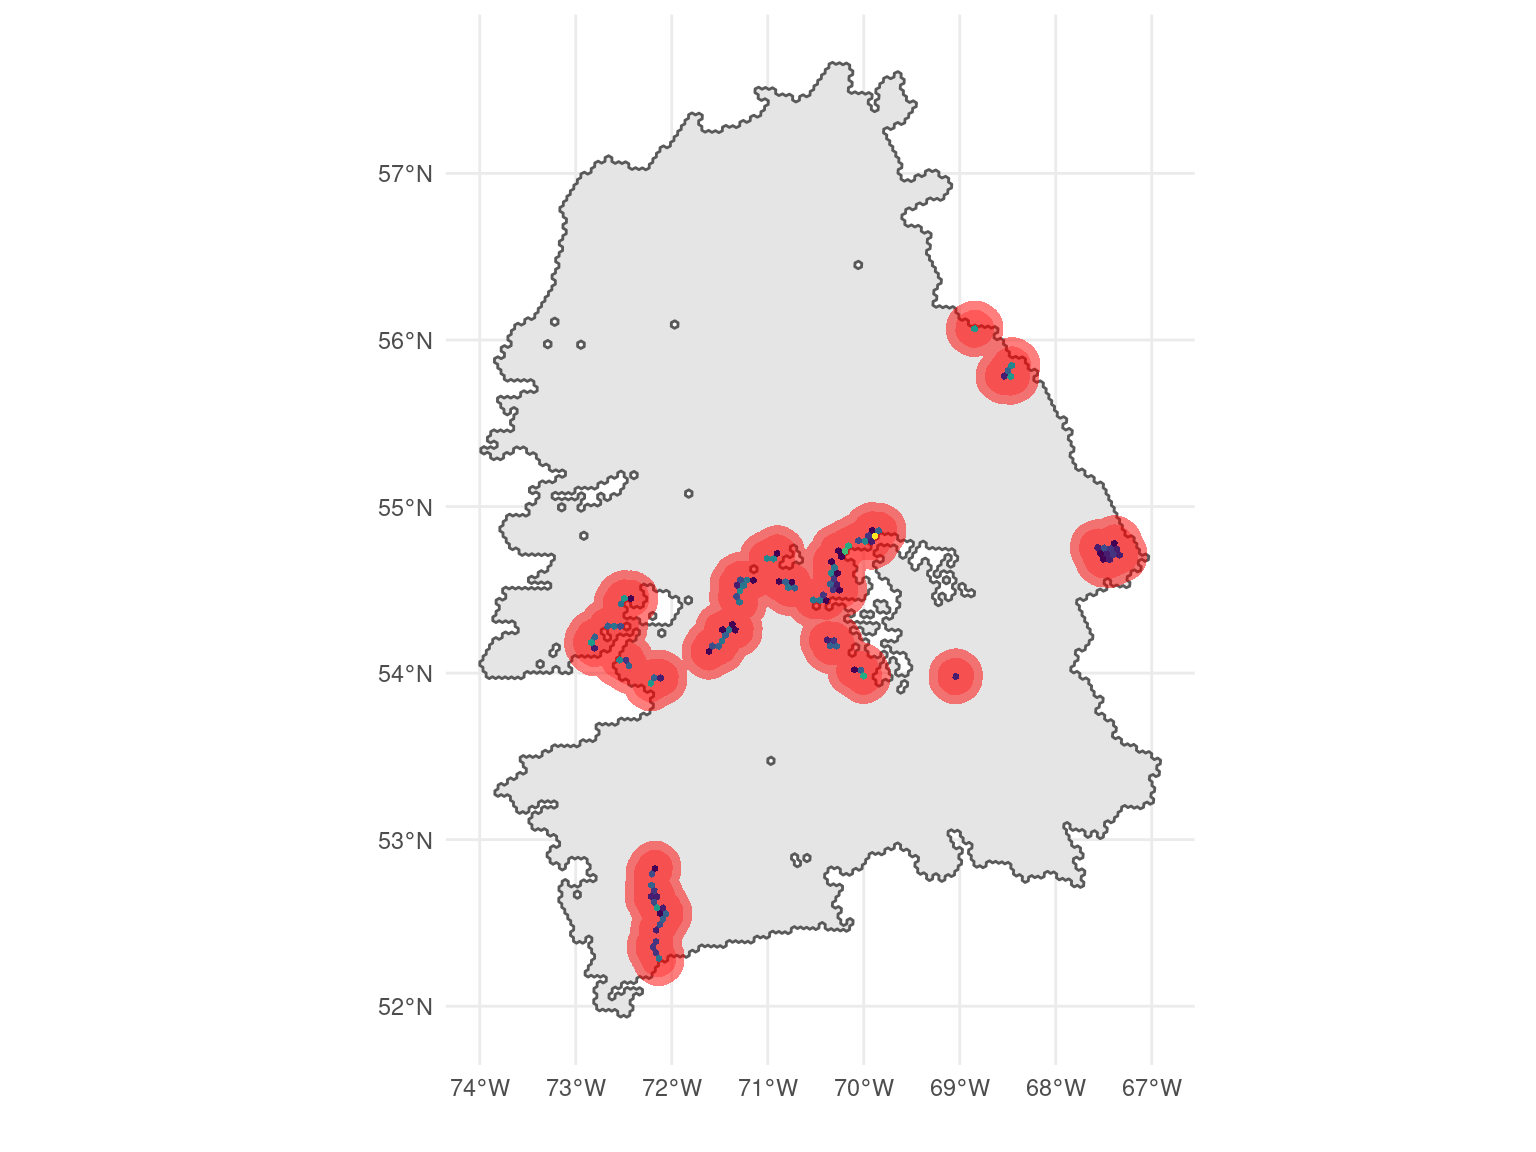
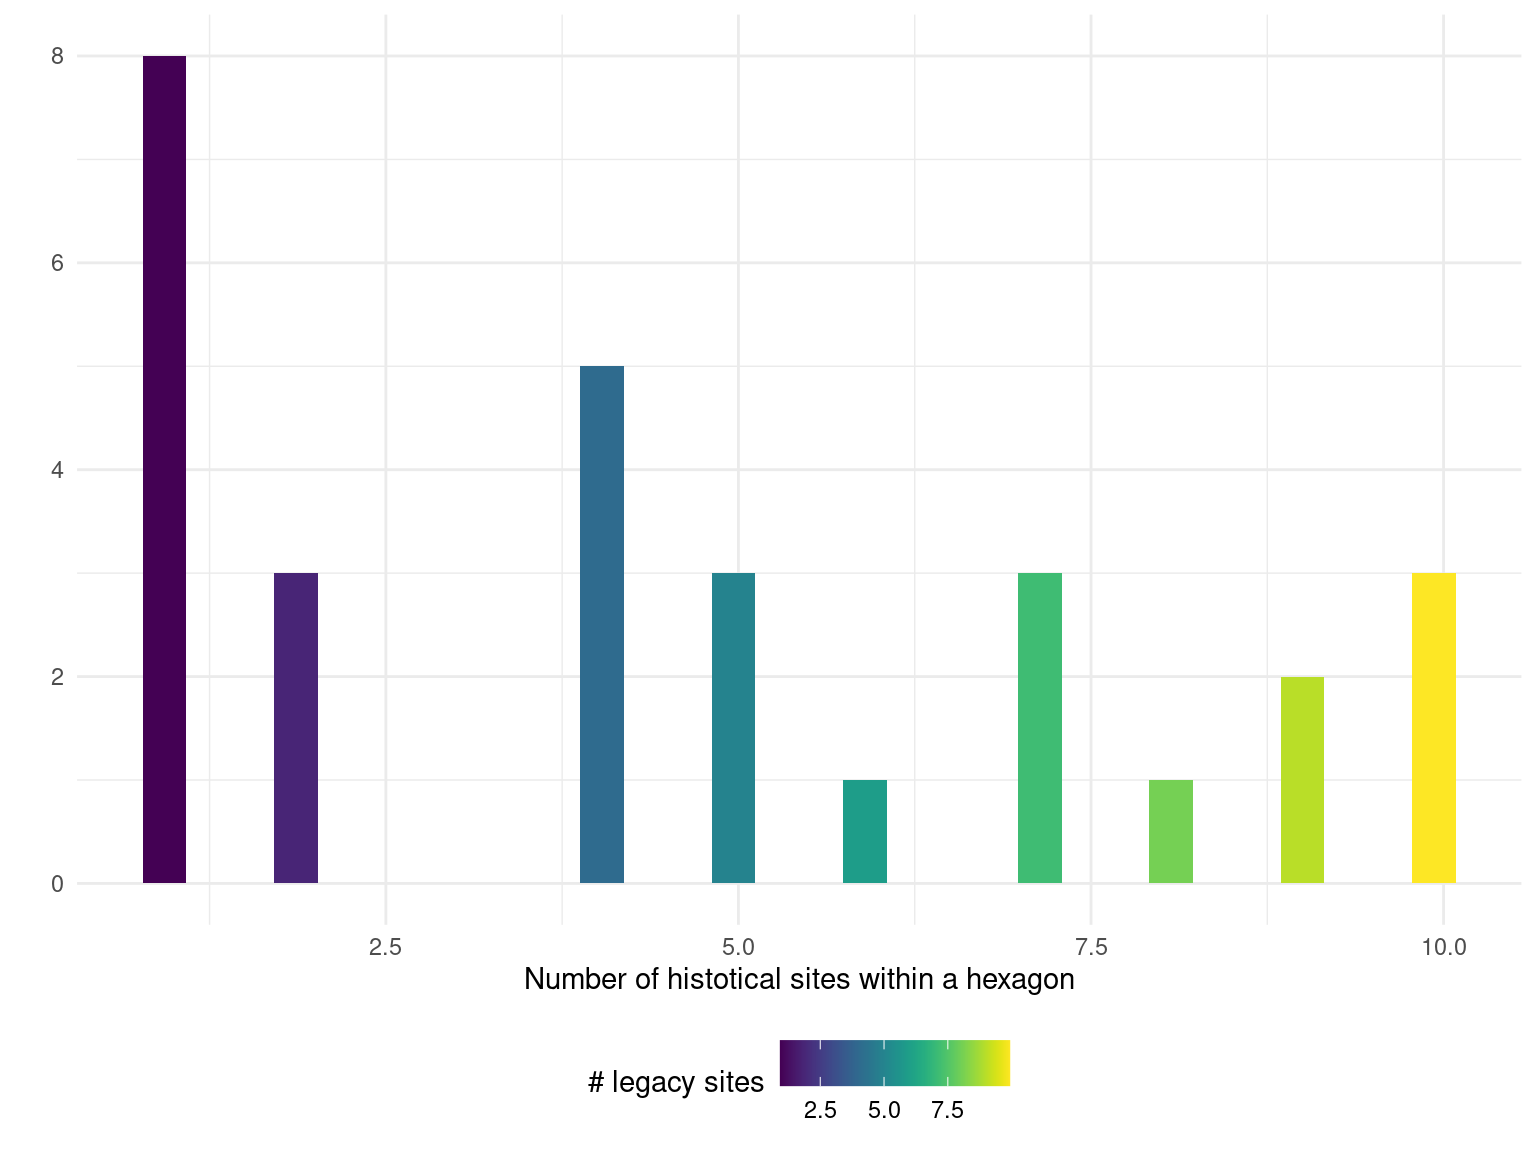
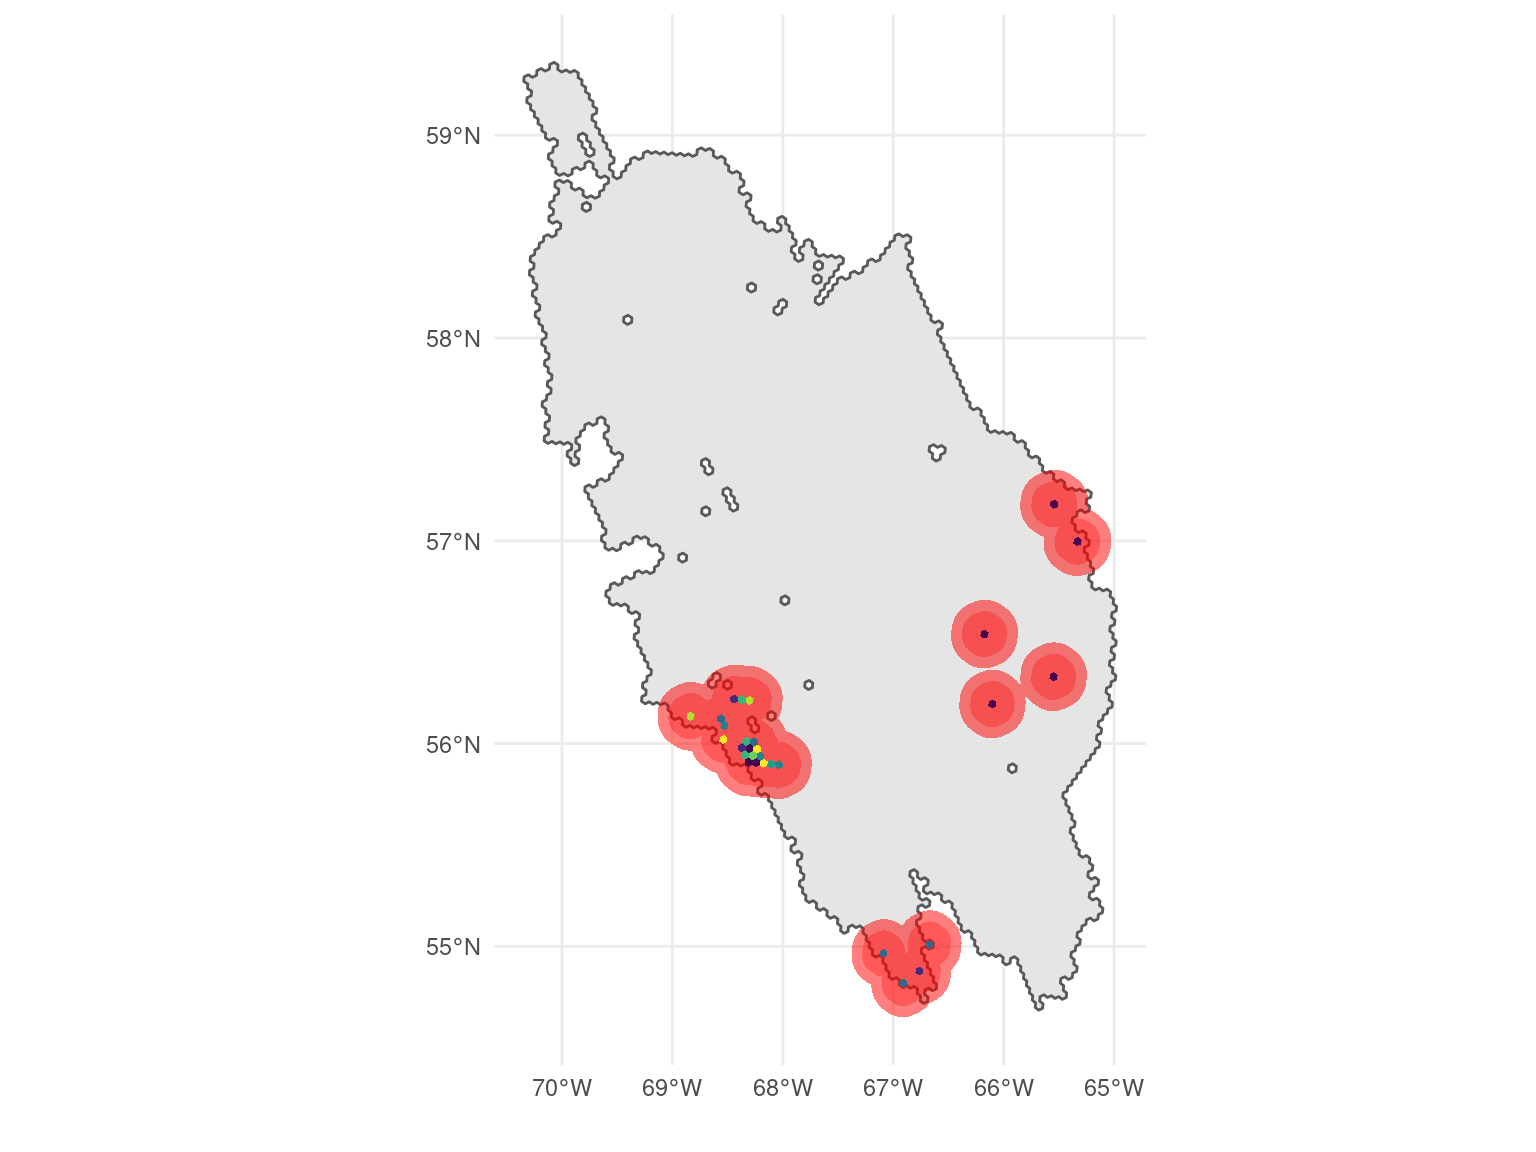
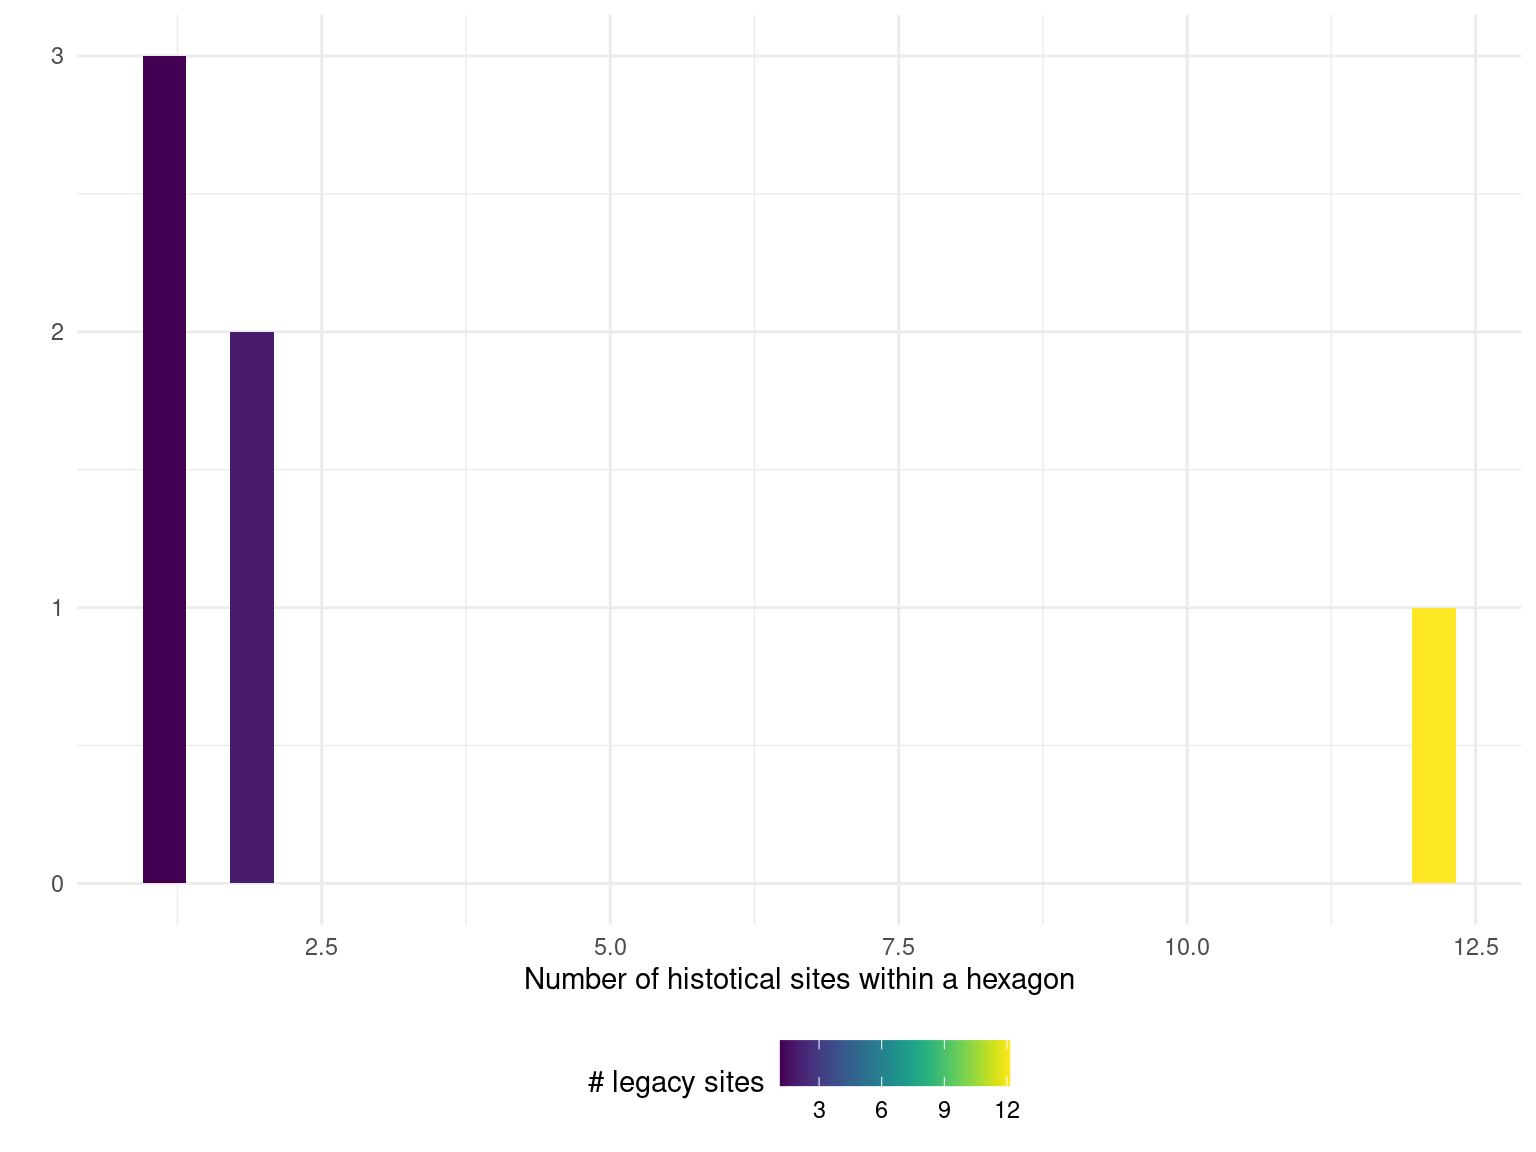
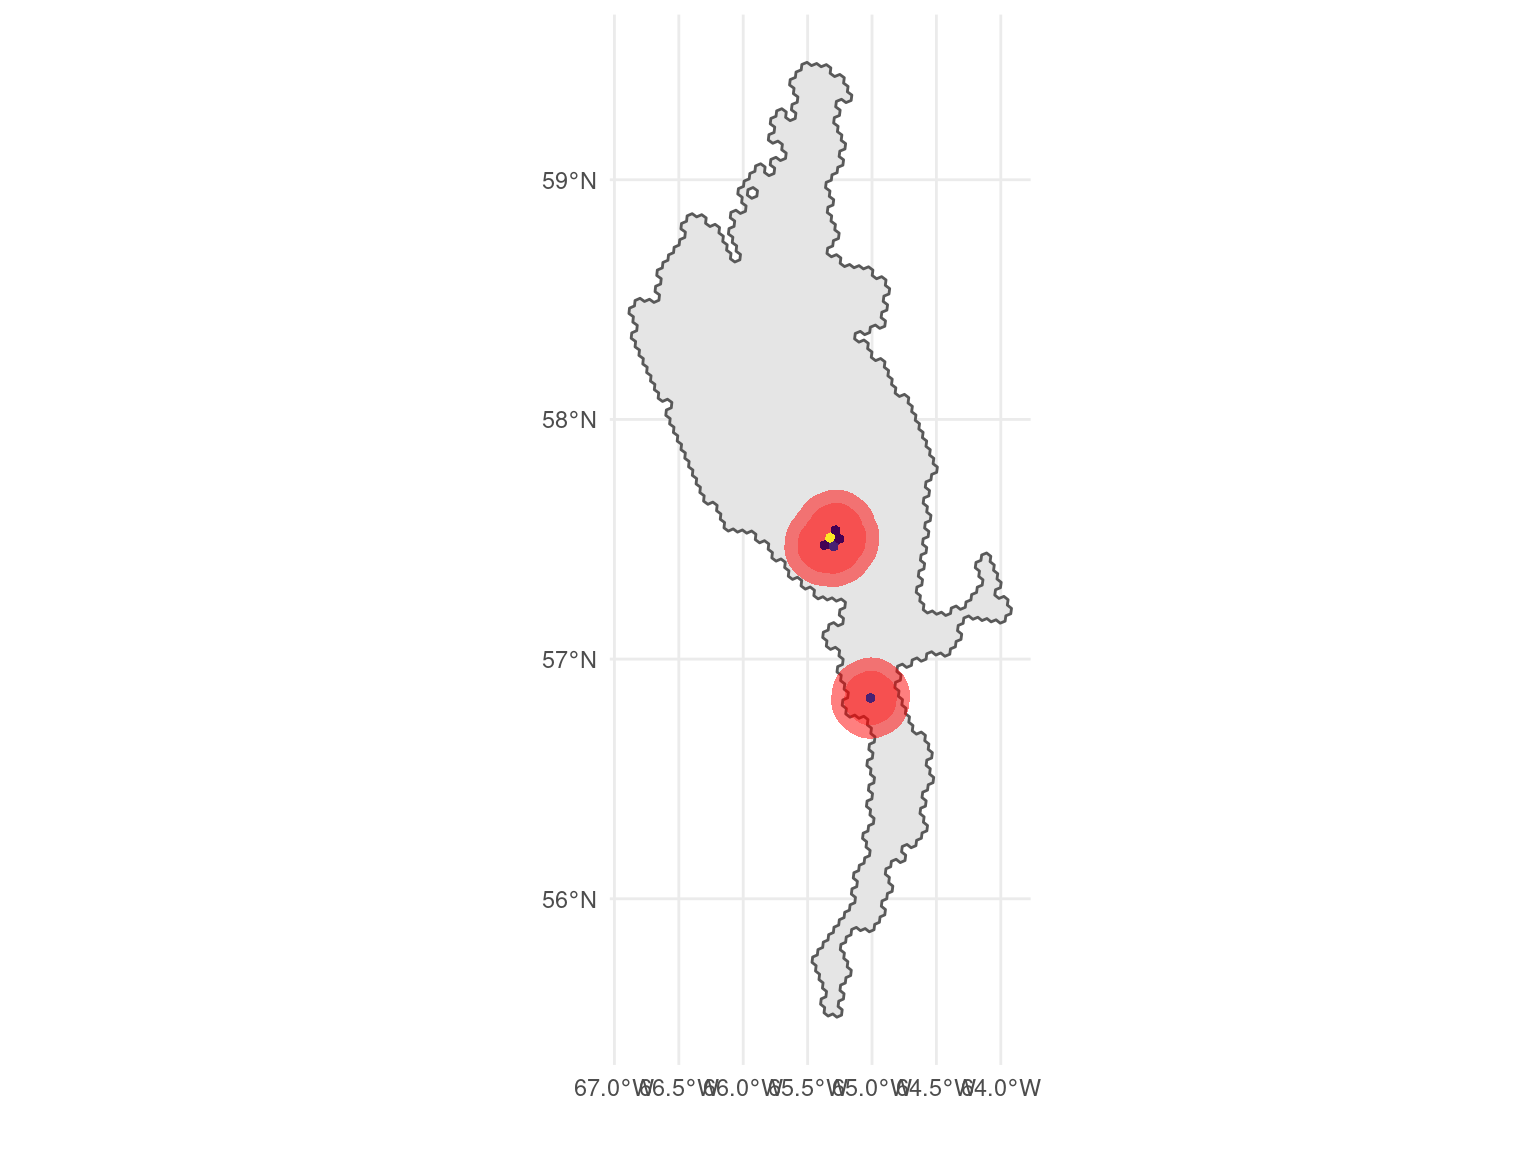
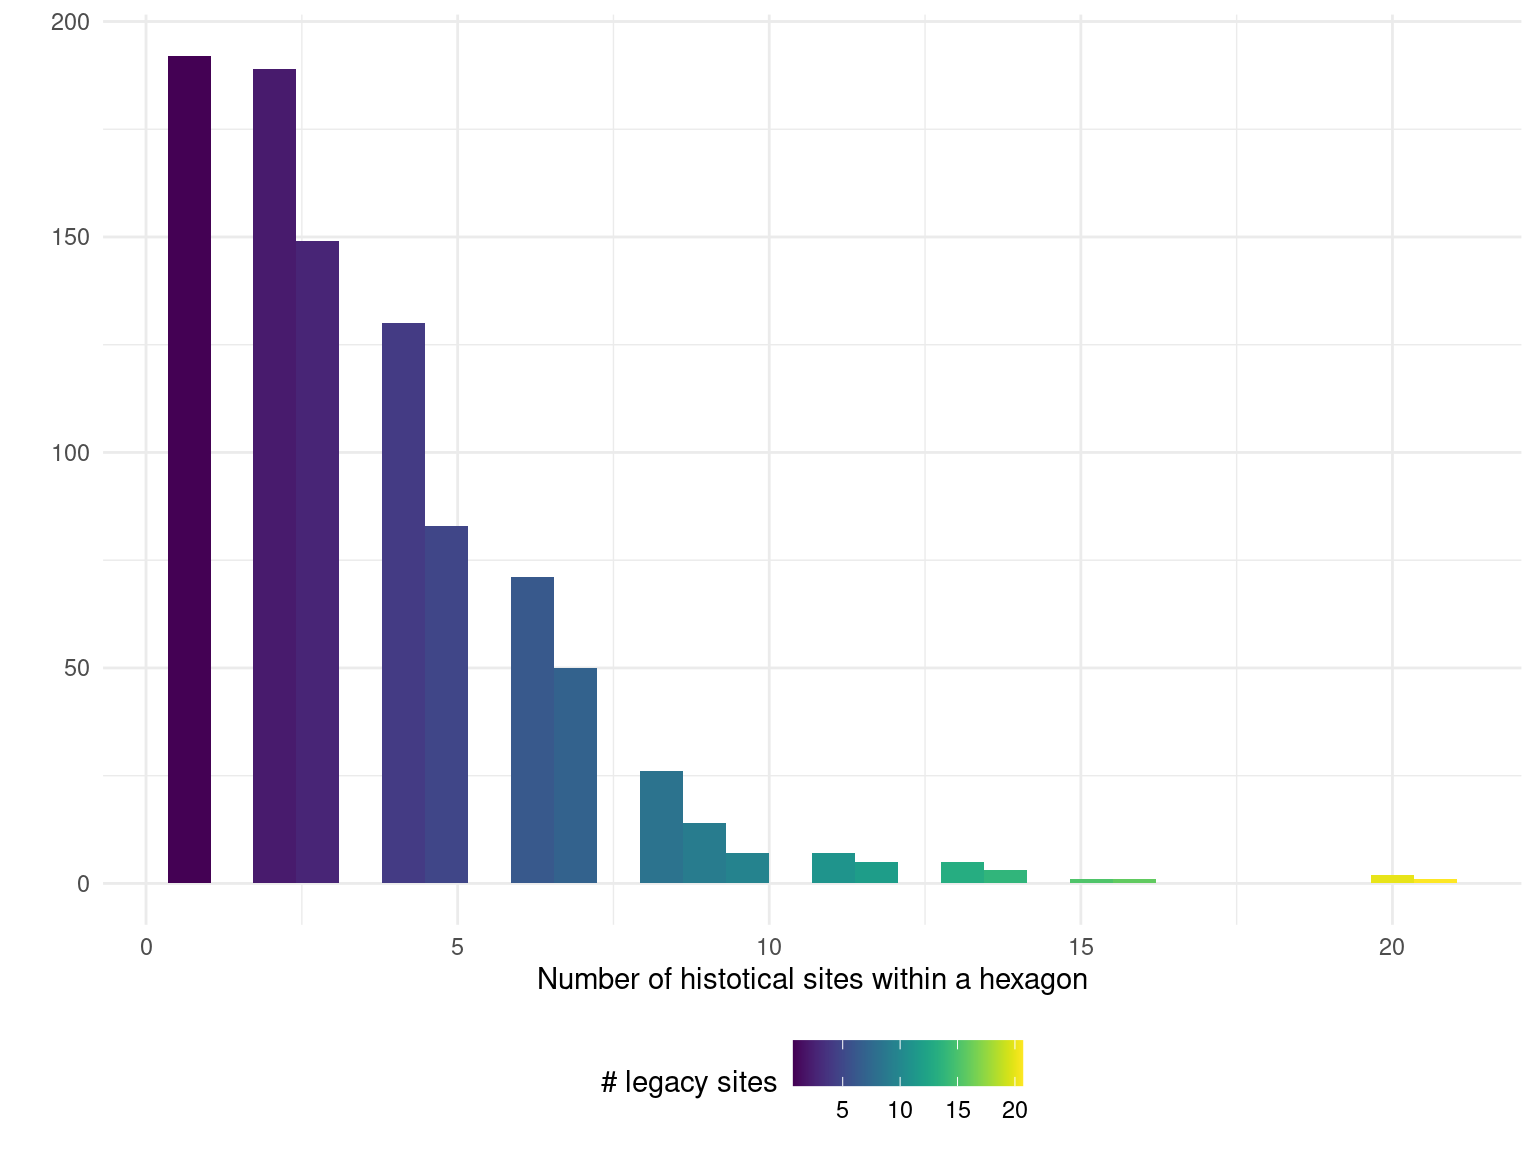
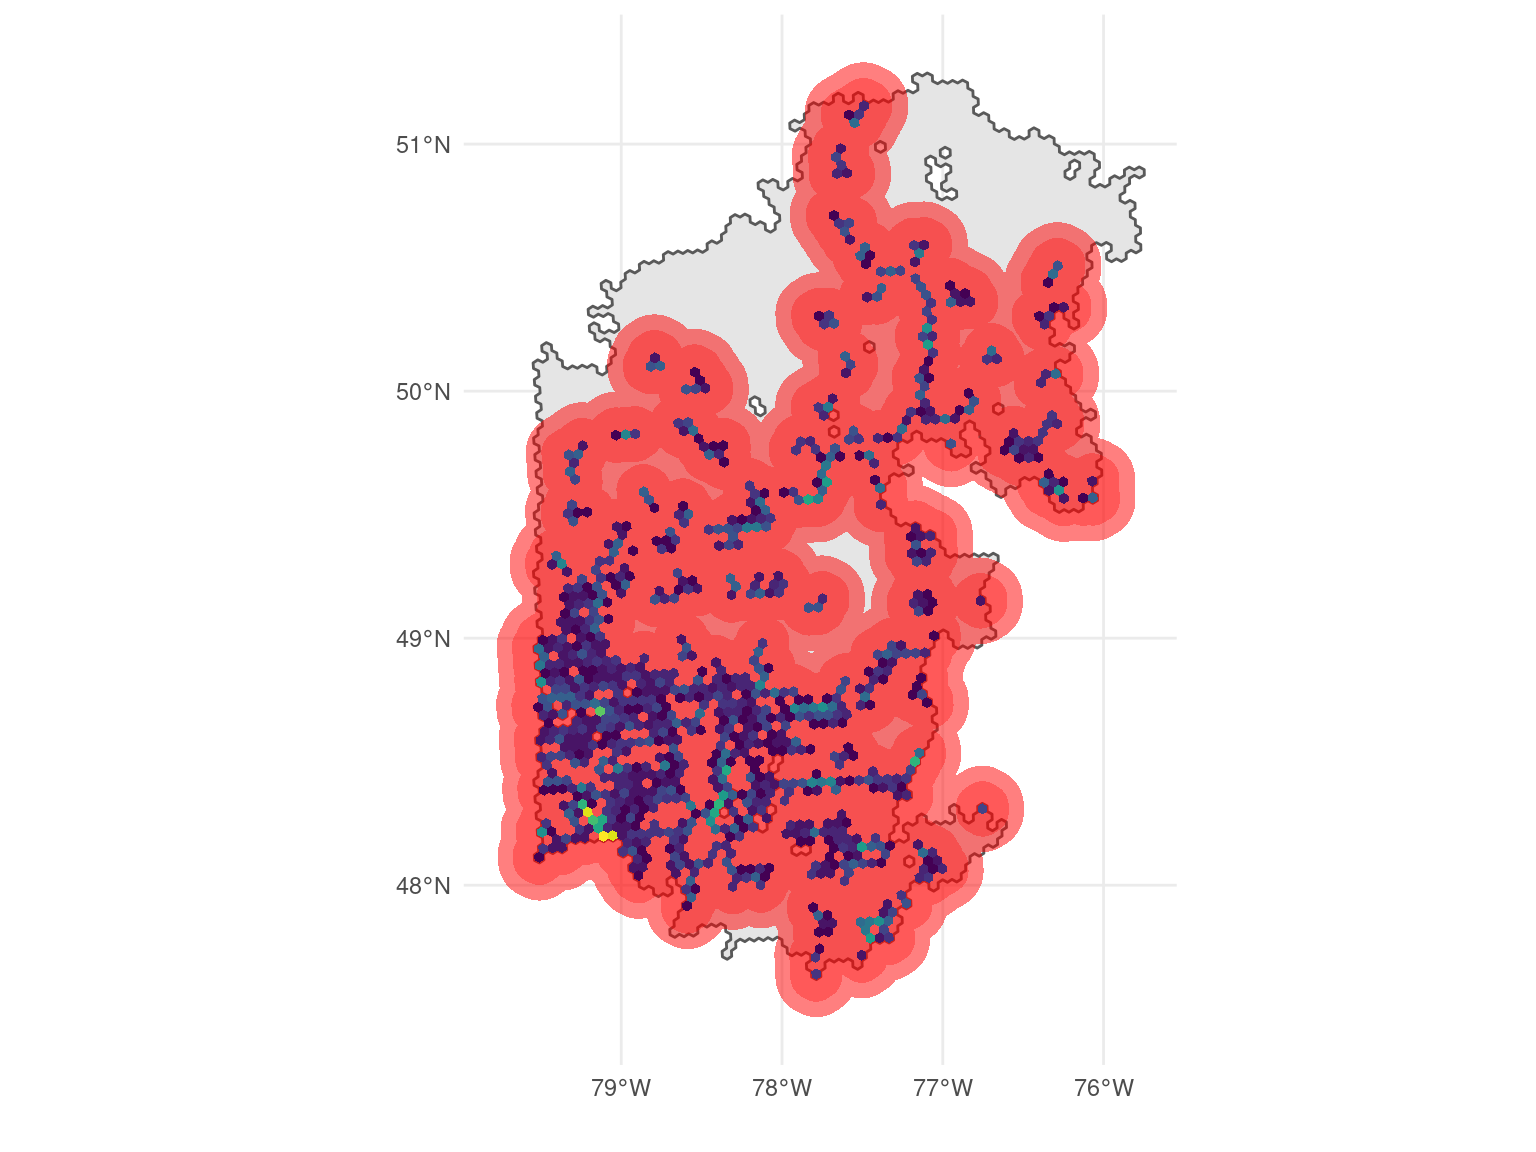
Historical sites are survey points present in the study area, and a hexagon can contain multiple historical sites. The first figure illustrates the distribution of the number of historical sites within a hexagon throughout the ecoregion. The second image displays the spatial distribution of historical sites in the ecoregion, with each hexagon’s color indicating the number of legacy sites present. Around each historical sites, two buffers describe the effect of the historical hexagons on (i) the inclusion probability of neighboring hexagons (dark red) and (ii) the sample size (light red). While the buffer for adjusting the inclusion probability of neighboring hexagons is fixed at 10 kilometers, the buffer for adjusting the sample size varies depending on the ecoregion. For further information, please refer to Chapter 5.
Ecoregion 100
 ## Ecoregion 101
 ## Ecoregion 102
 ## Ecoregion 103
 ## Ecoregion 117
 ## Ecoregion 217
 ## Ecoregion 47
 ## Ecoregion 72
 ## Ecoregion 74
 ## Ecoregion 75
 ## Ecoregion 76
 ## Ecoregion 96
 ## Ecoregion 99