9 Ecoregion summary: habitat
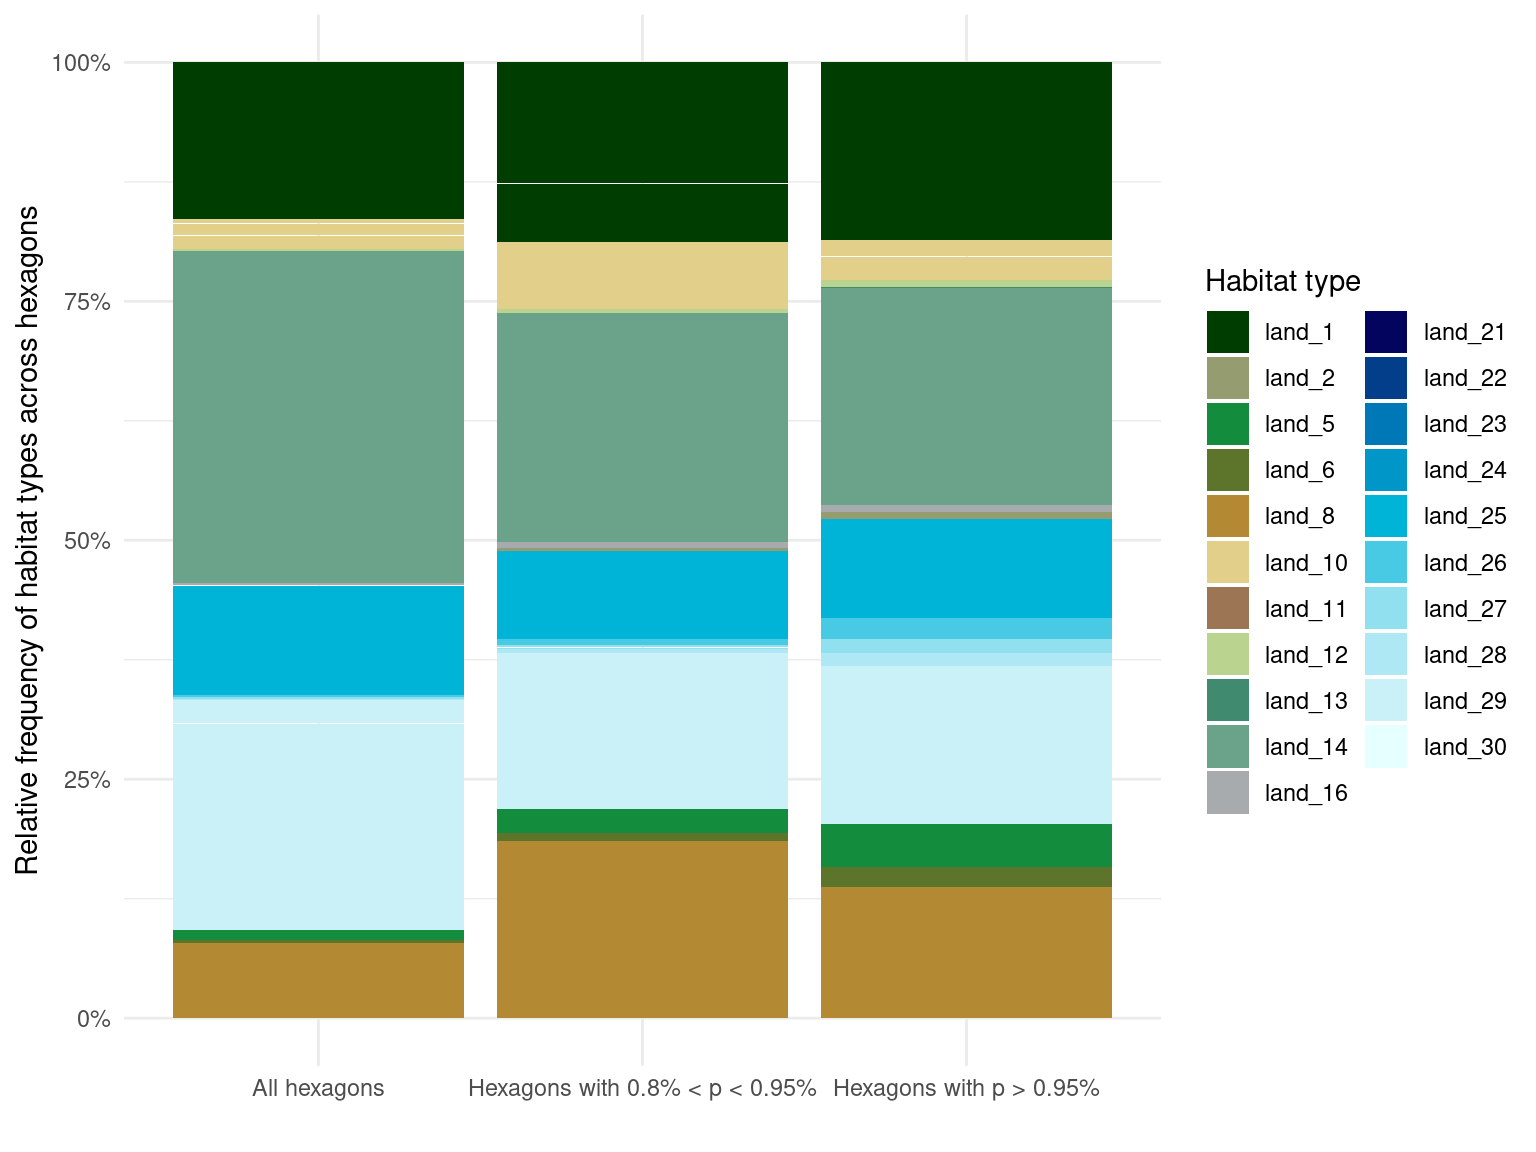
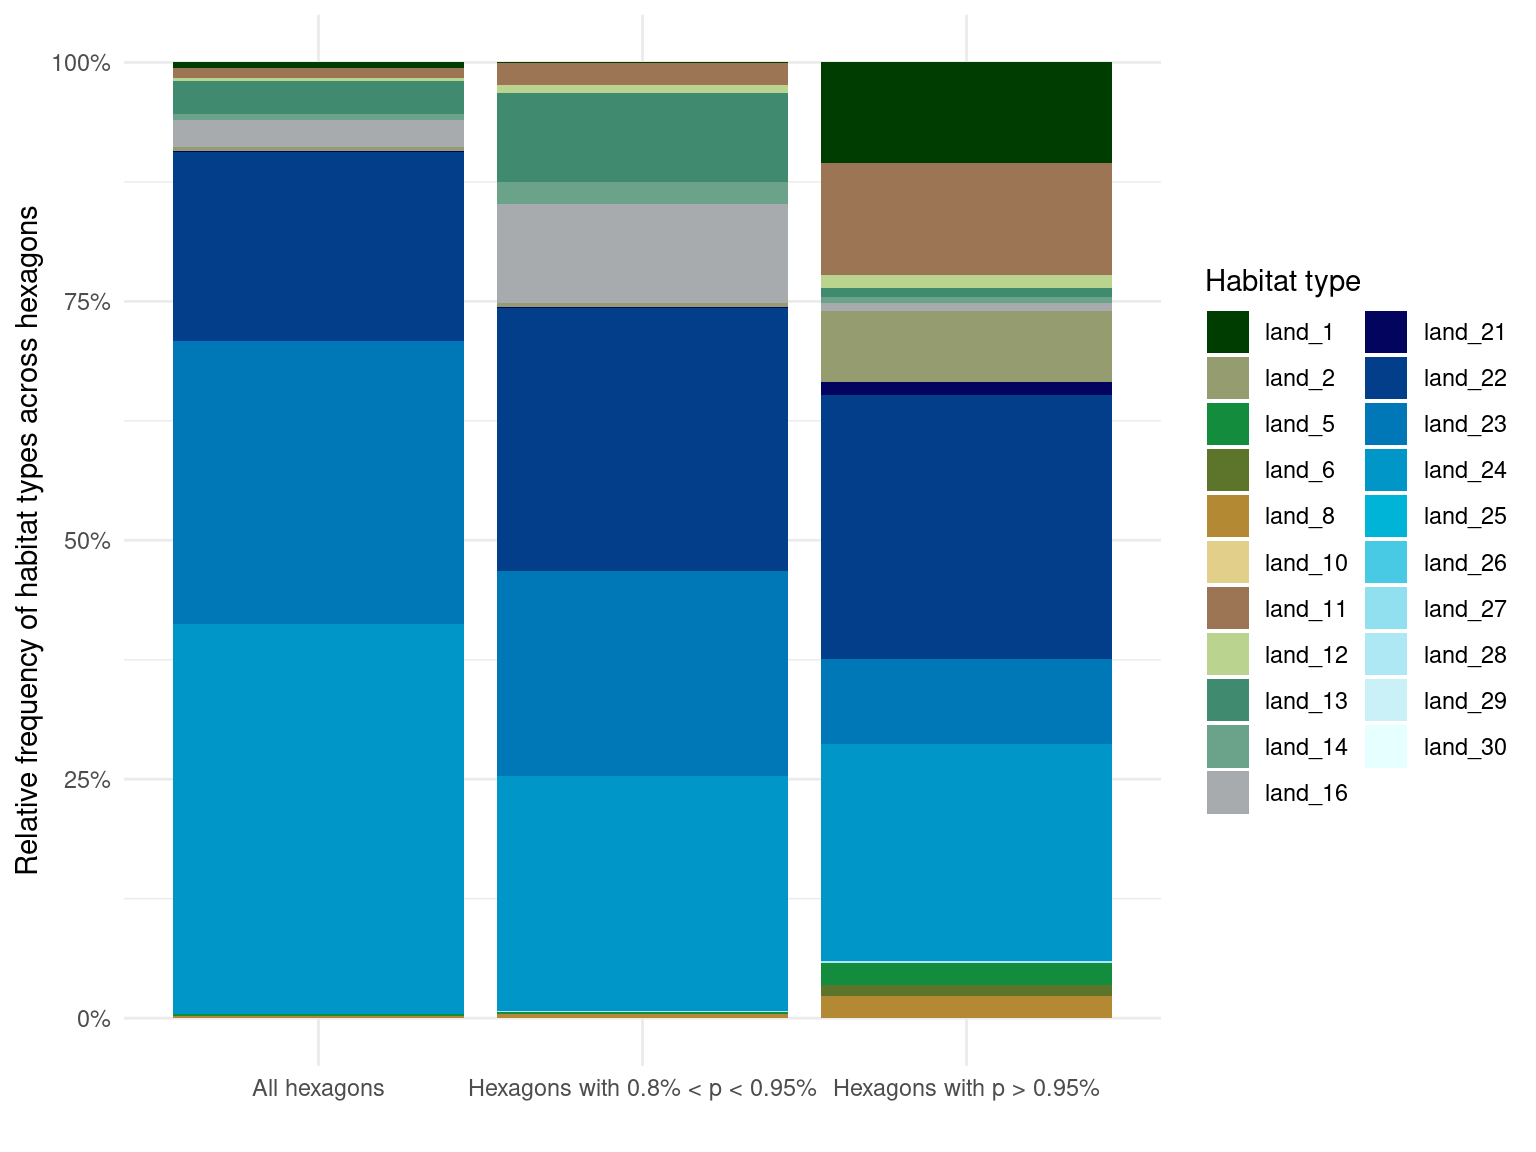
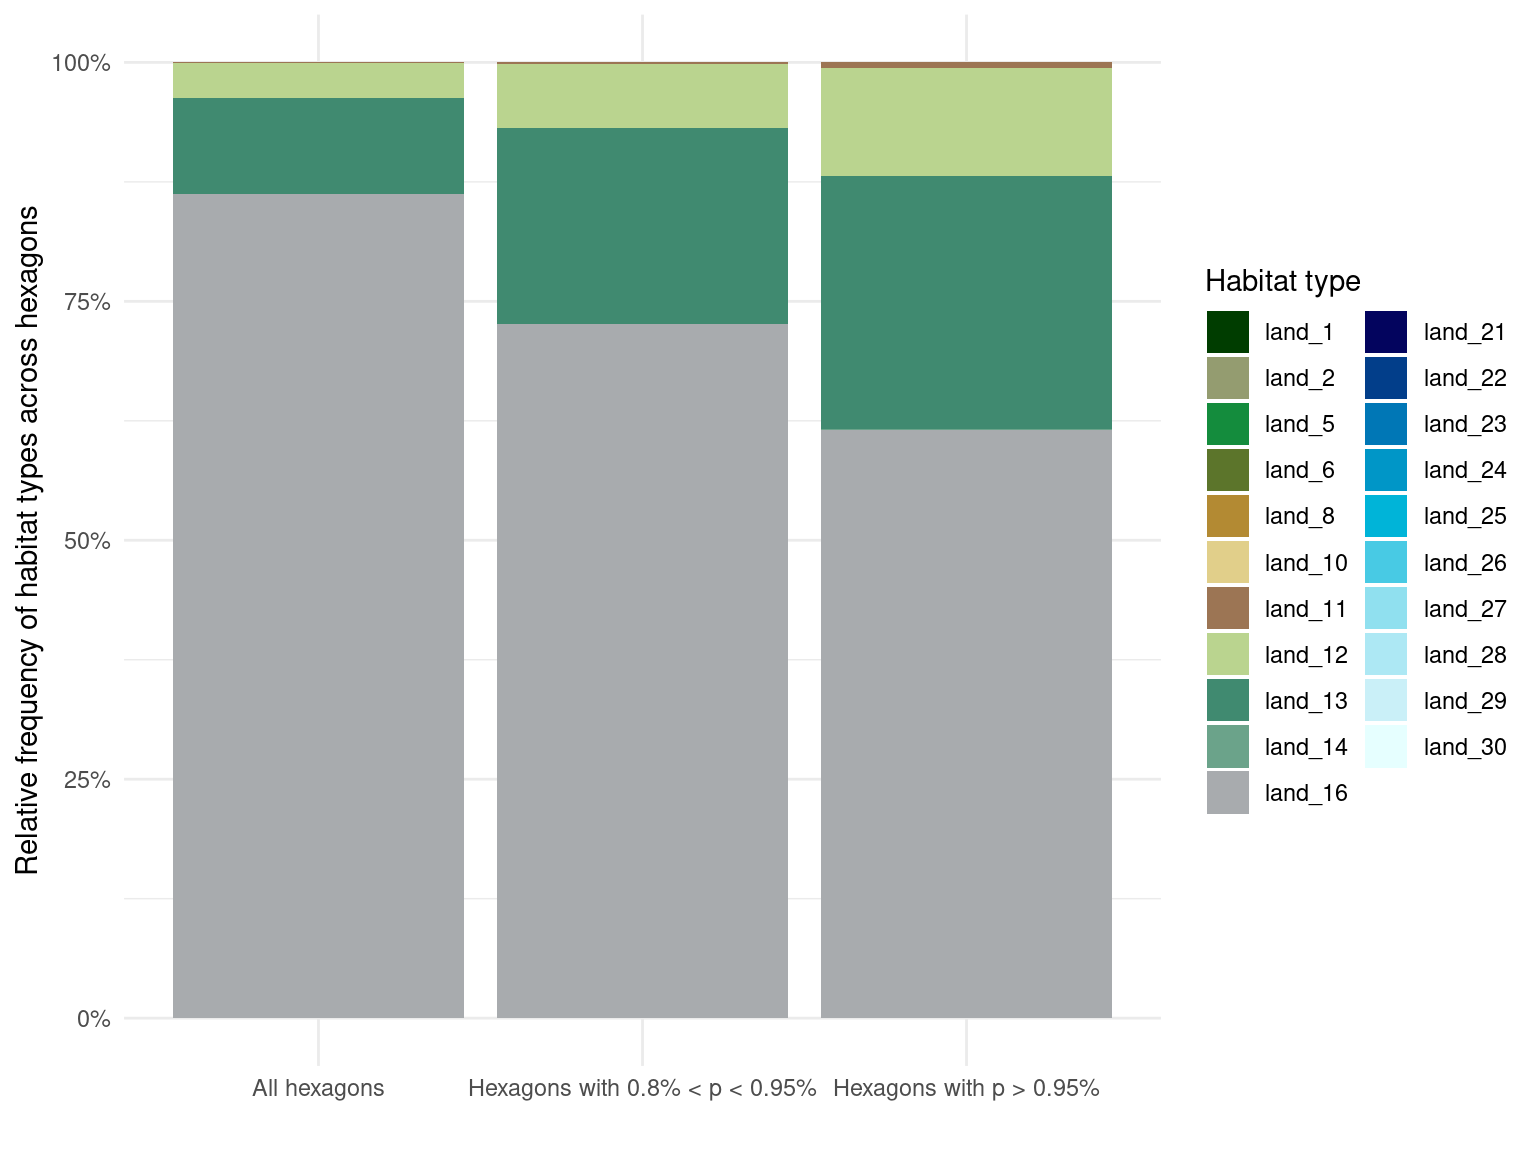
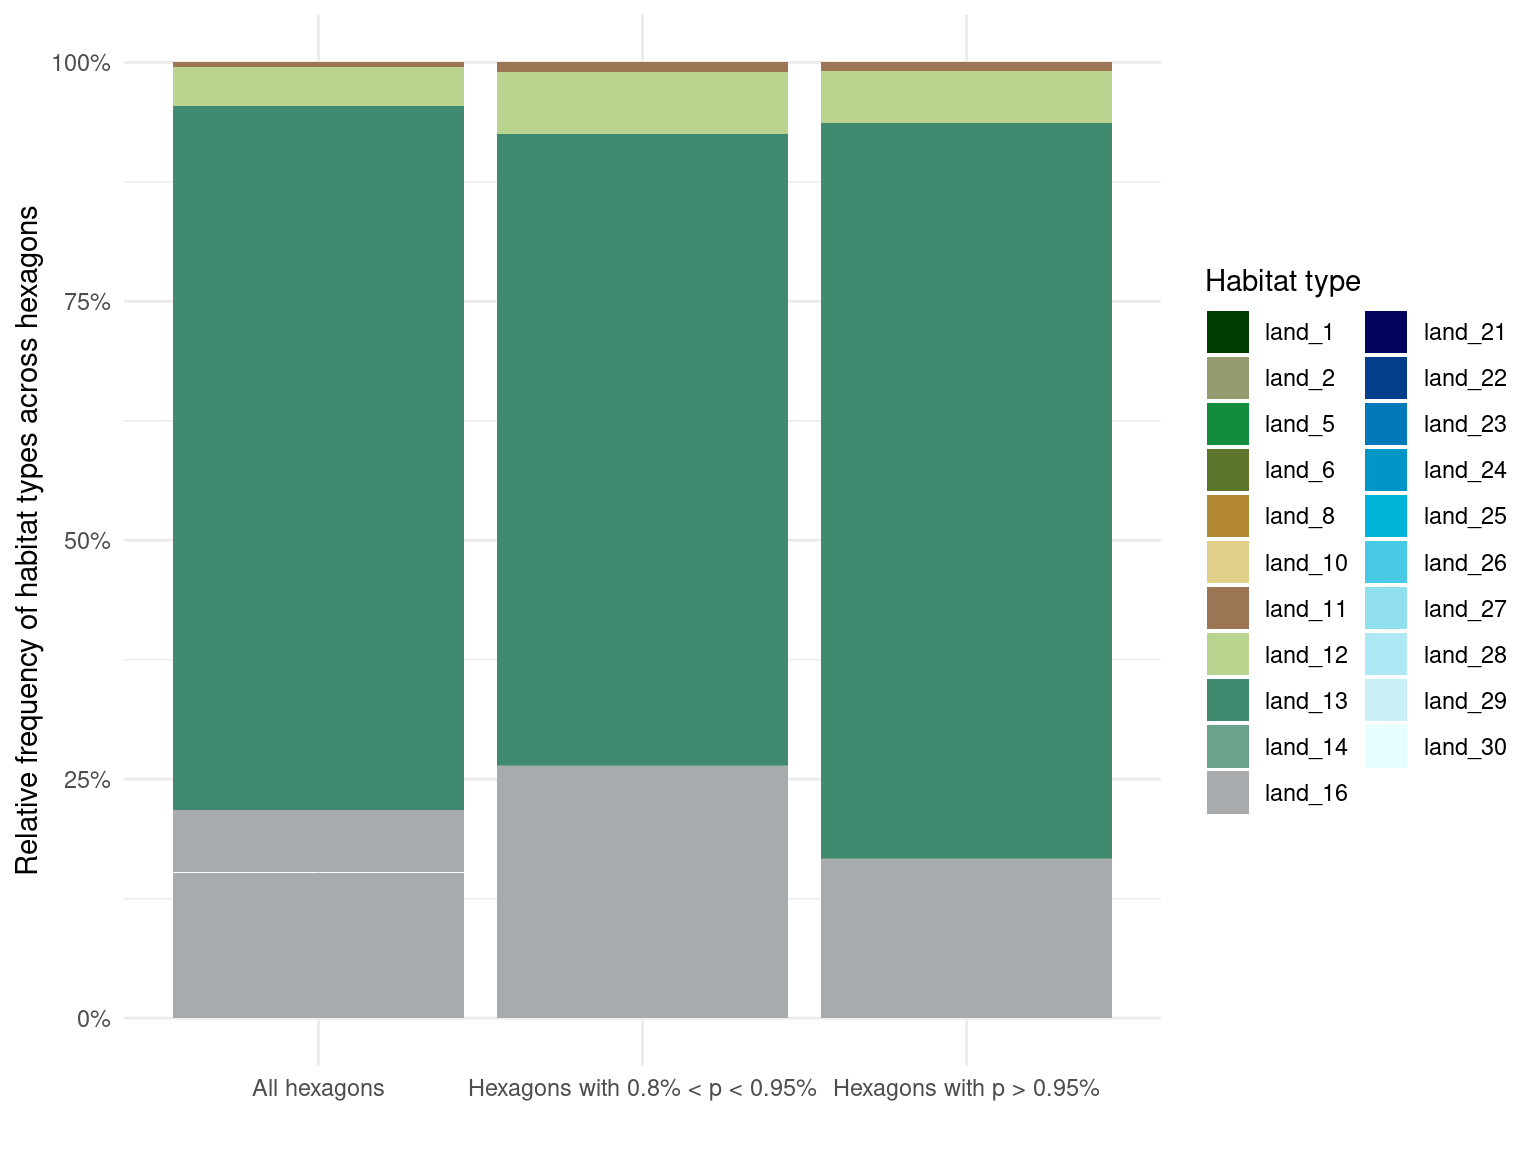
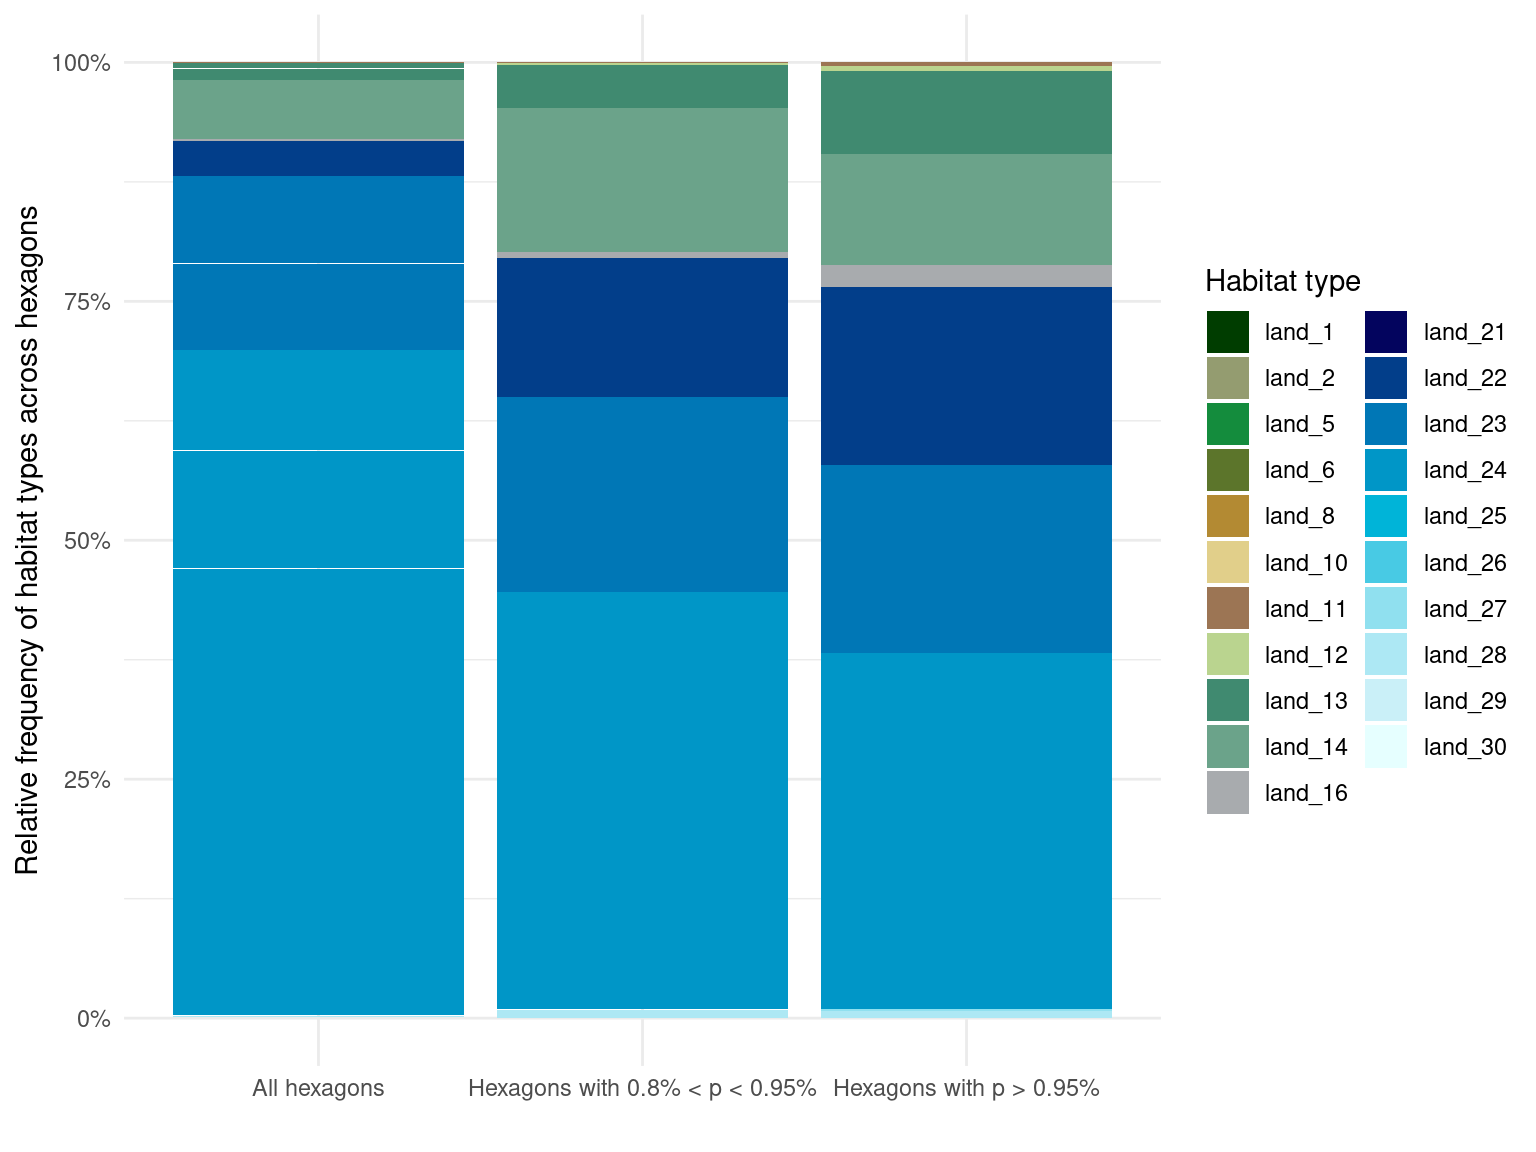
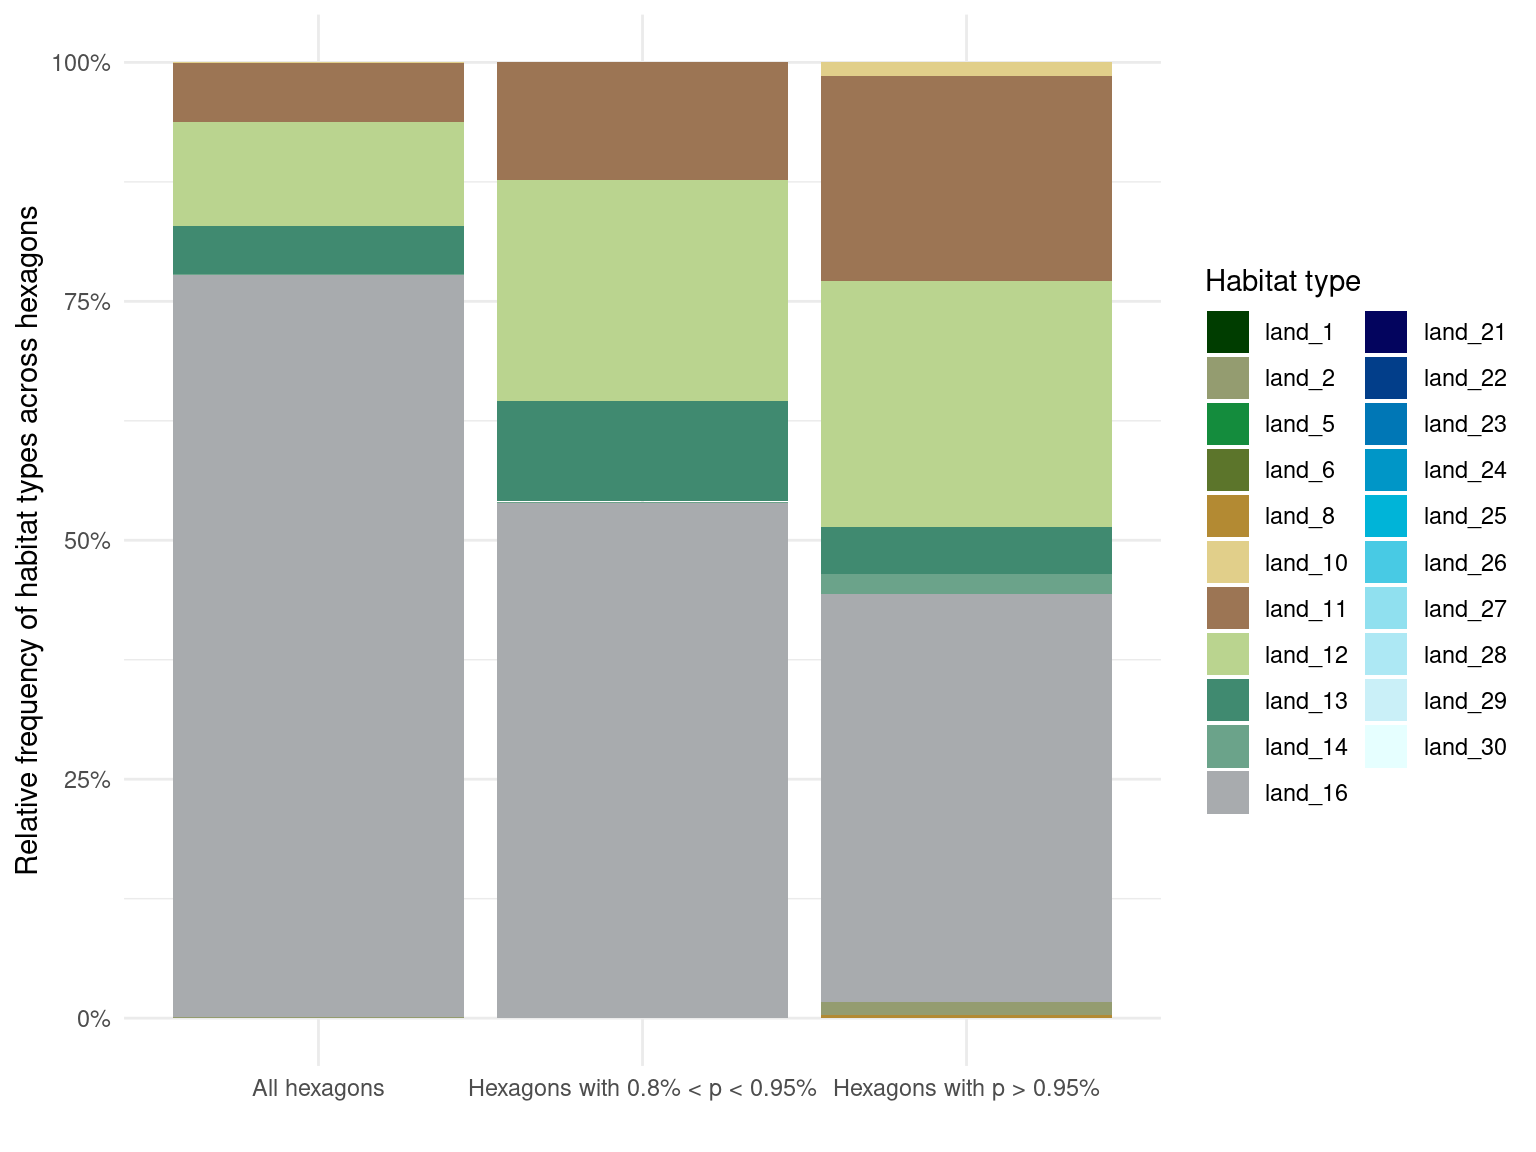
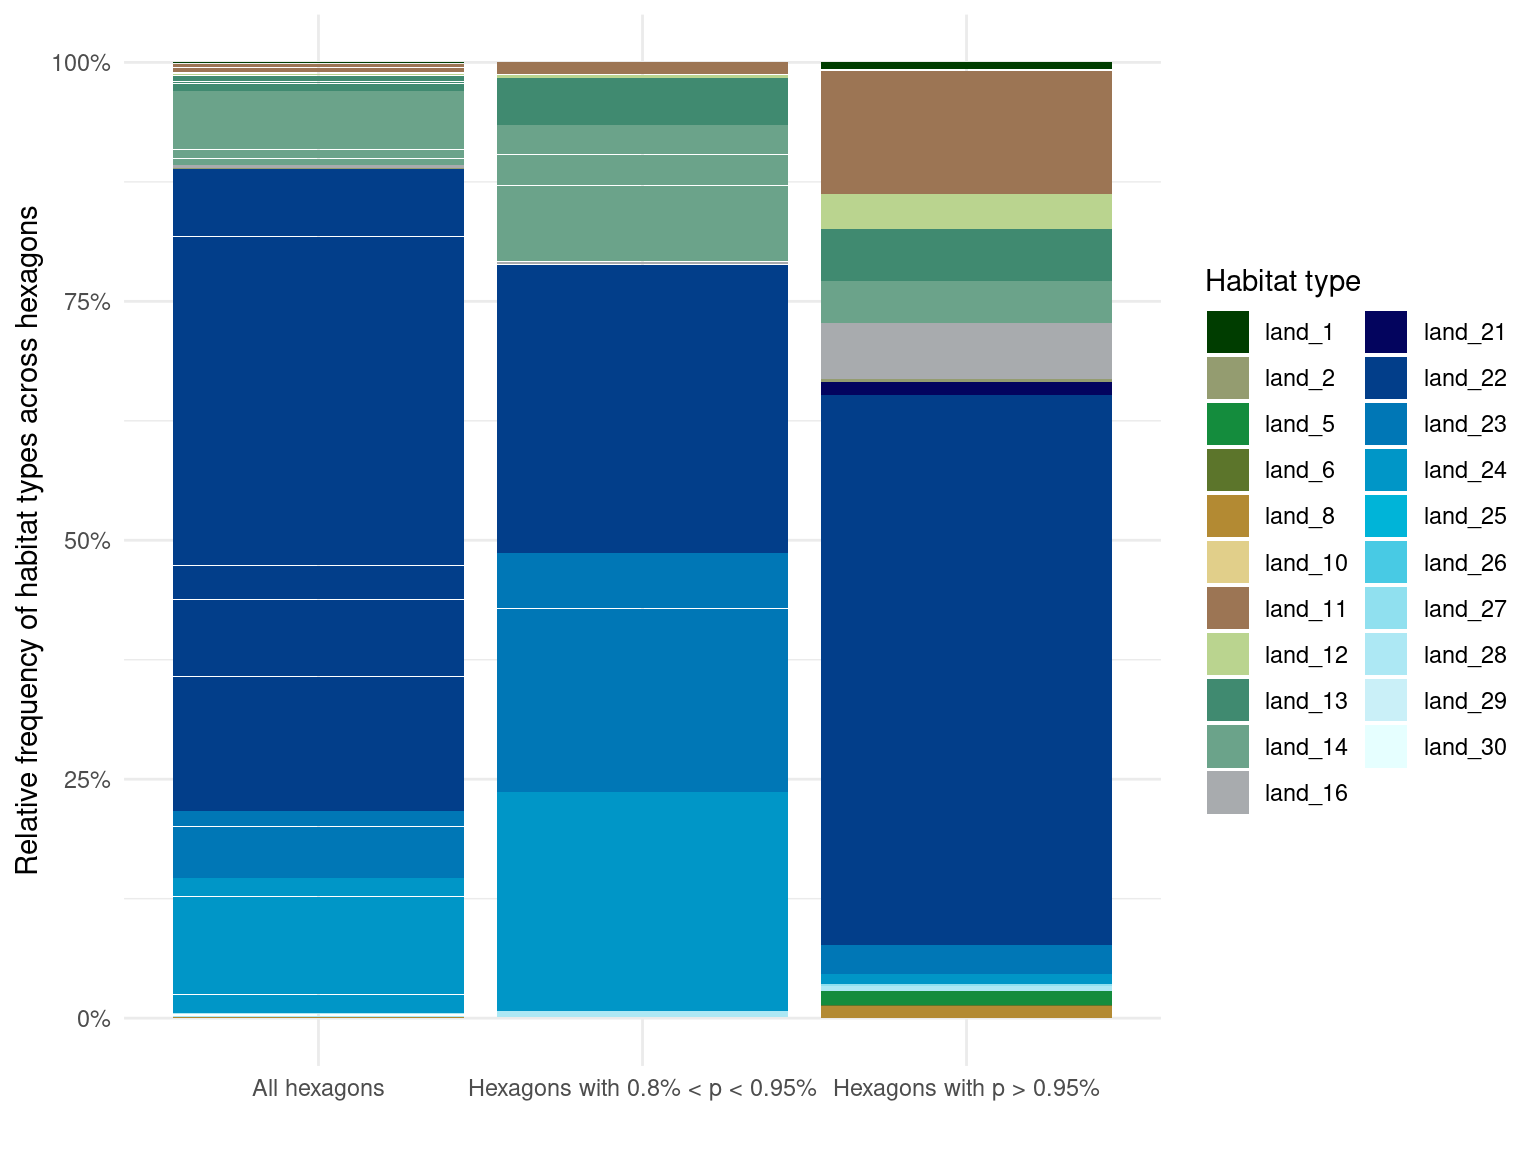
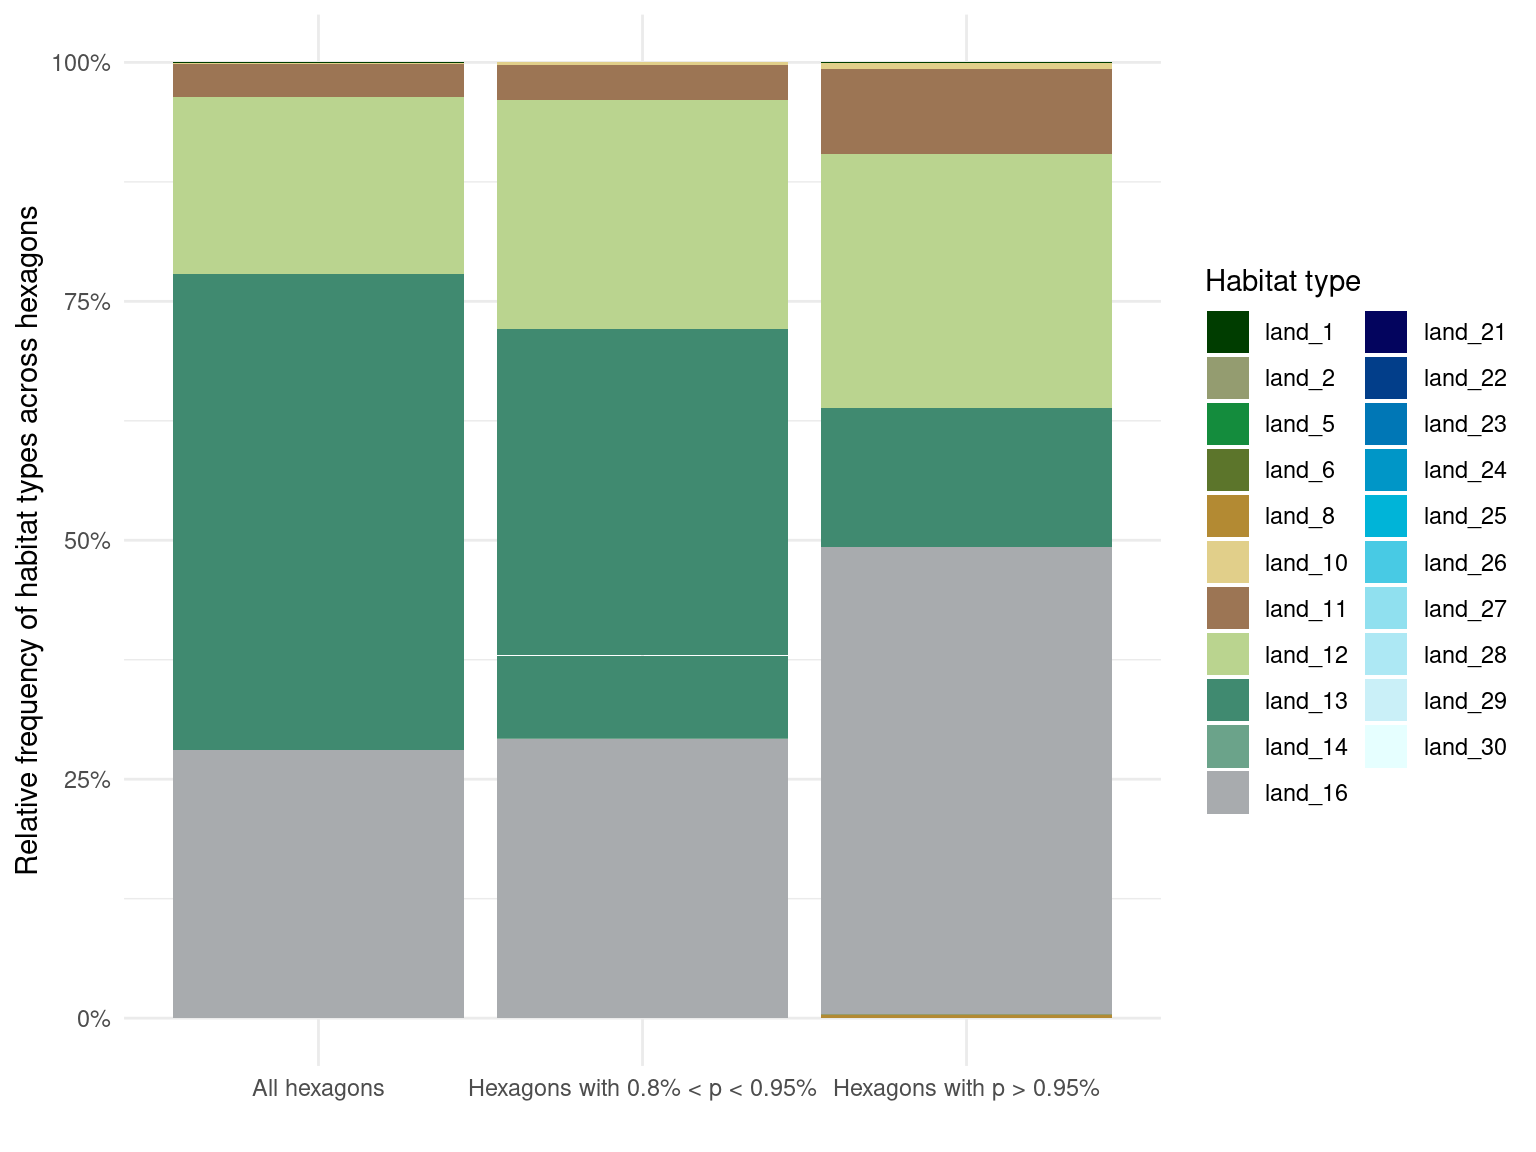
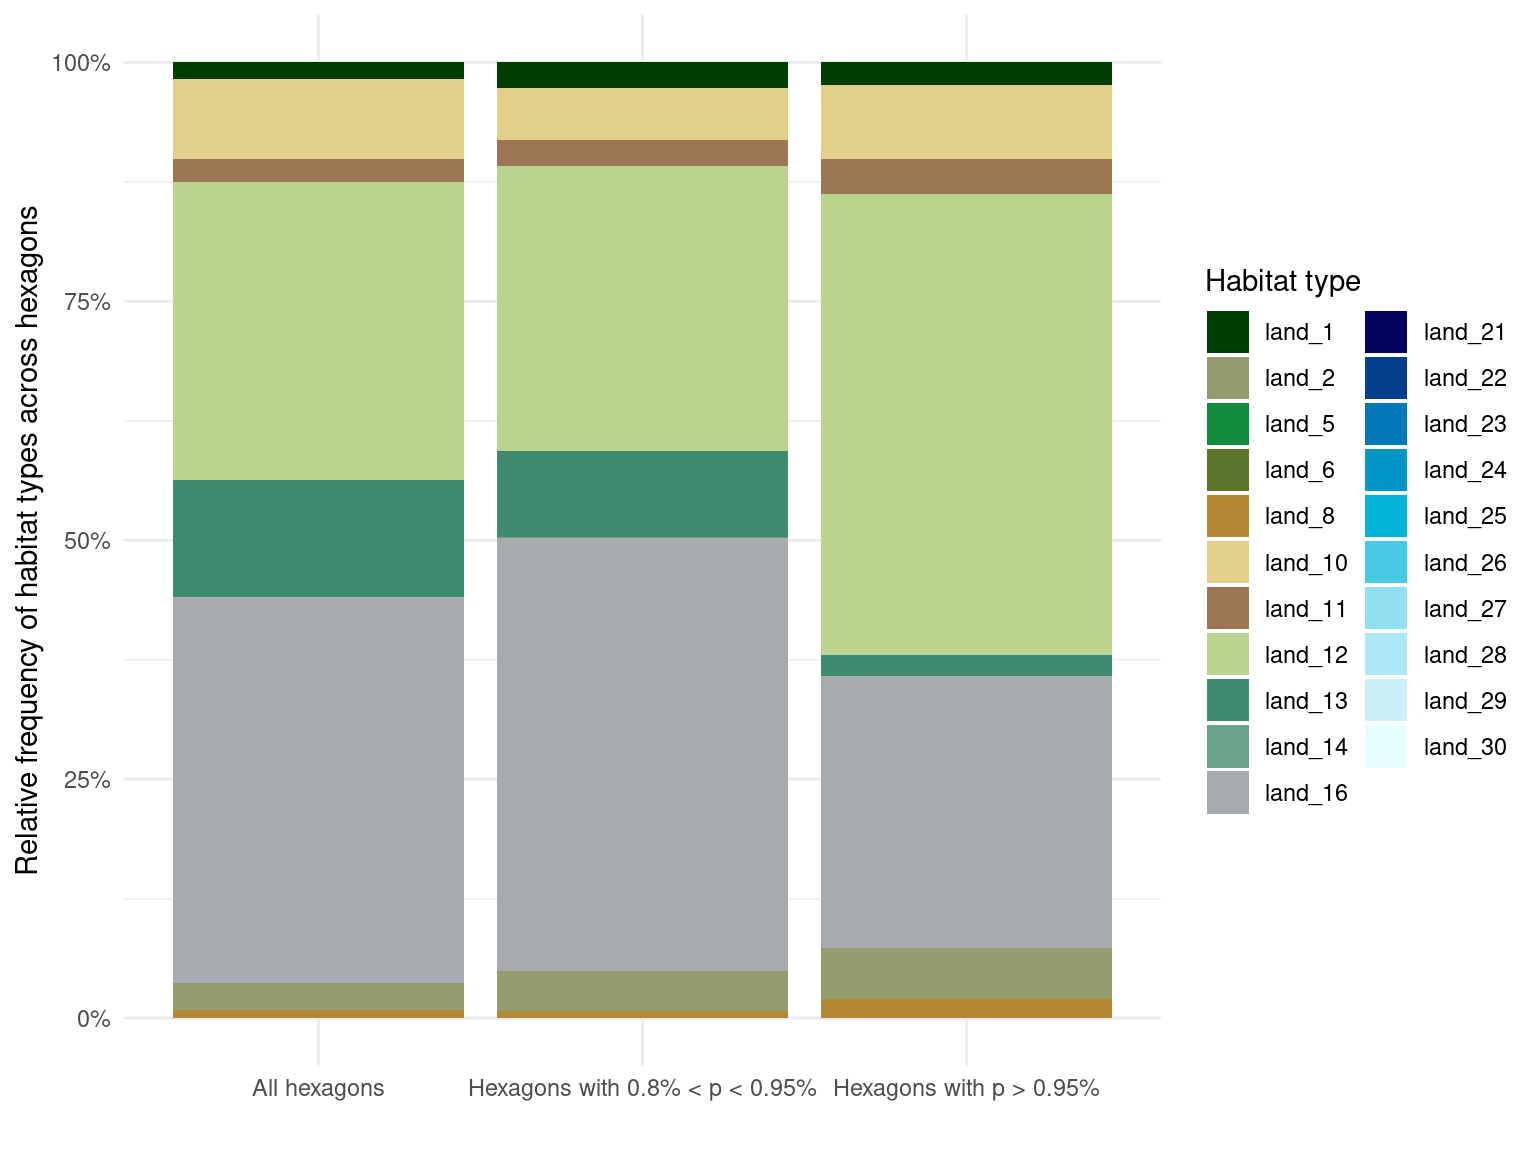
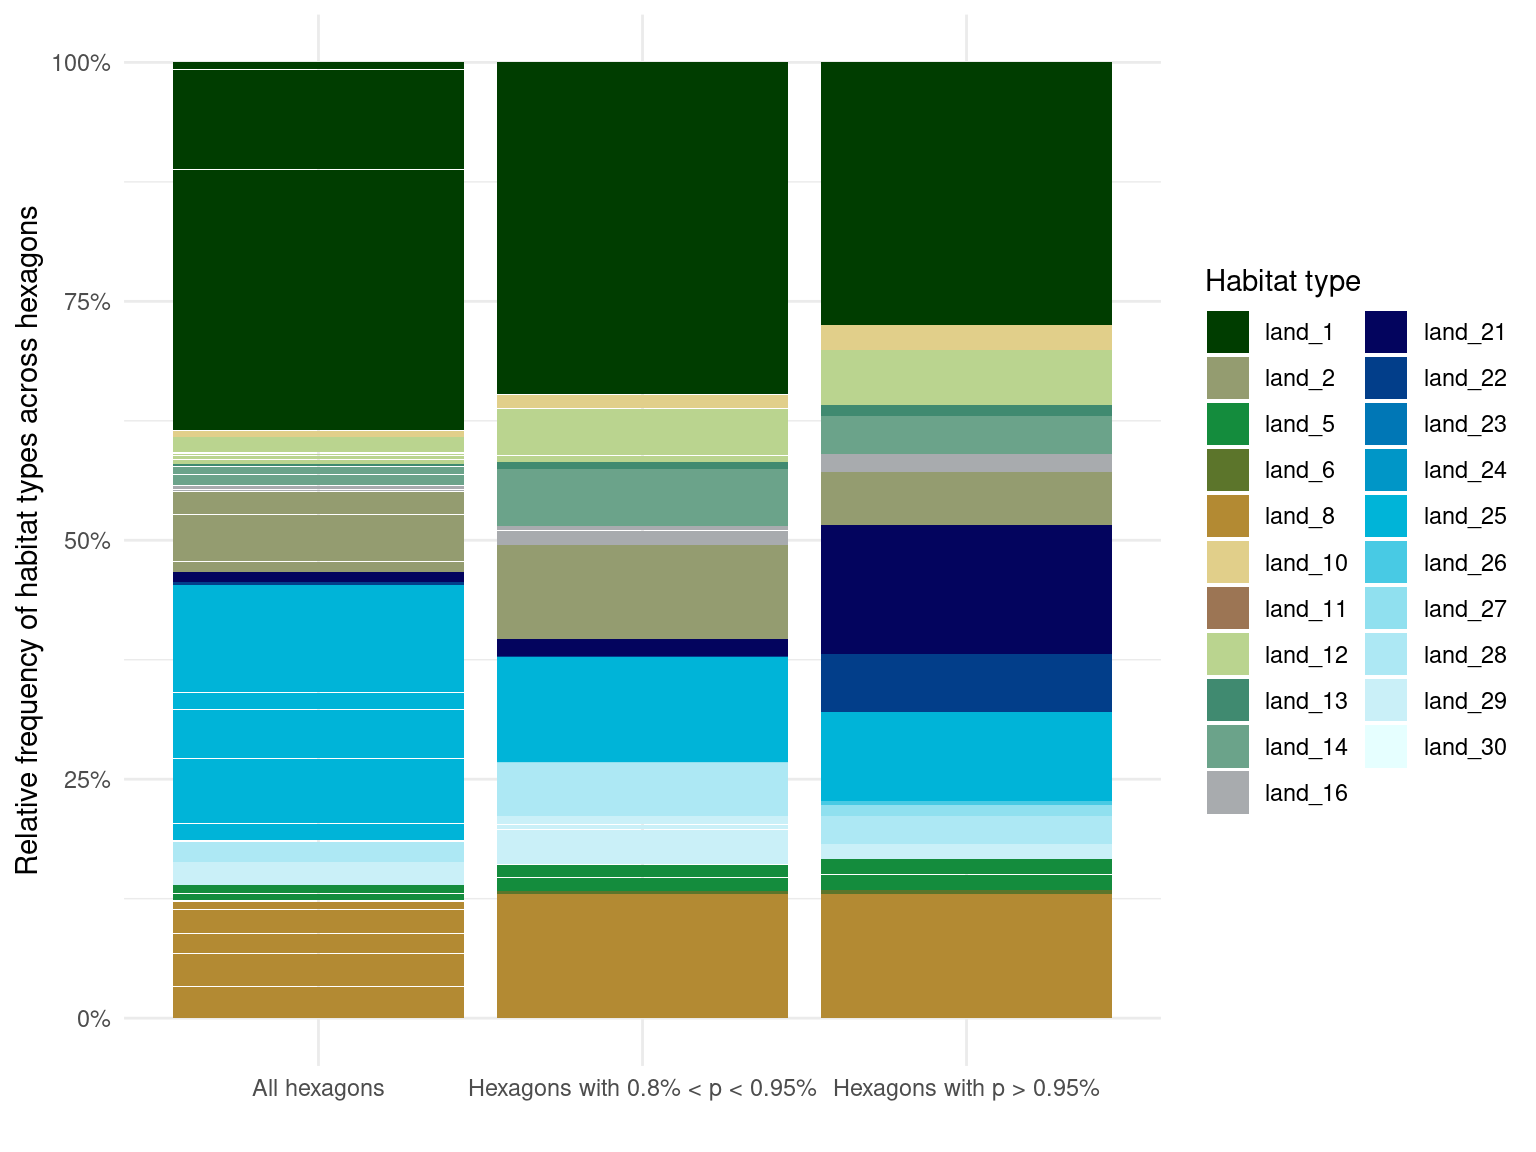
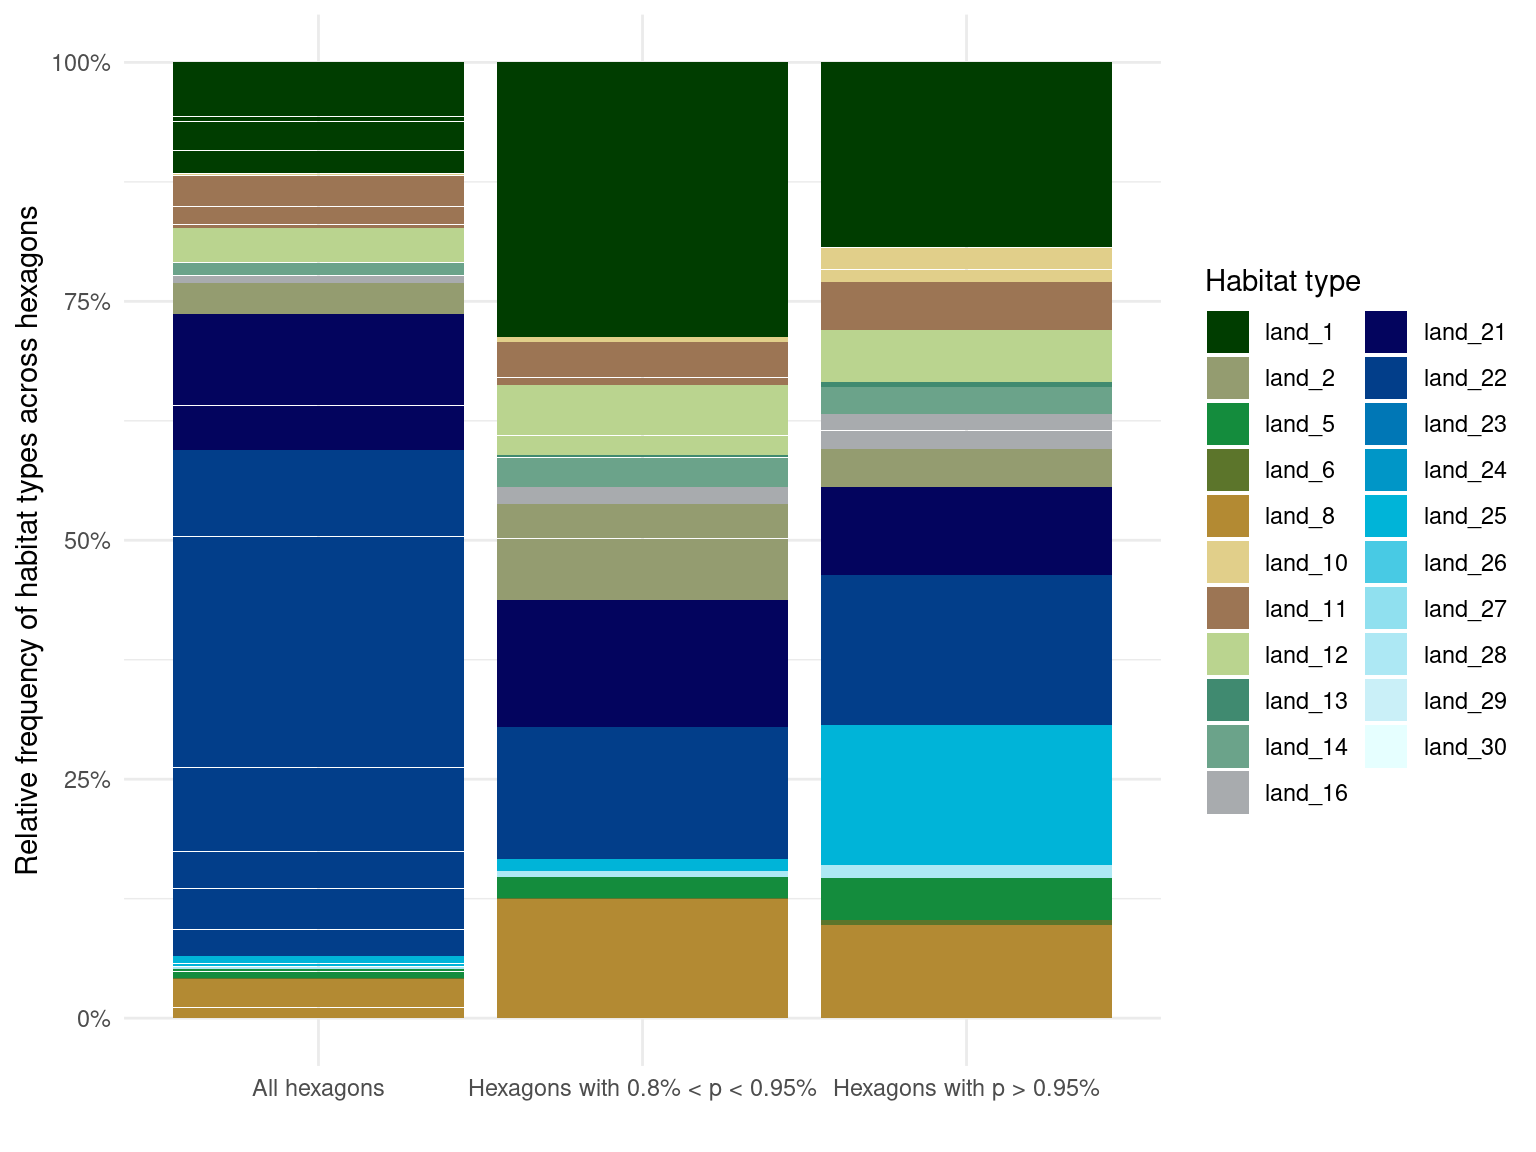
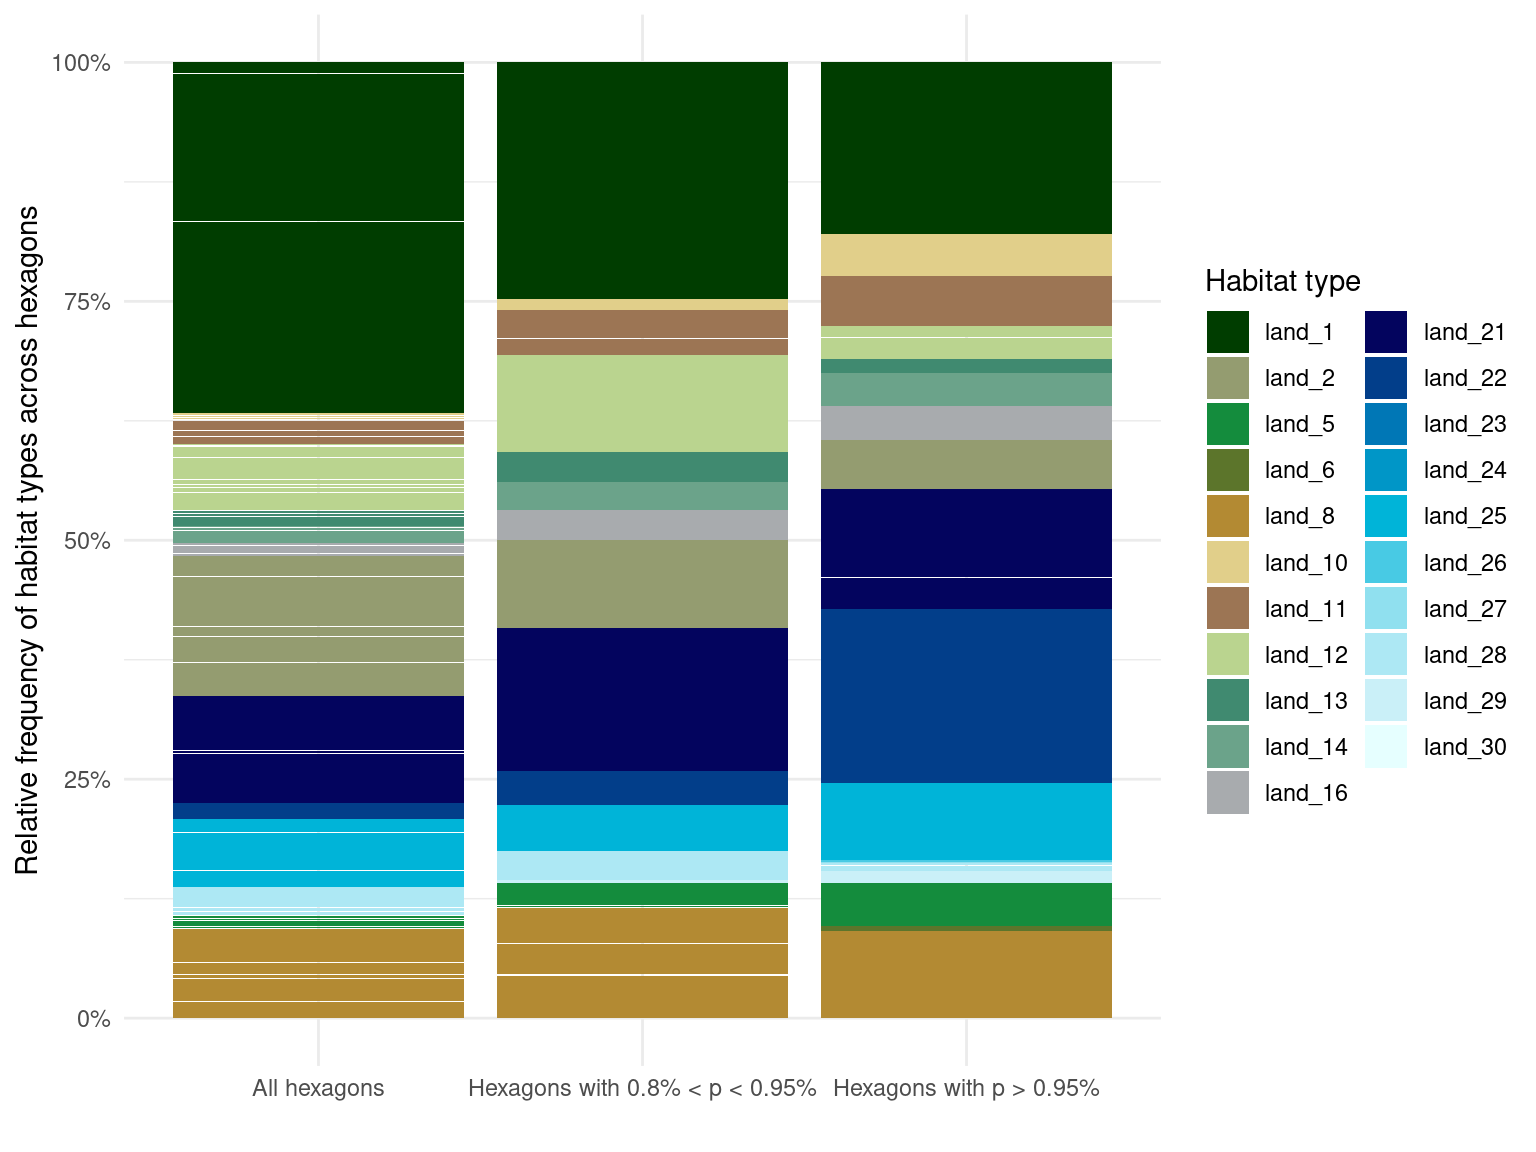
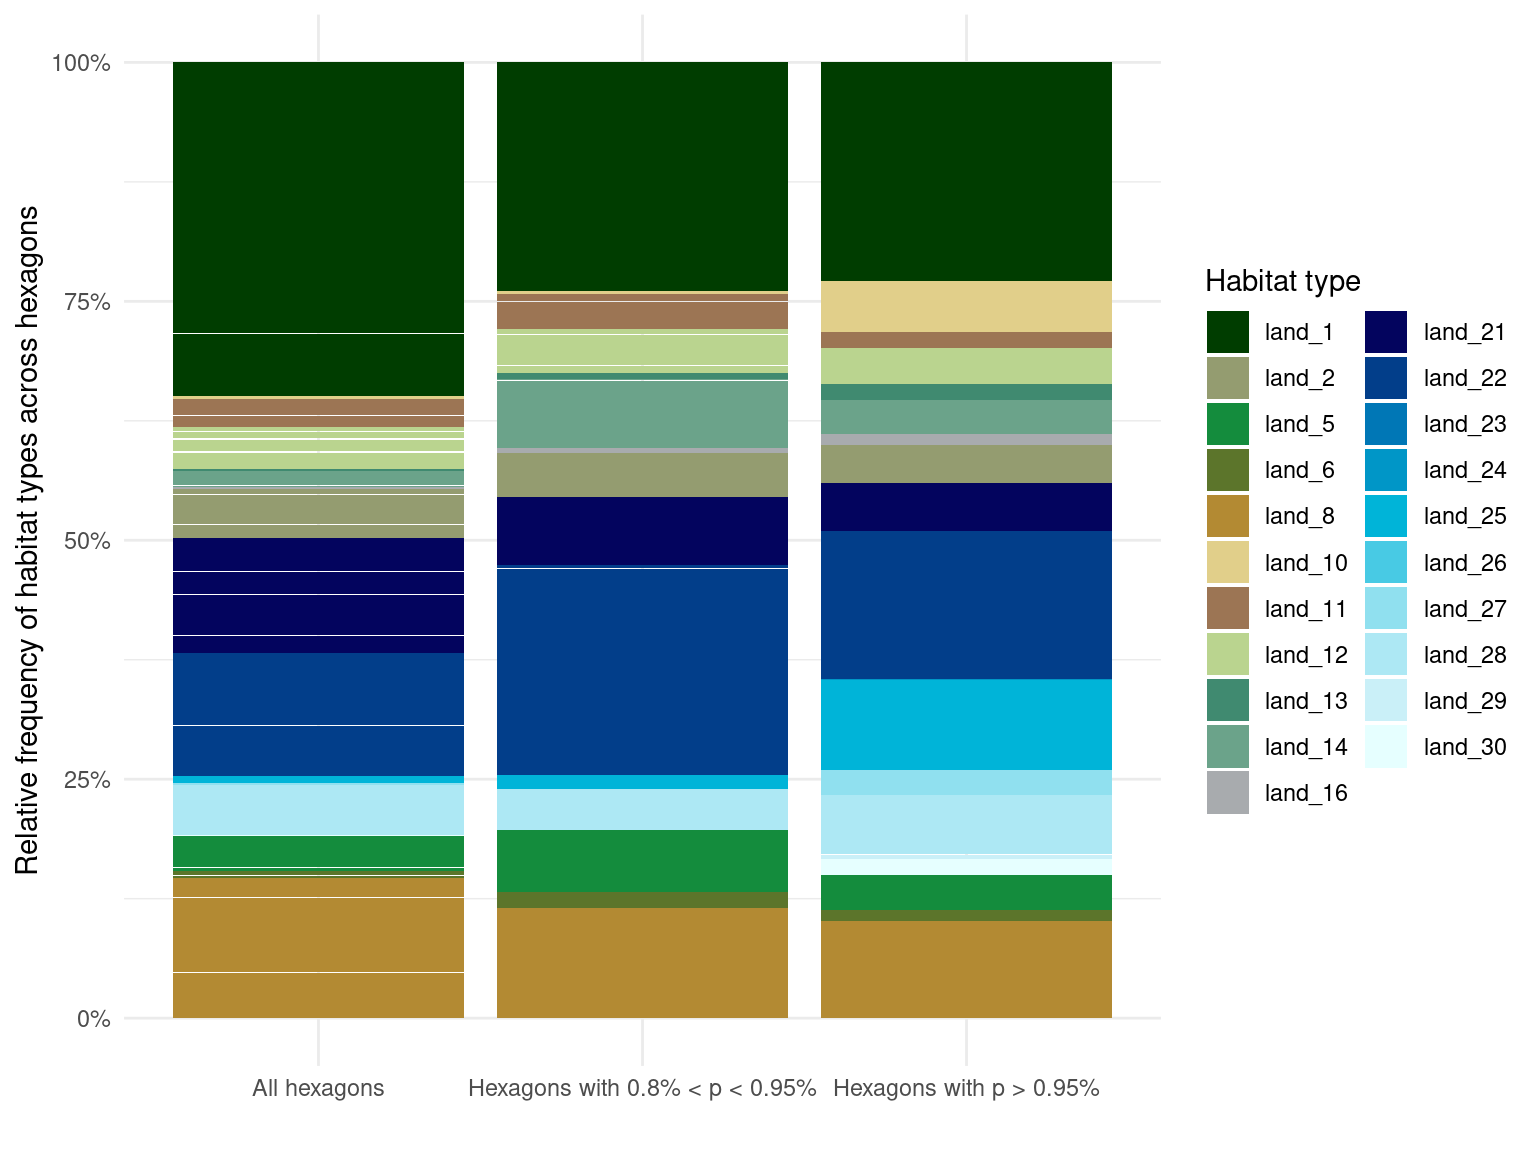
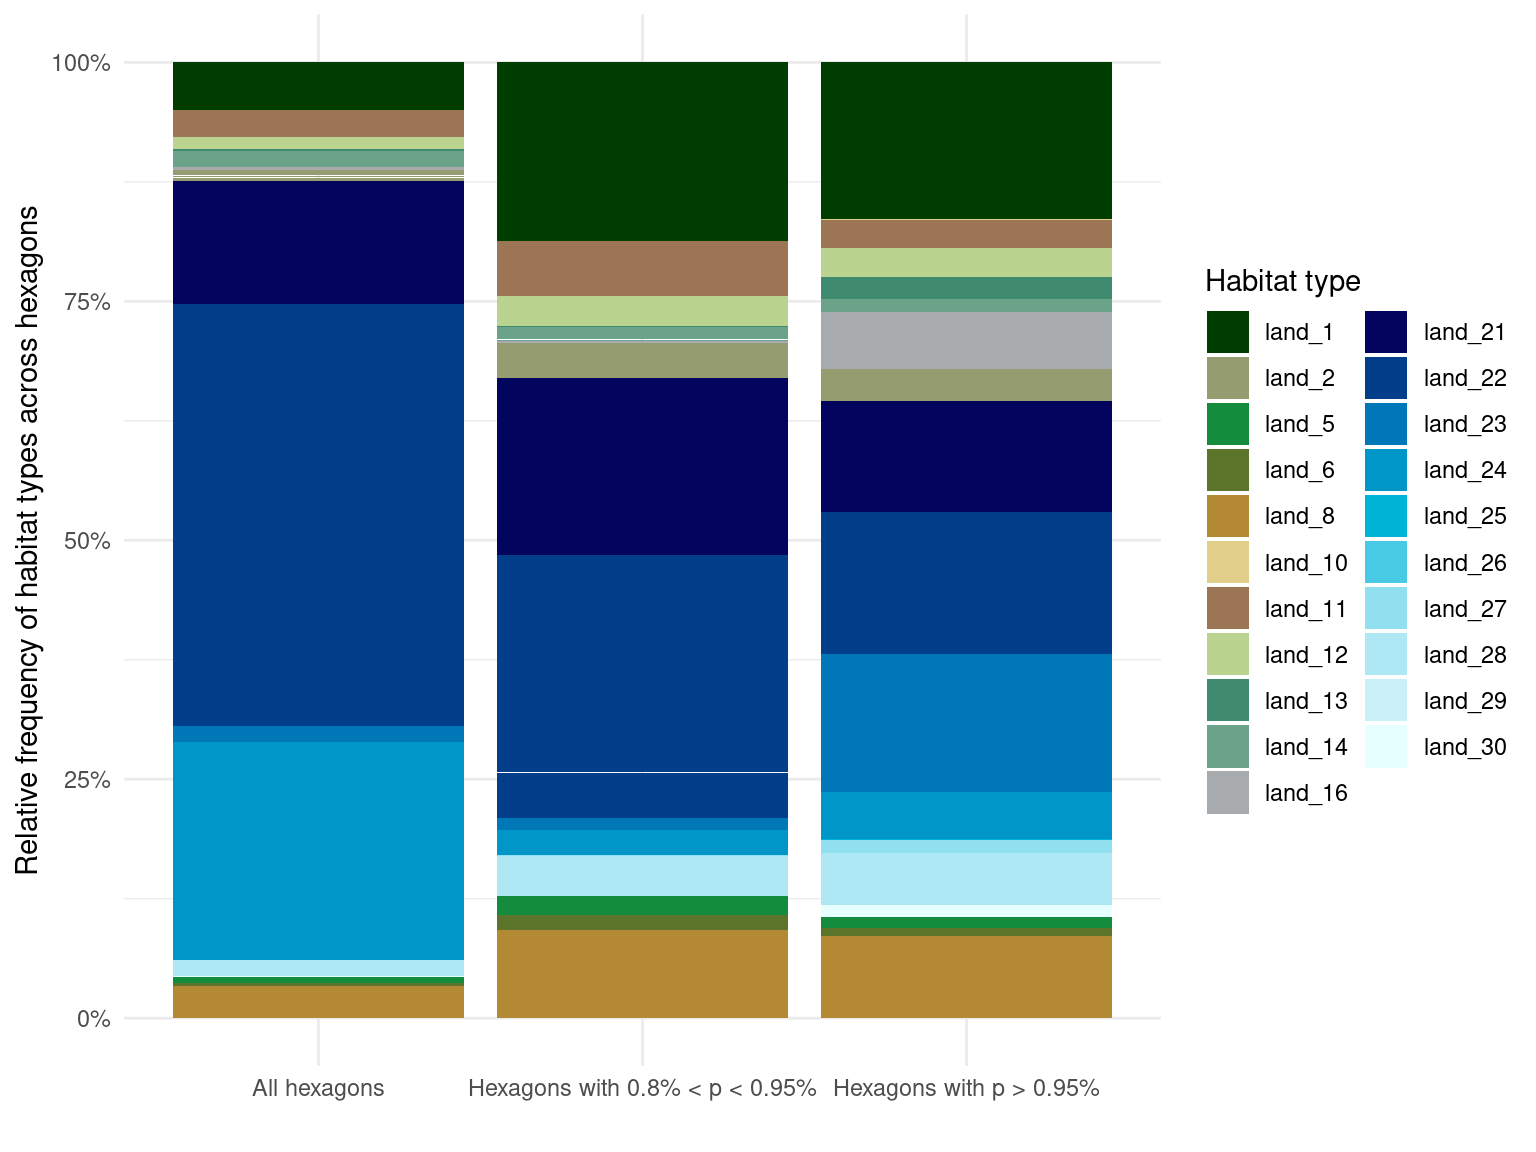
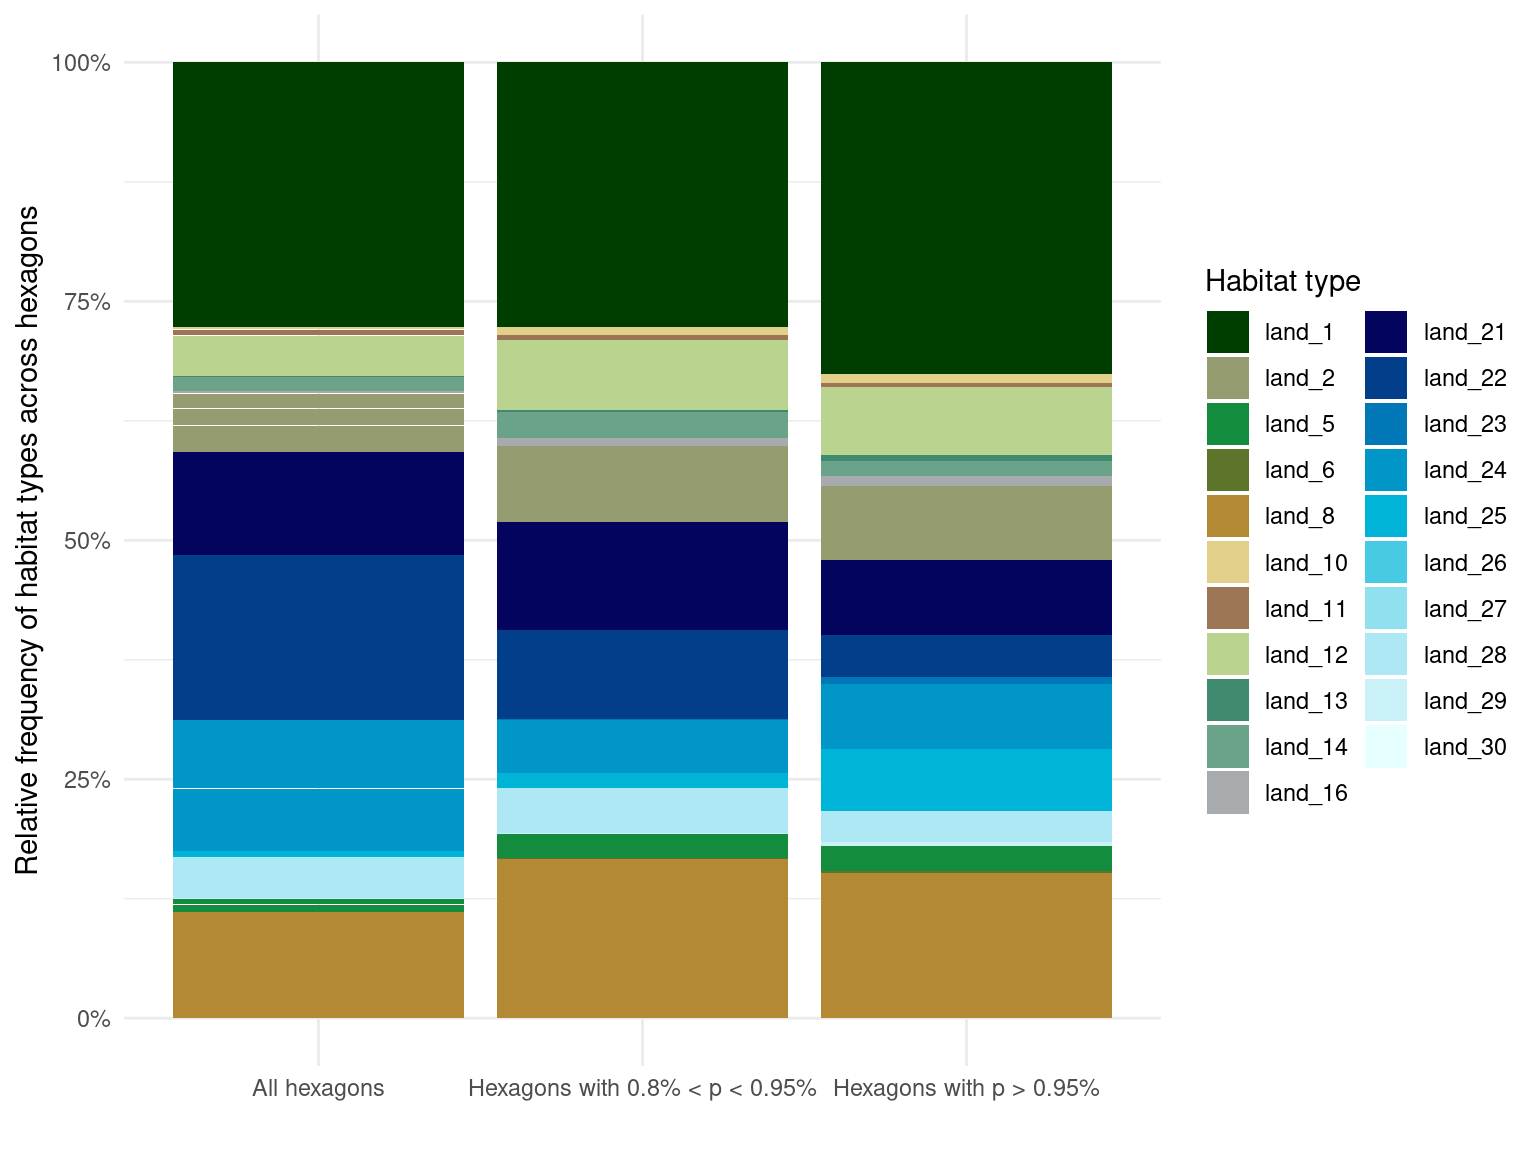
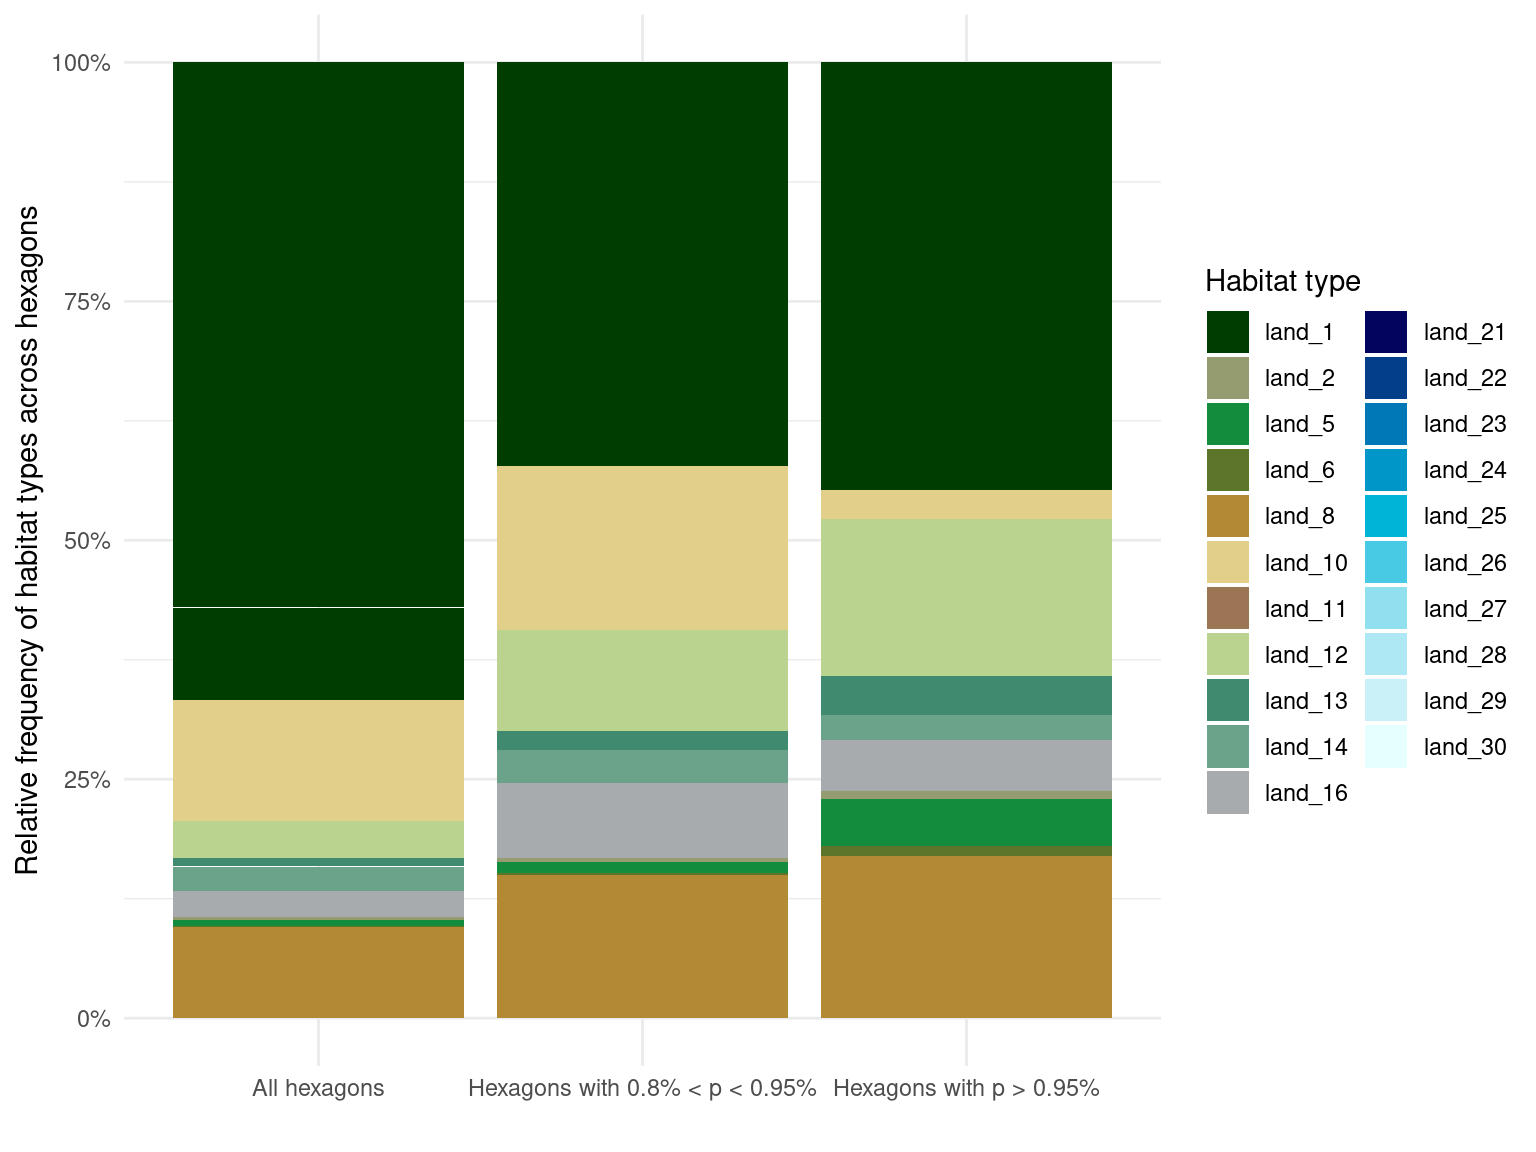
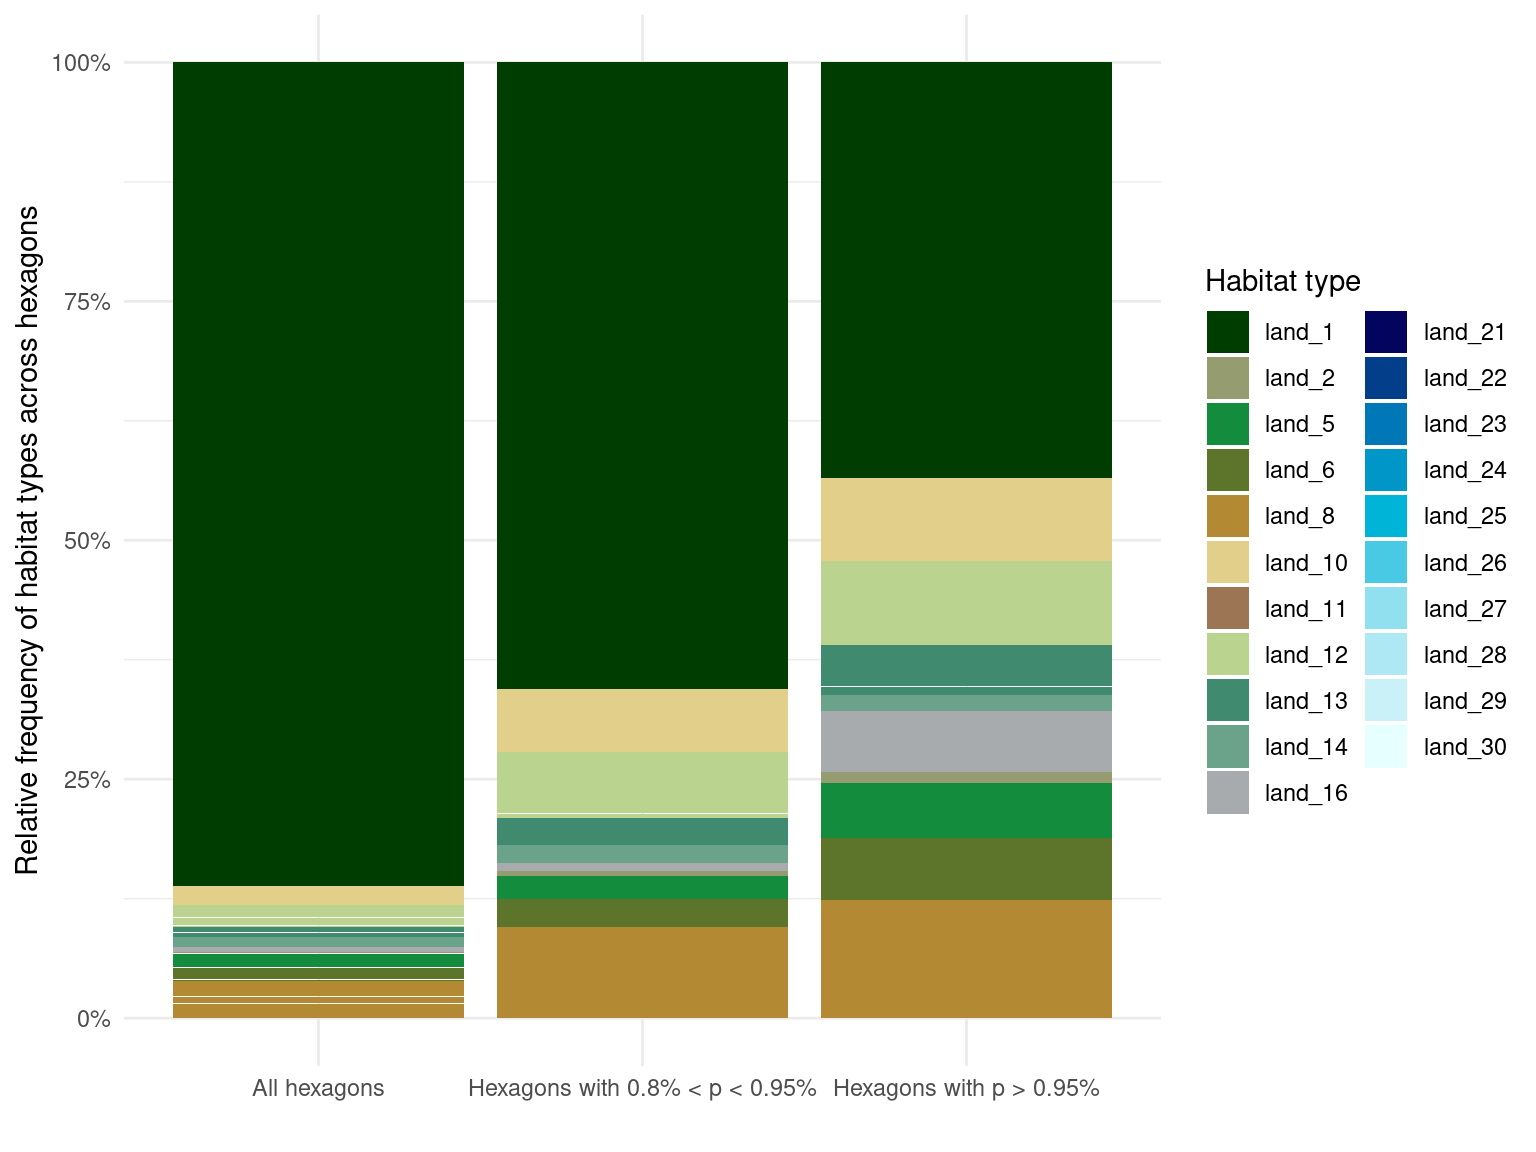
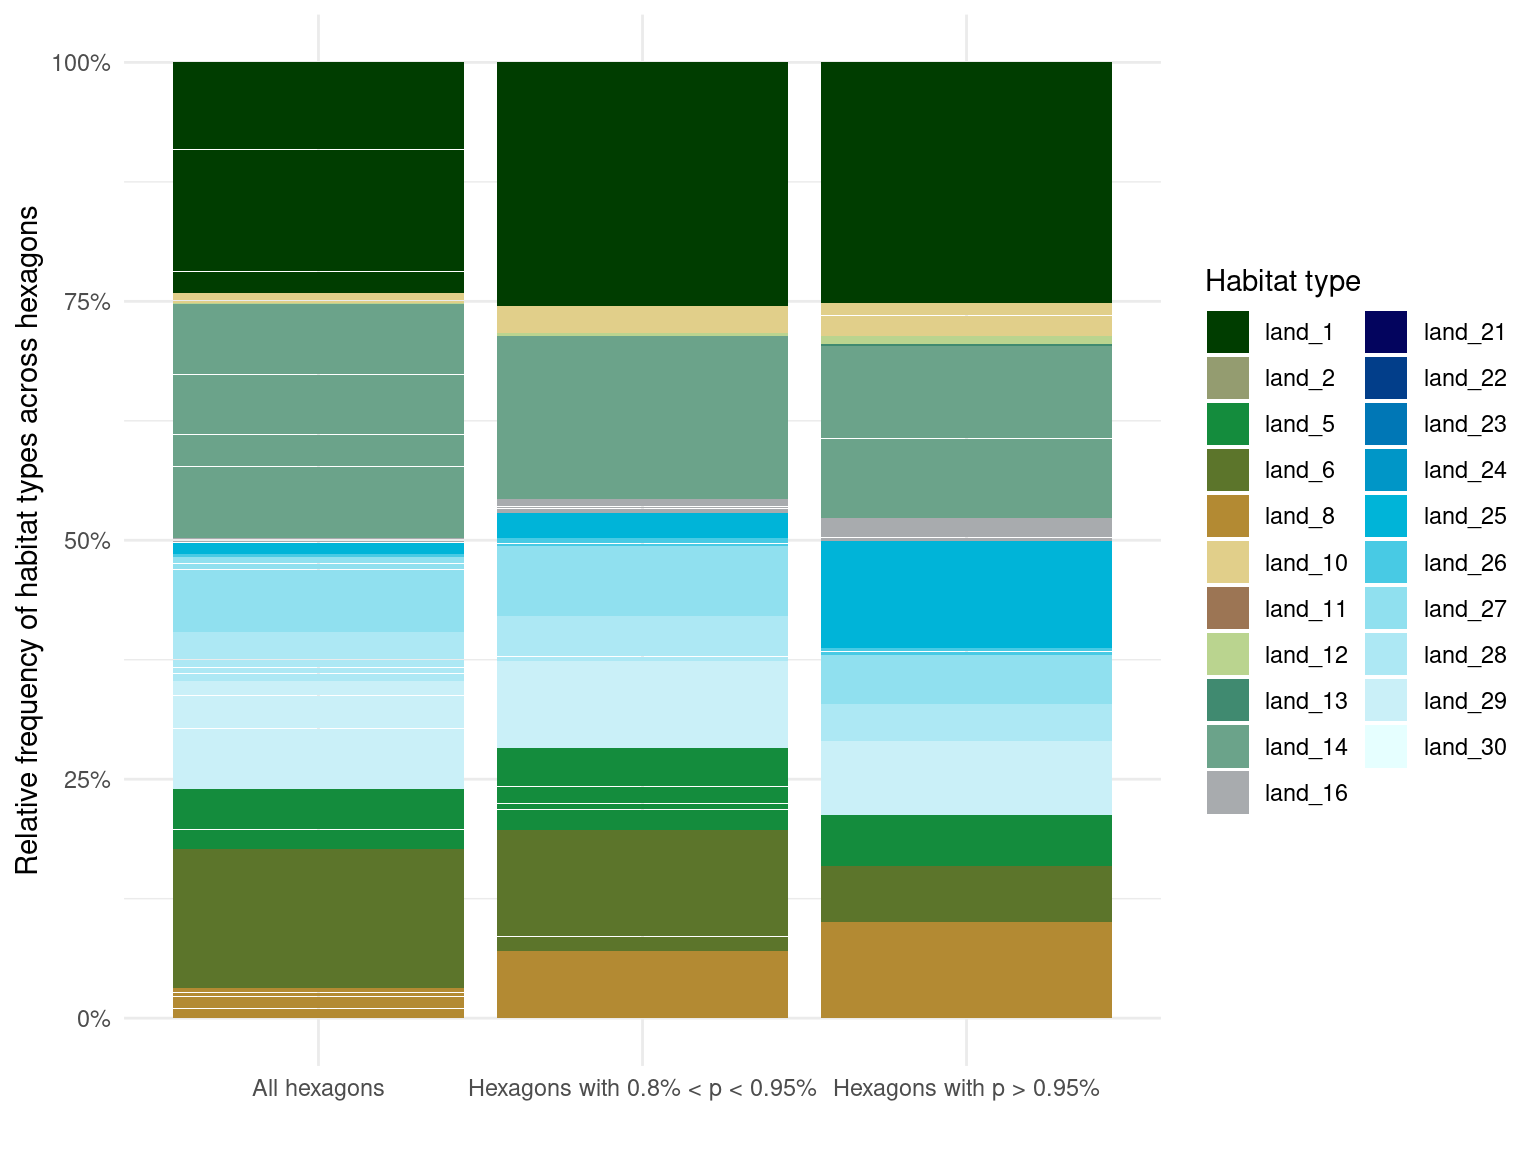
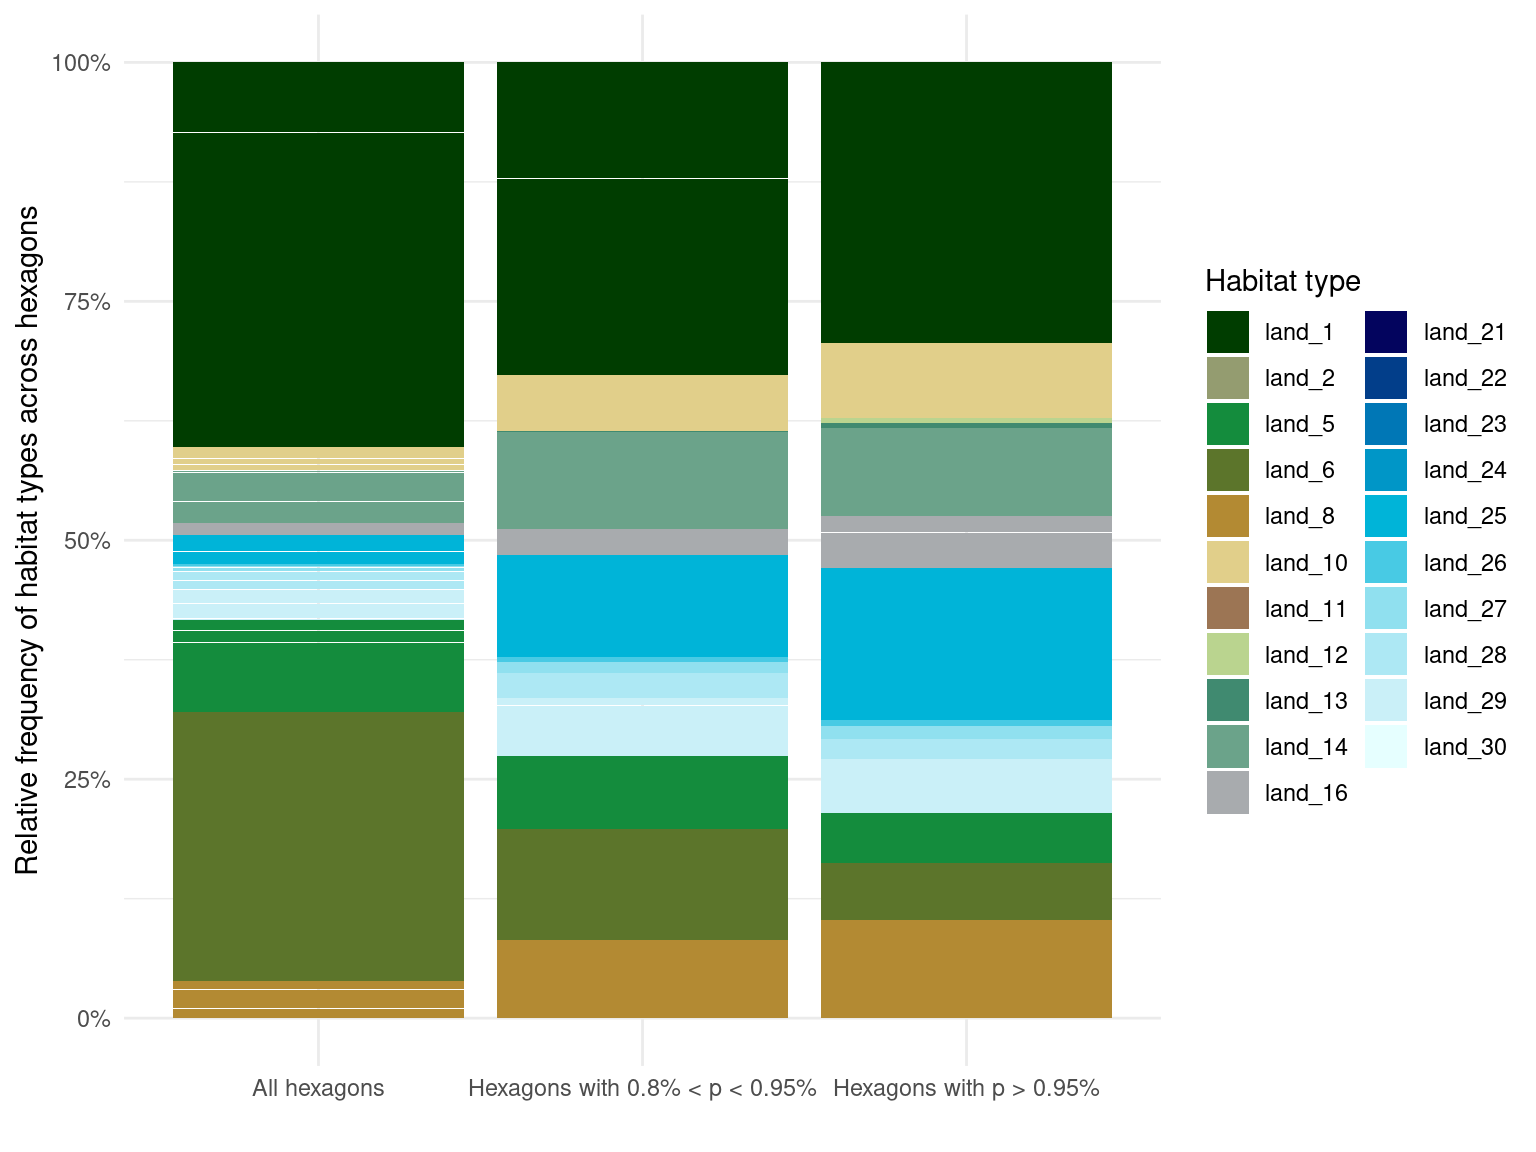
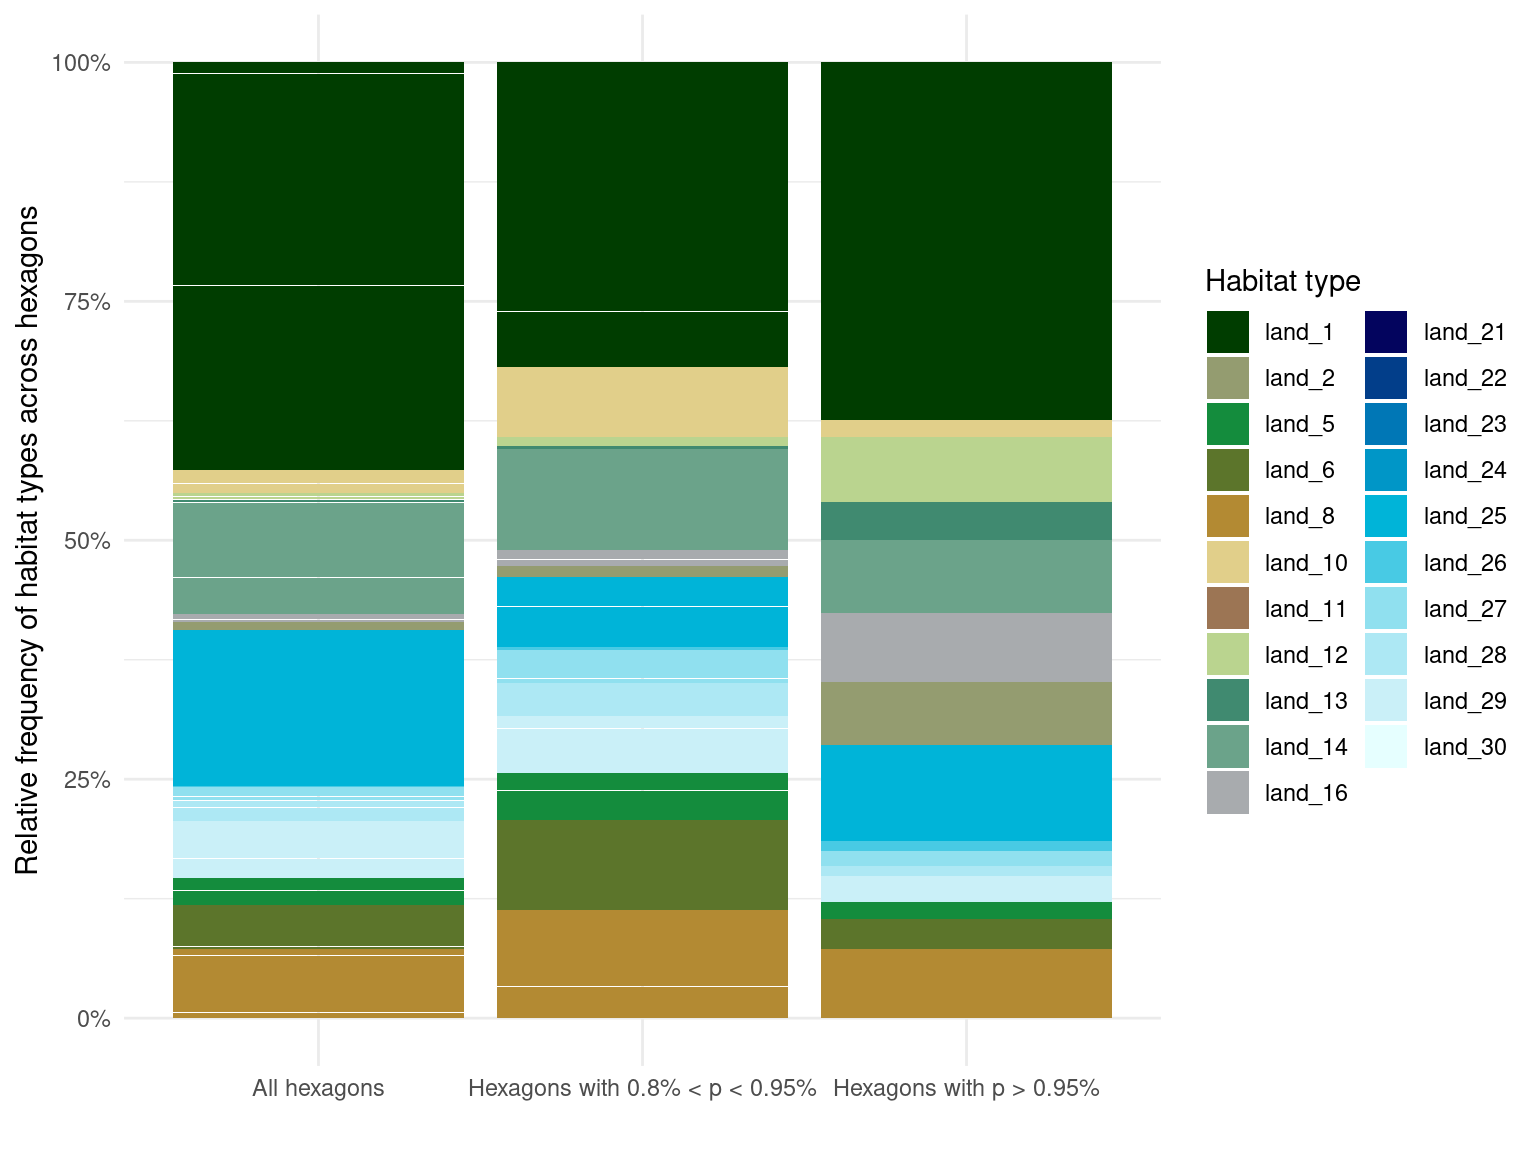
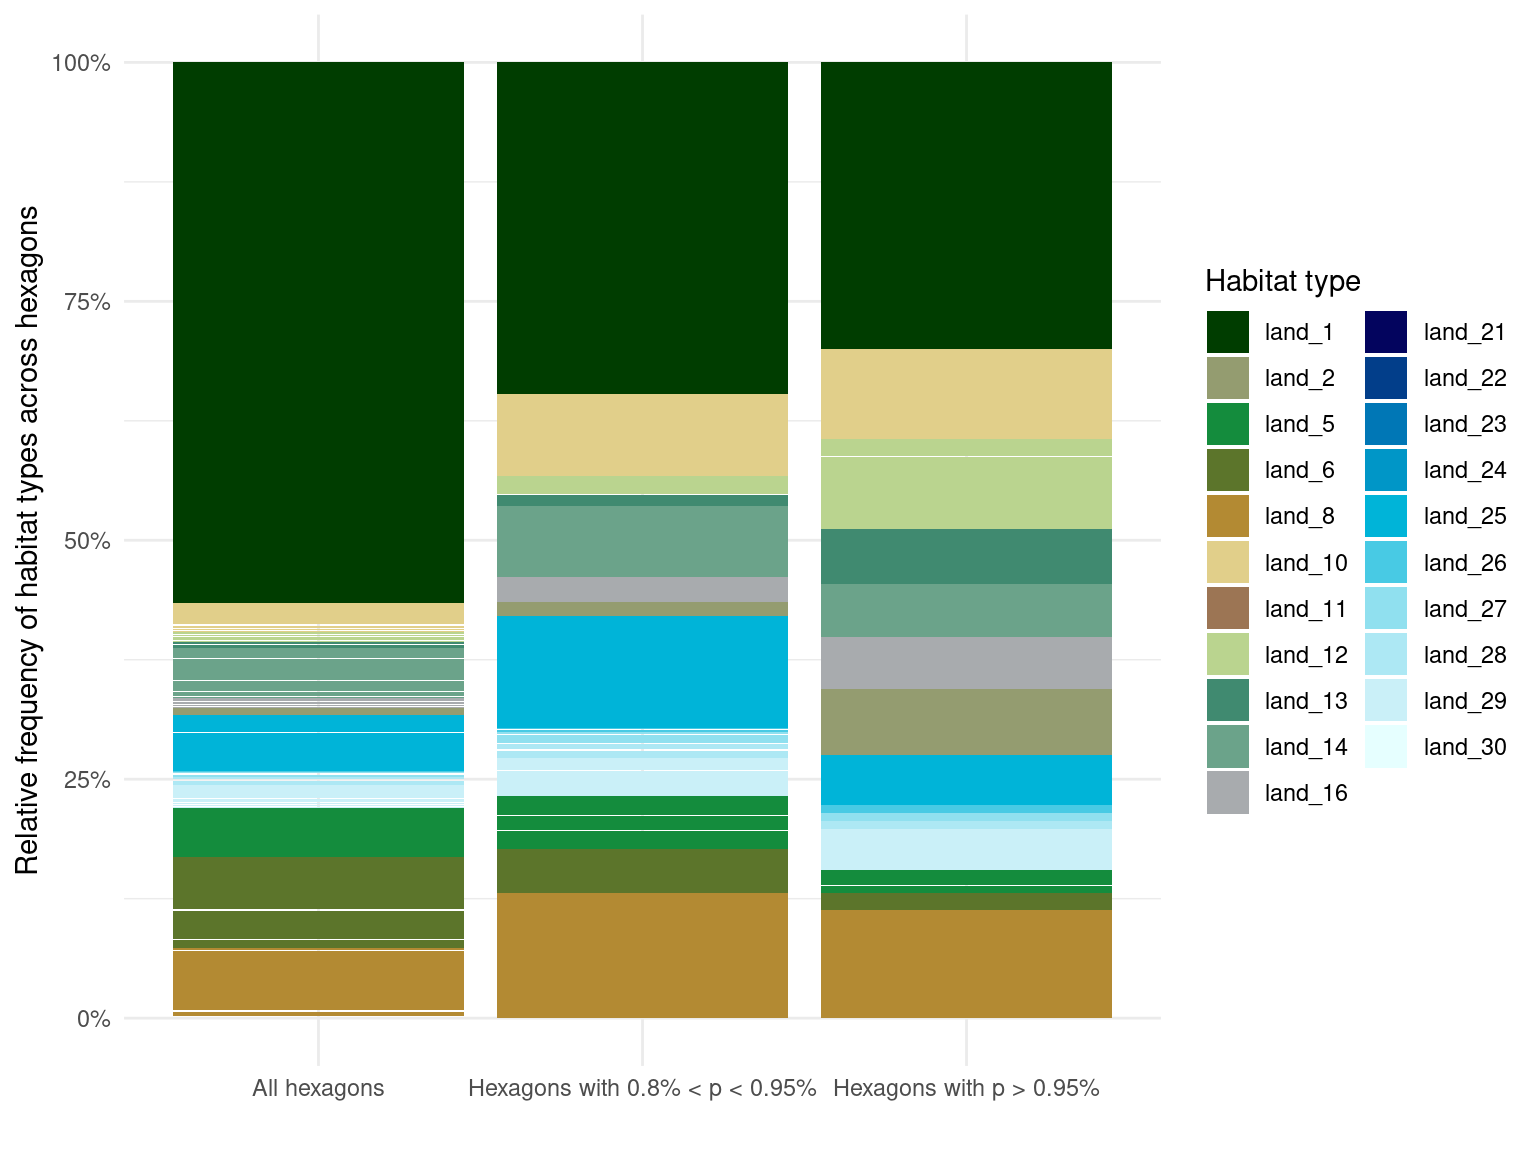
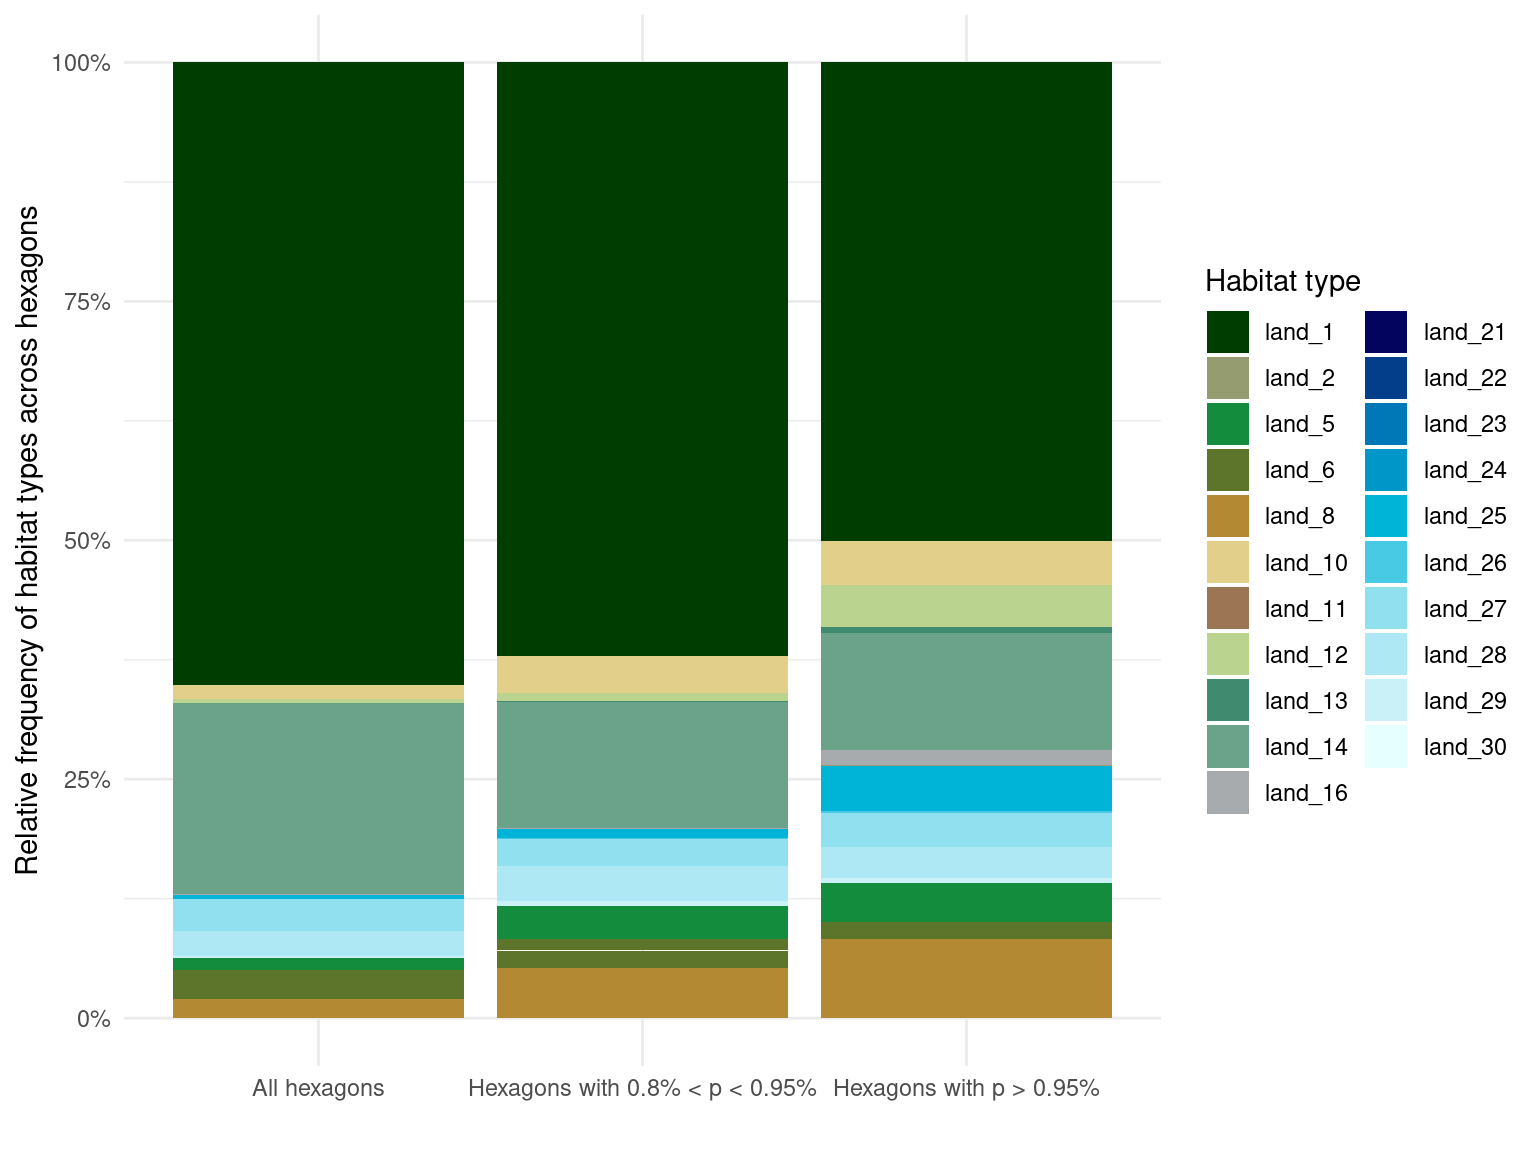
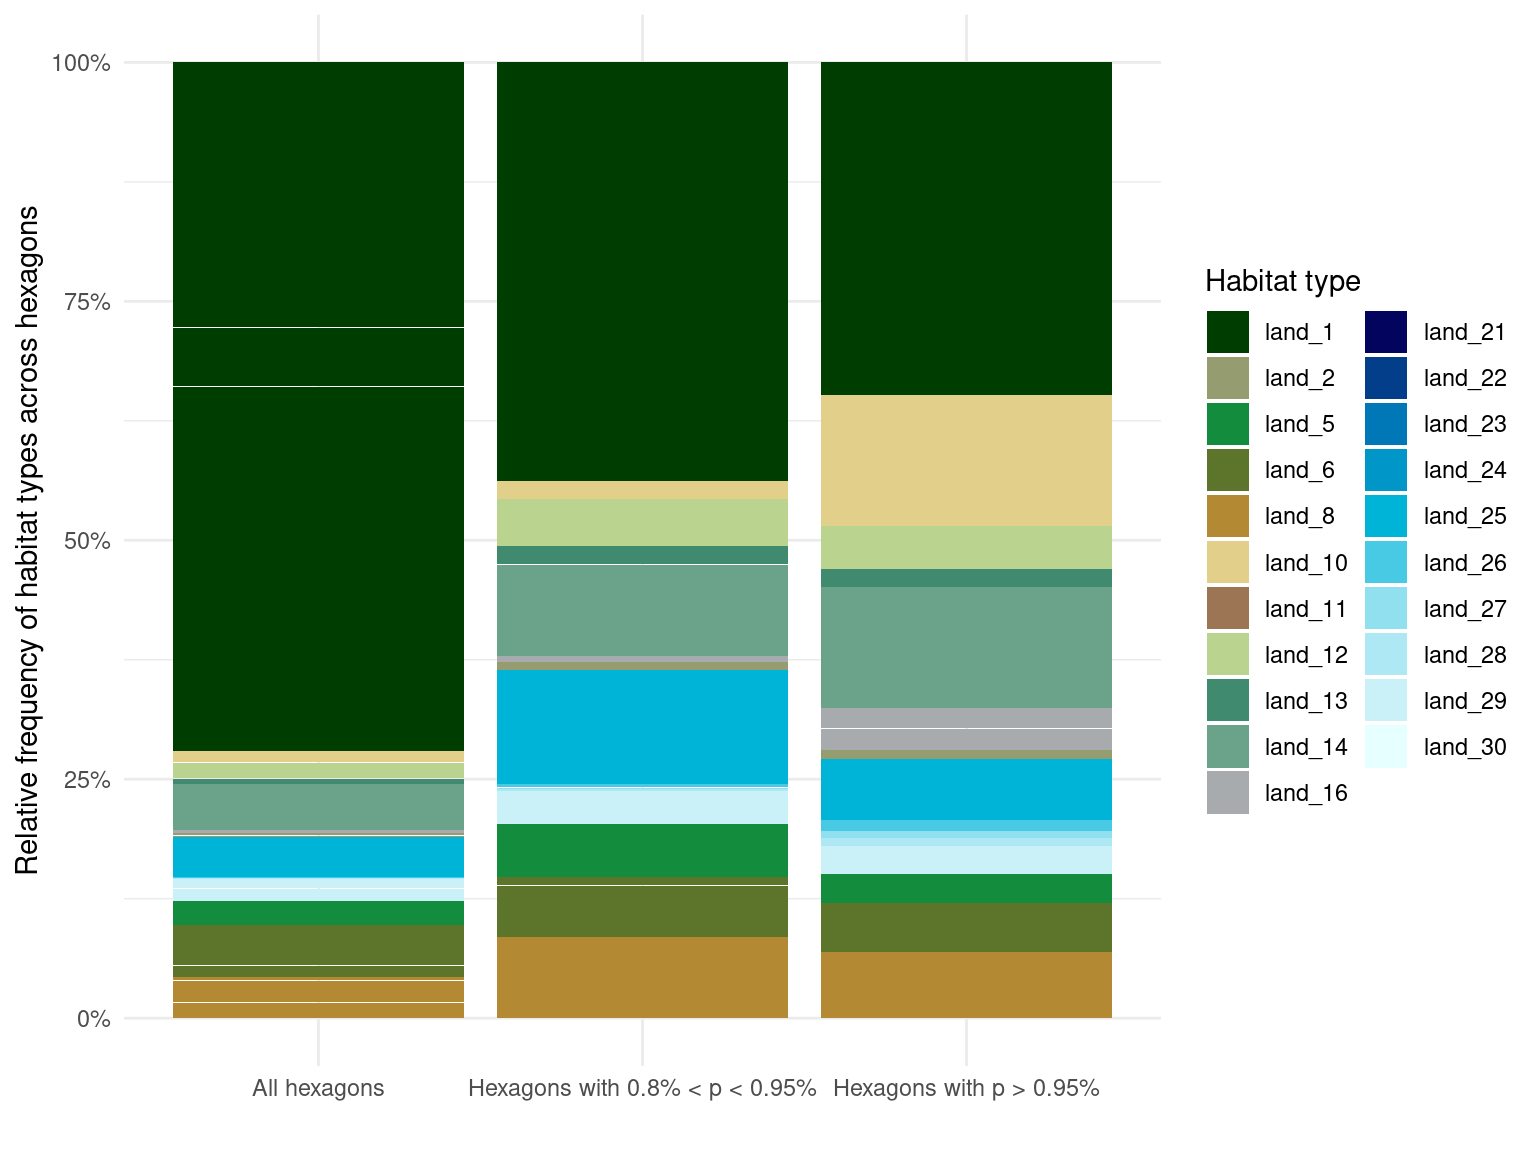
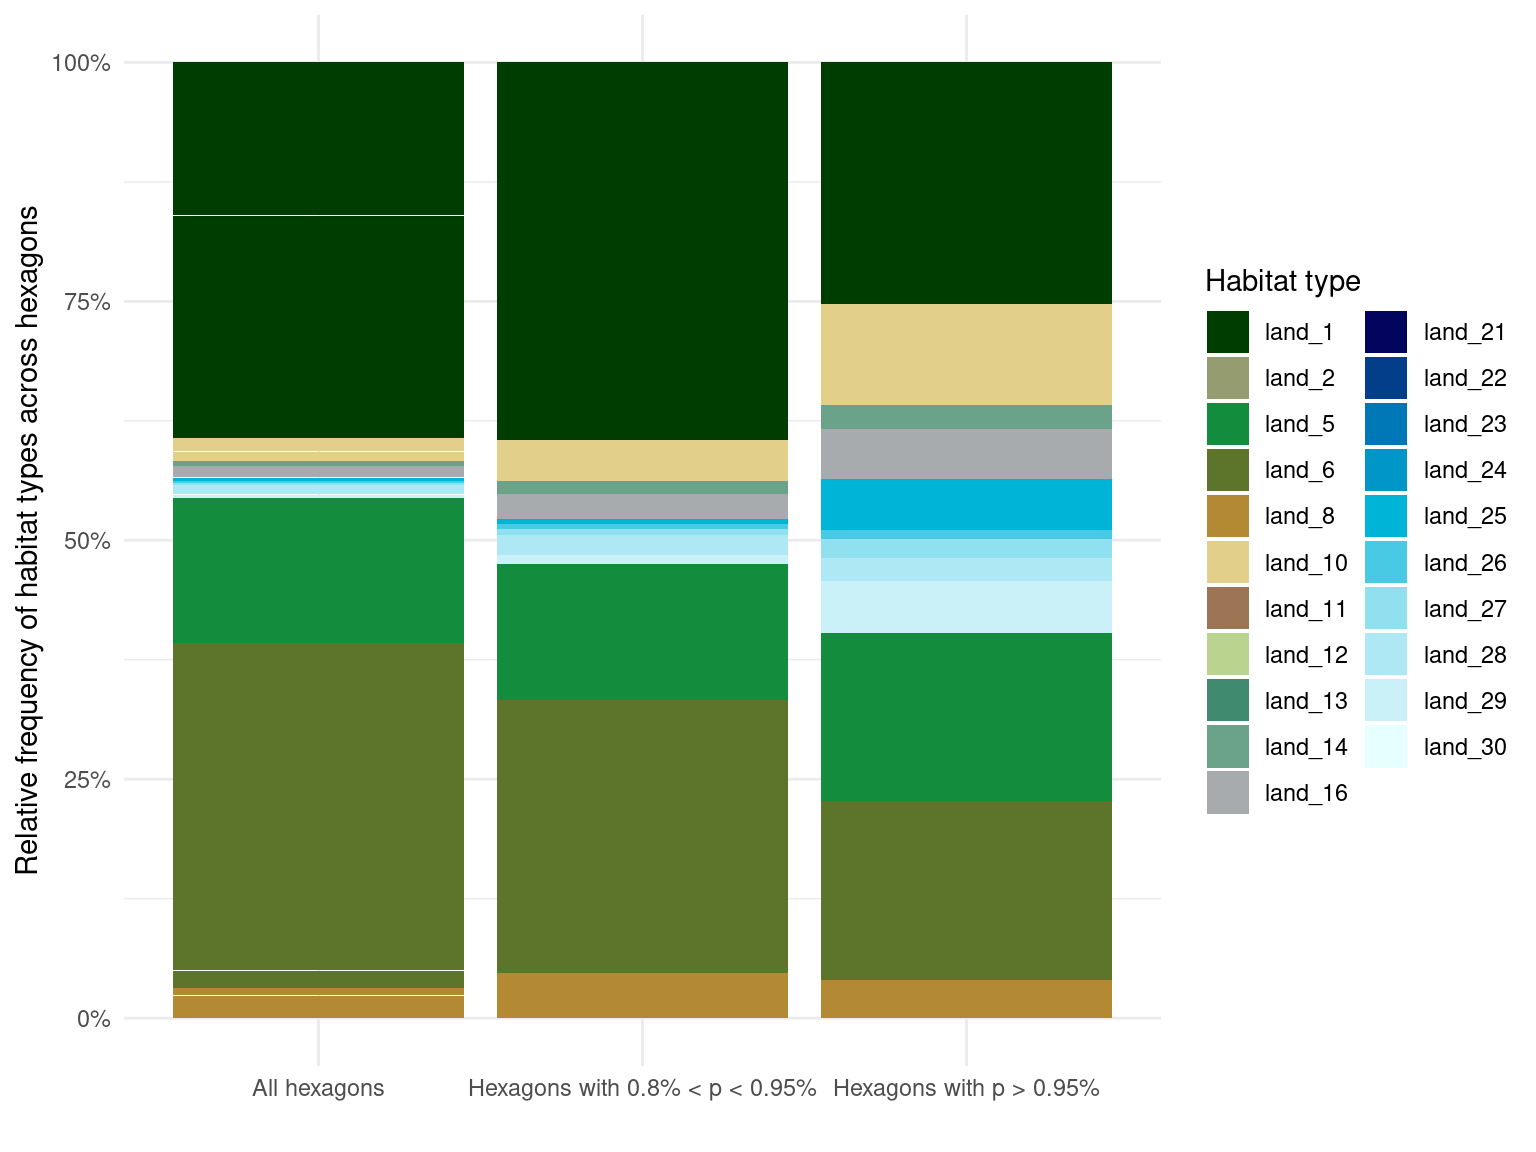
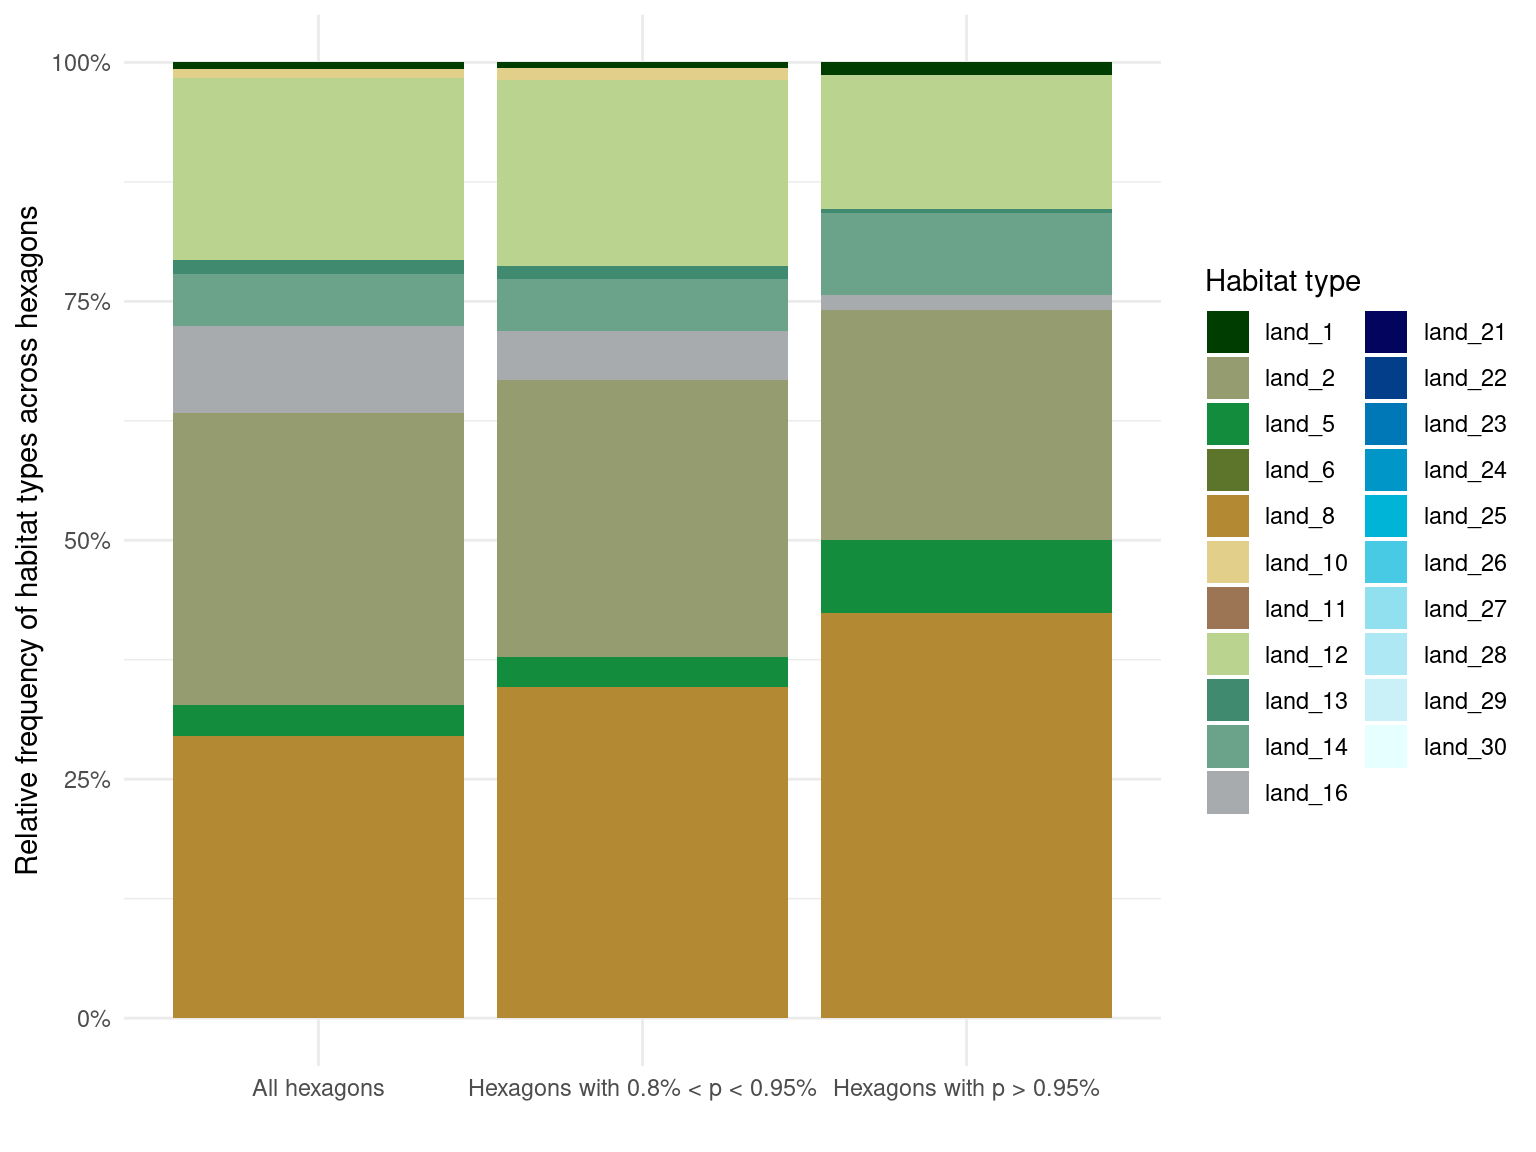
This section provides a summary of the information obtained from the habitat type layer for each ecoregion (detailed in Chapter 3). The frequency of each habitat type is extracted for every hexagon within the study area. The initial figure displays the relative frequency of habitat types for three classes of hexagons categorized based on their habitat inclusion probability. The first class consists of all hexagons in the ecoregion, while the other two classes only contain hexagons with the highest inclusion probability according to their quantile distribution.
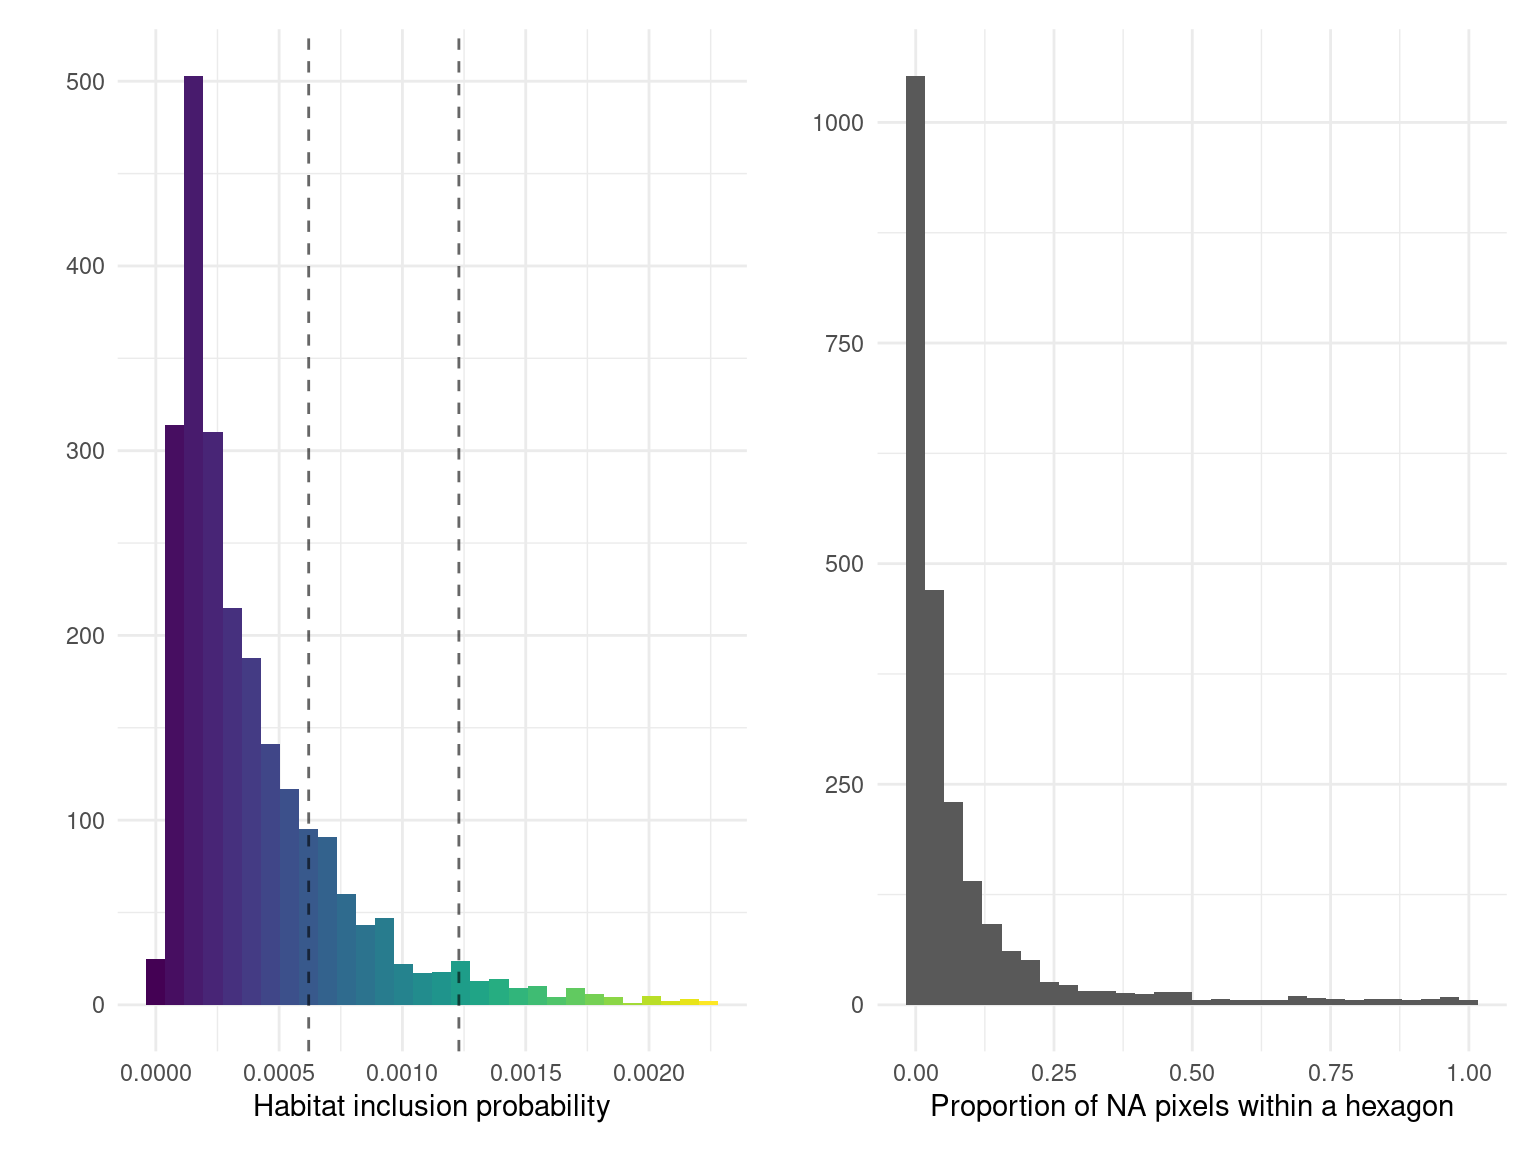
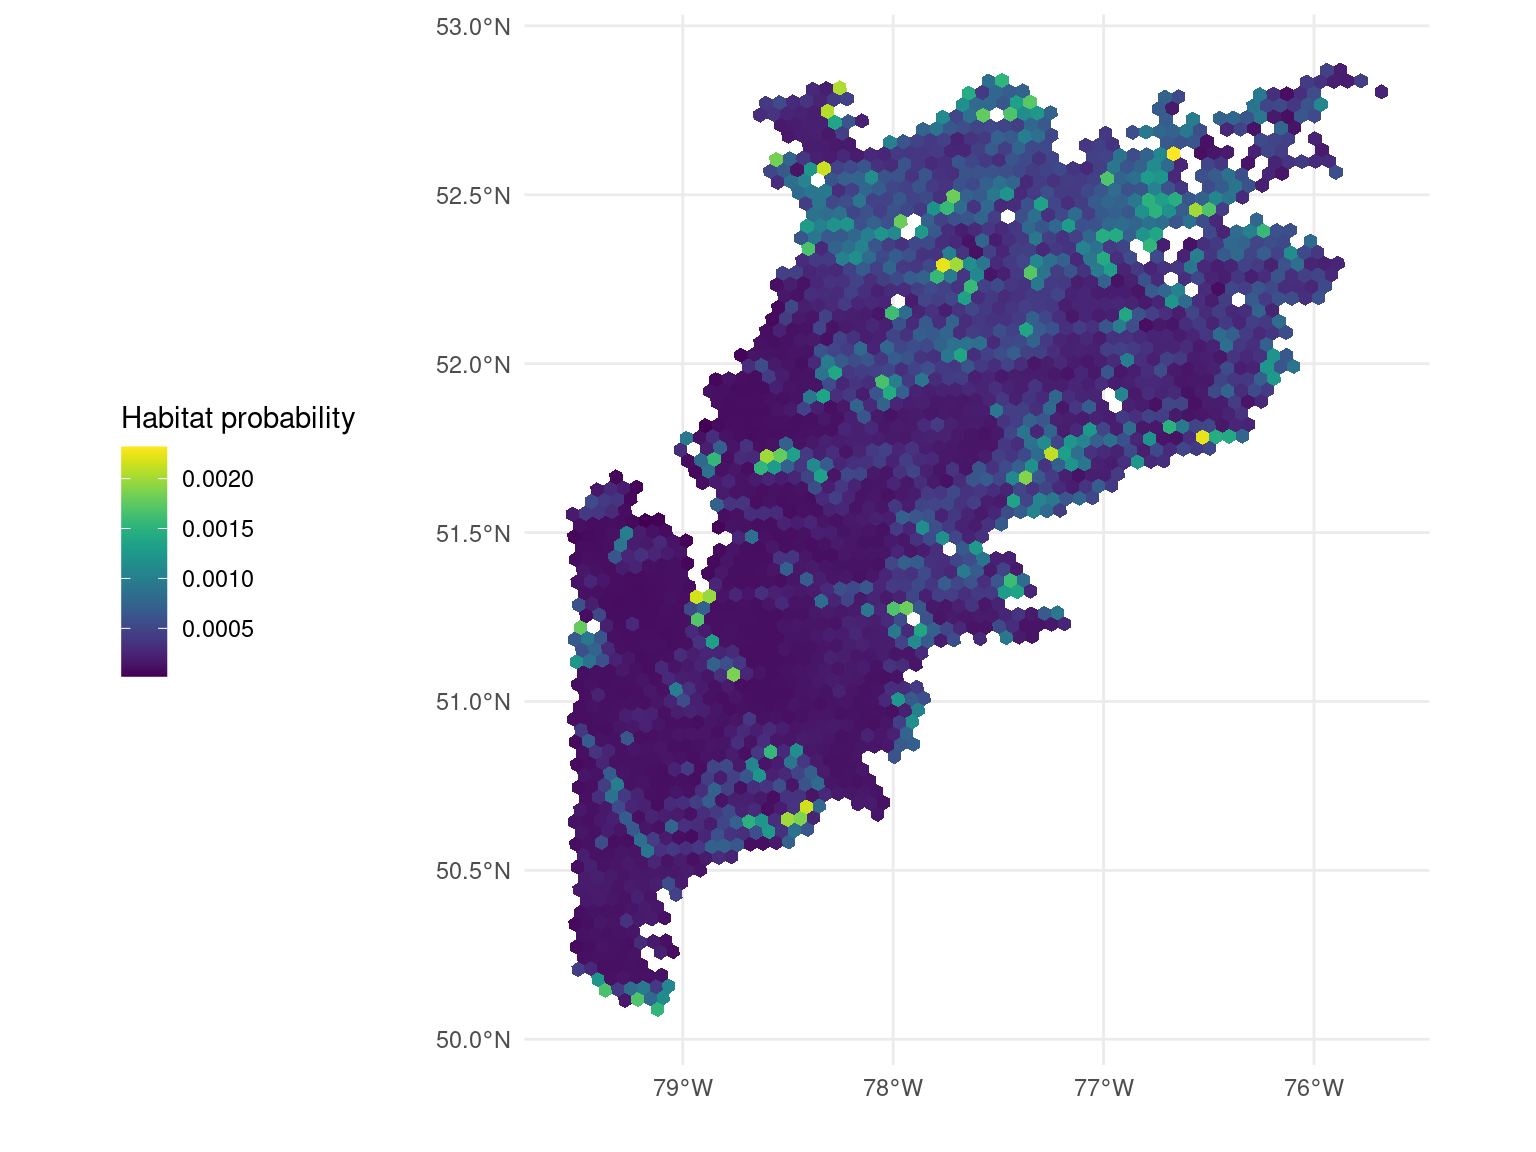
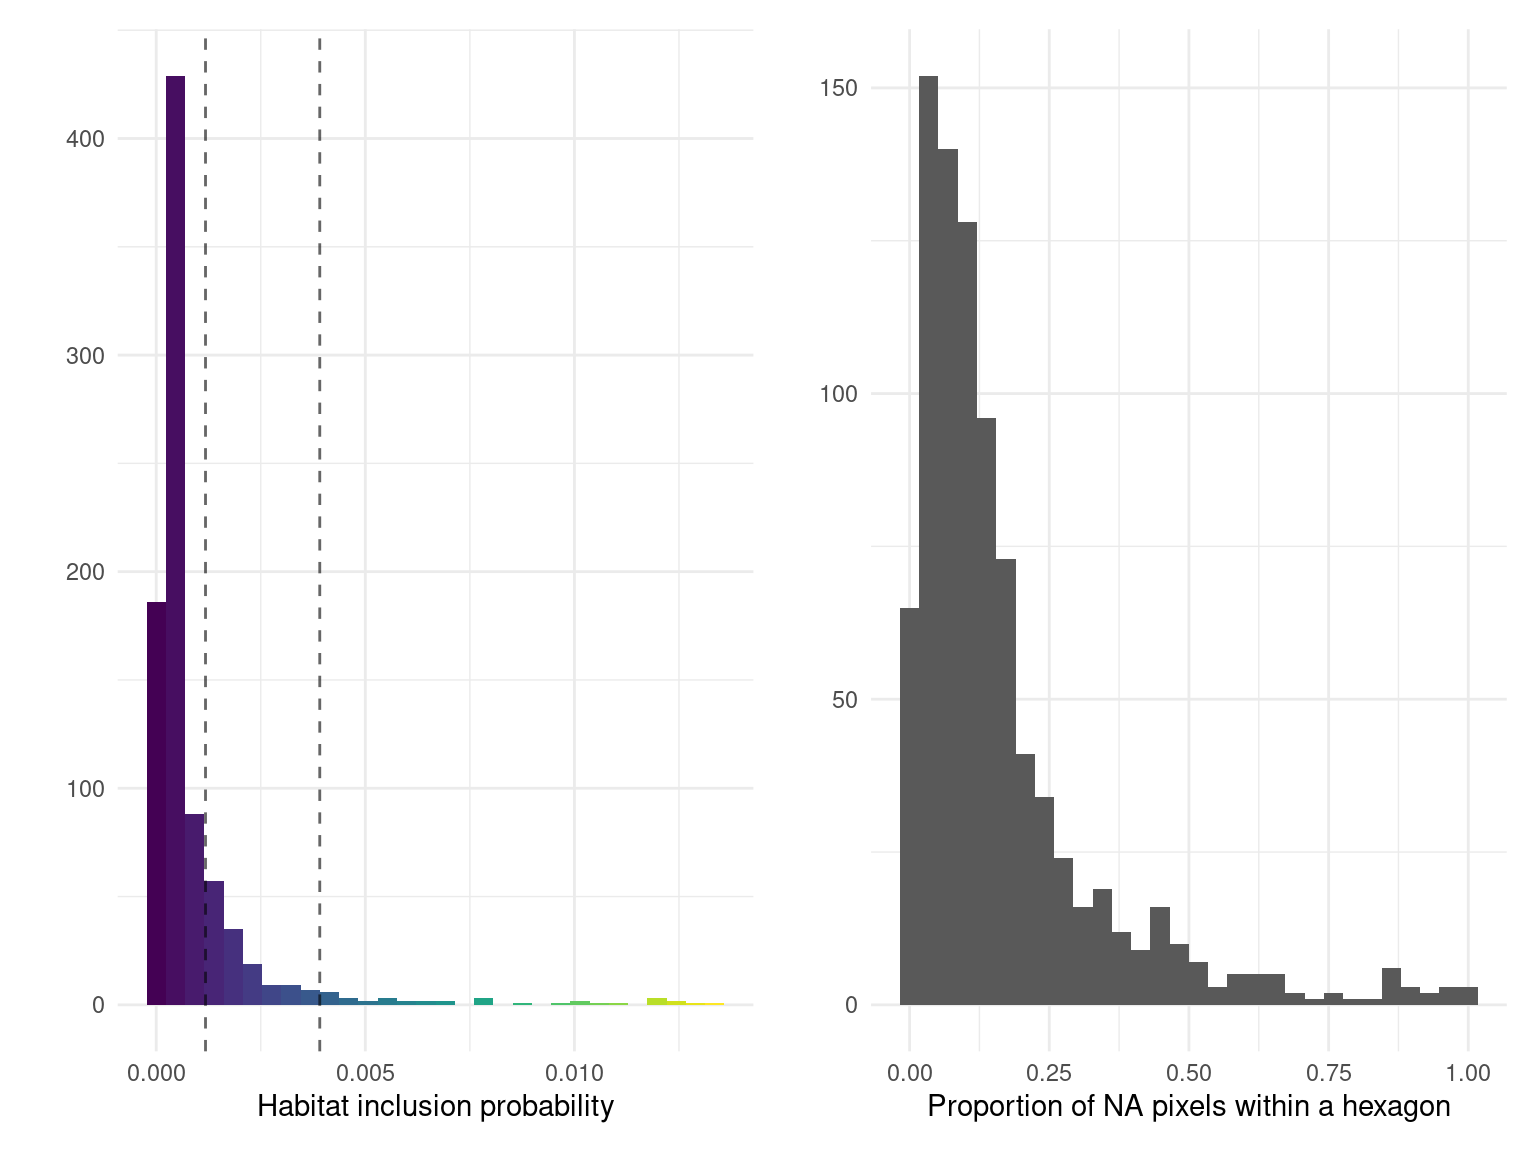
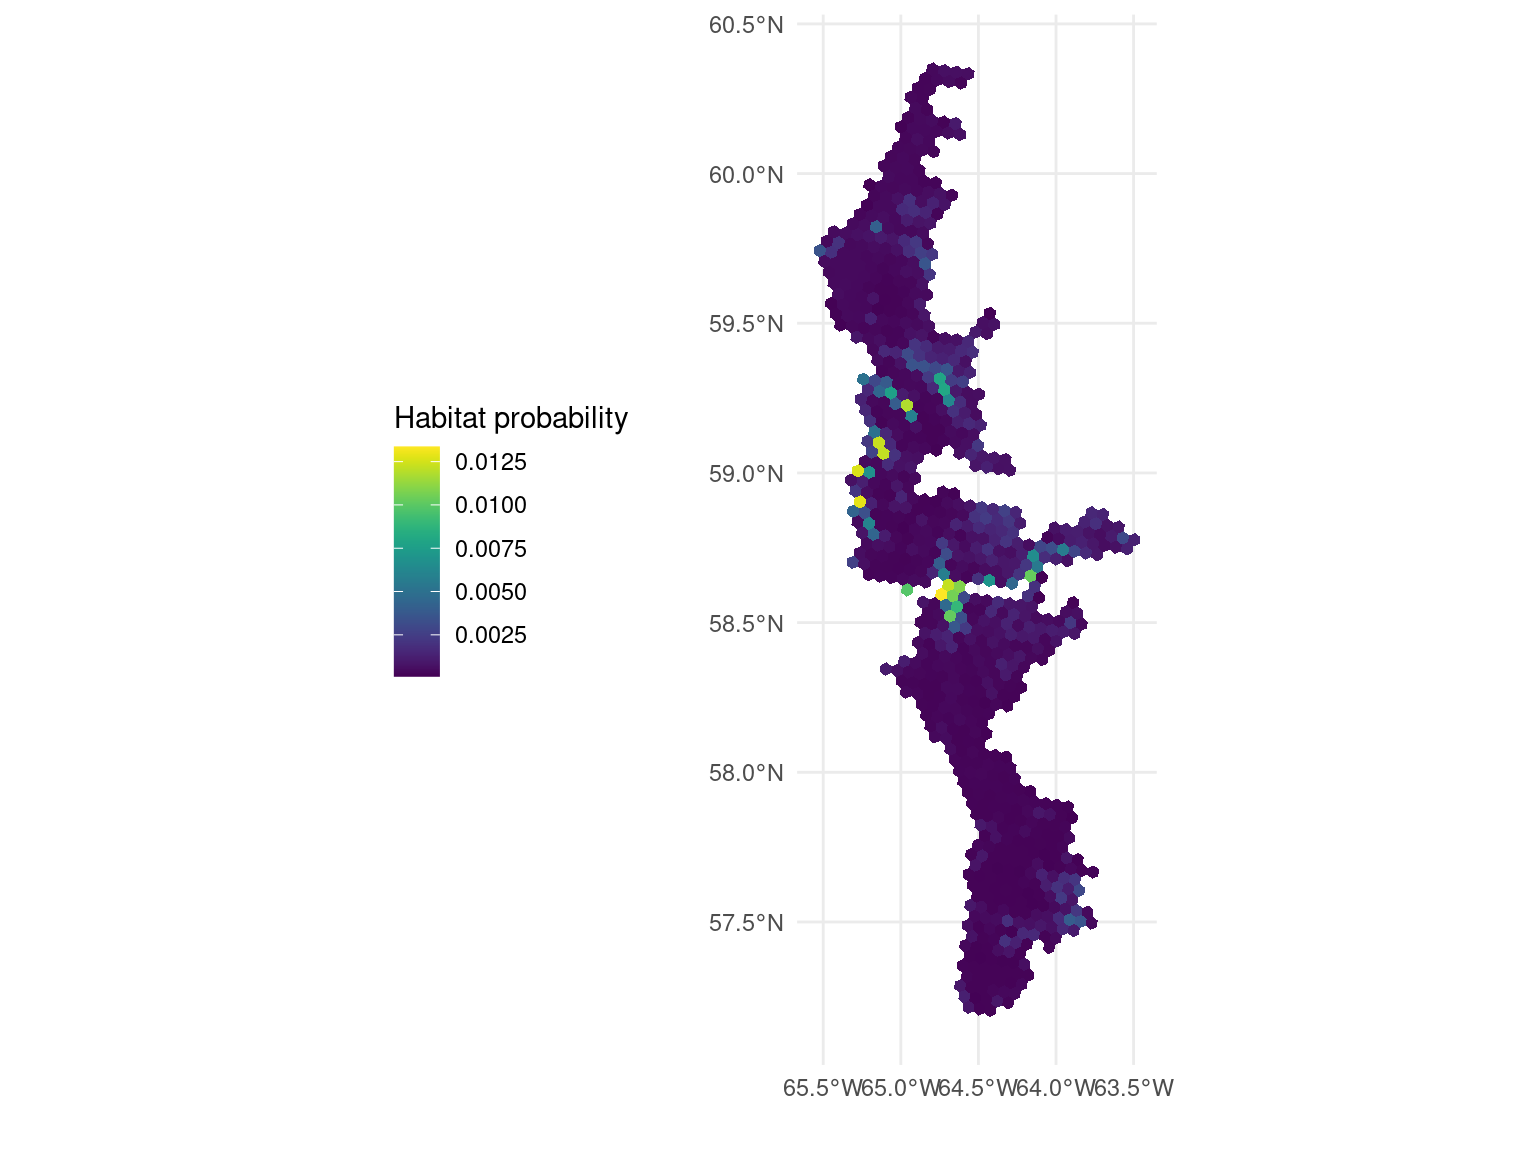
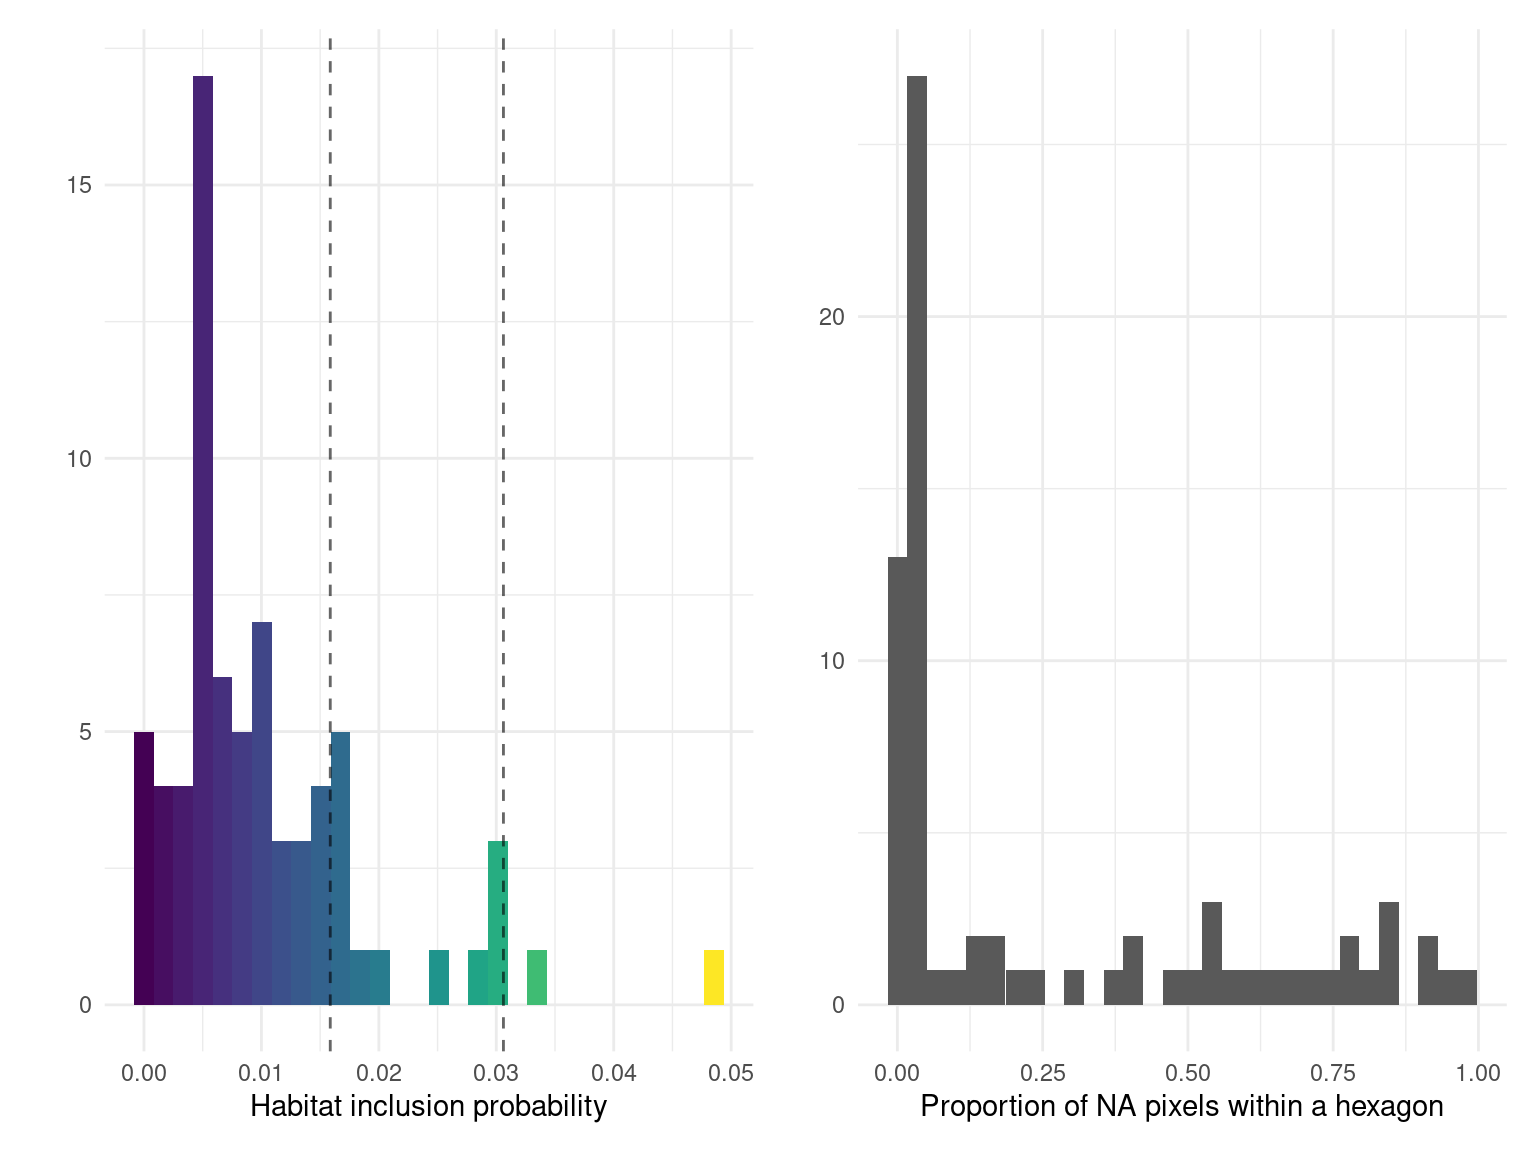
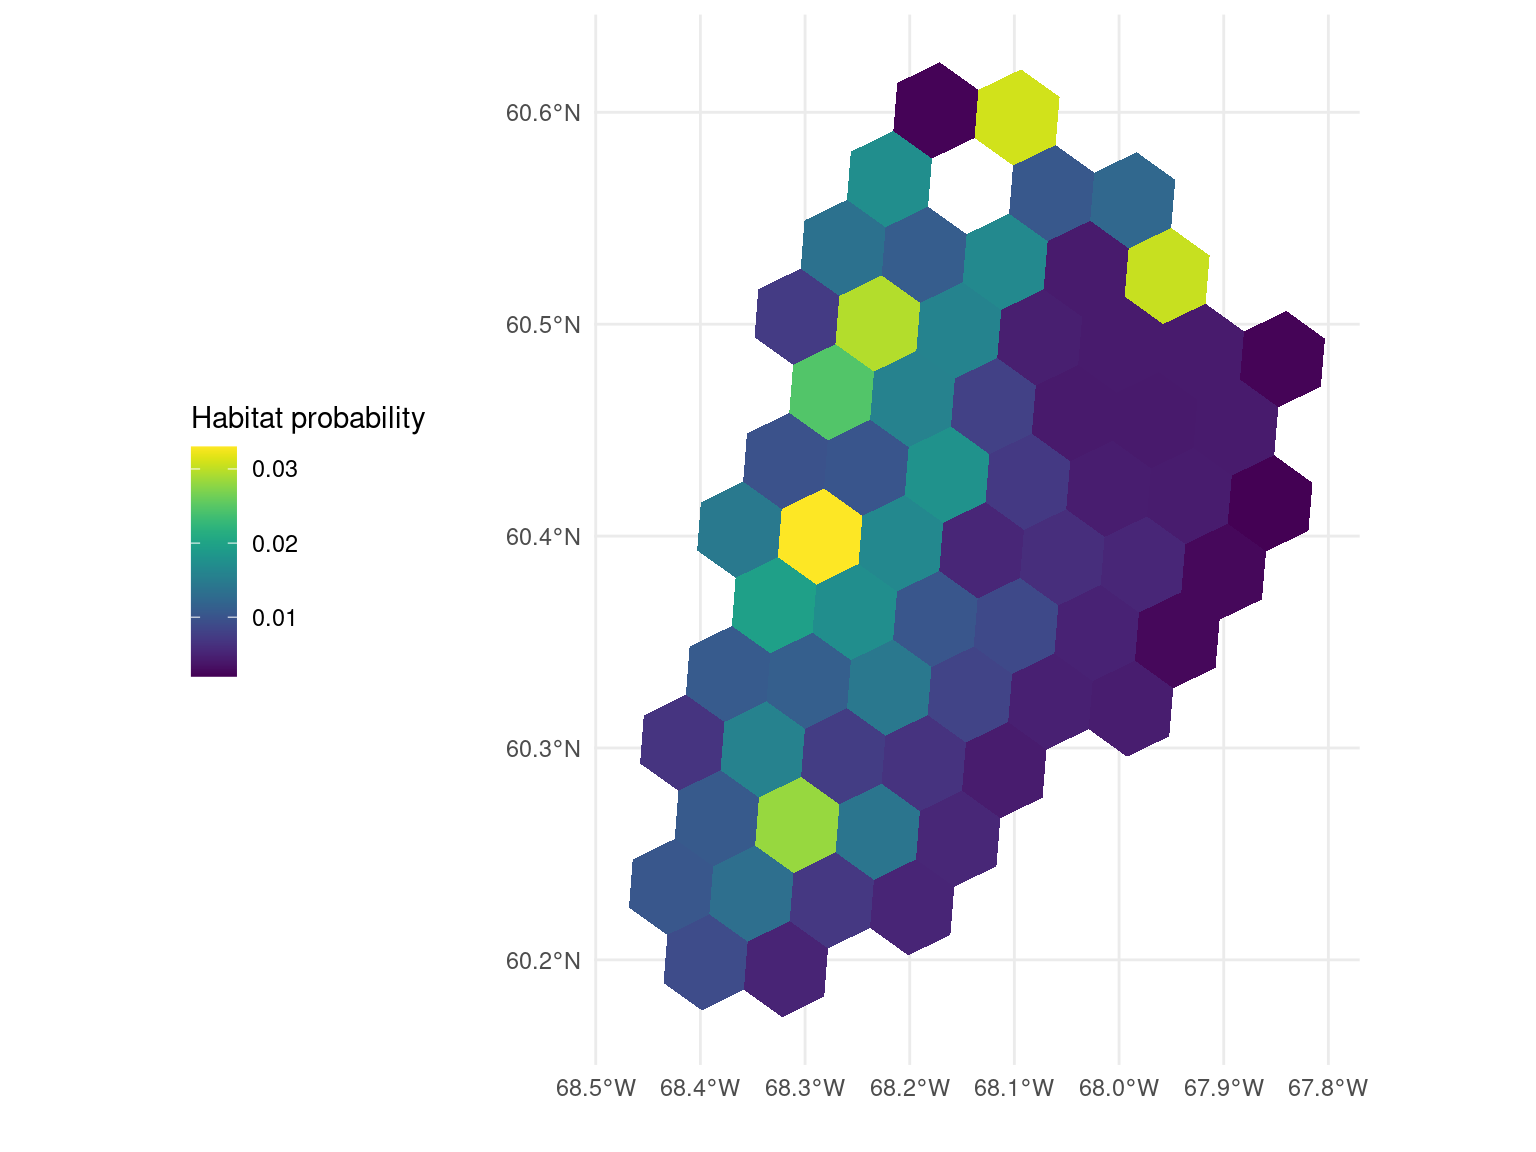
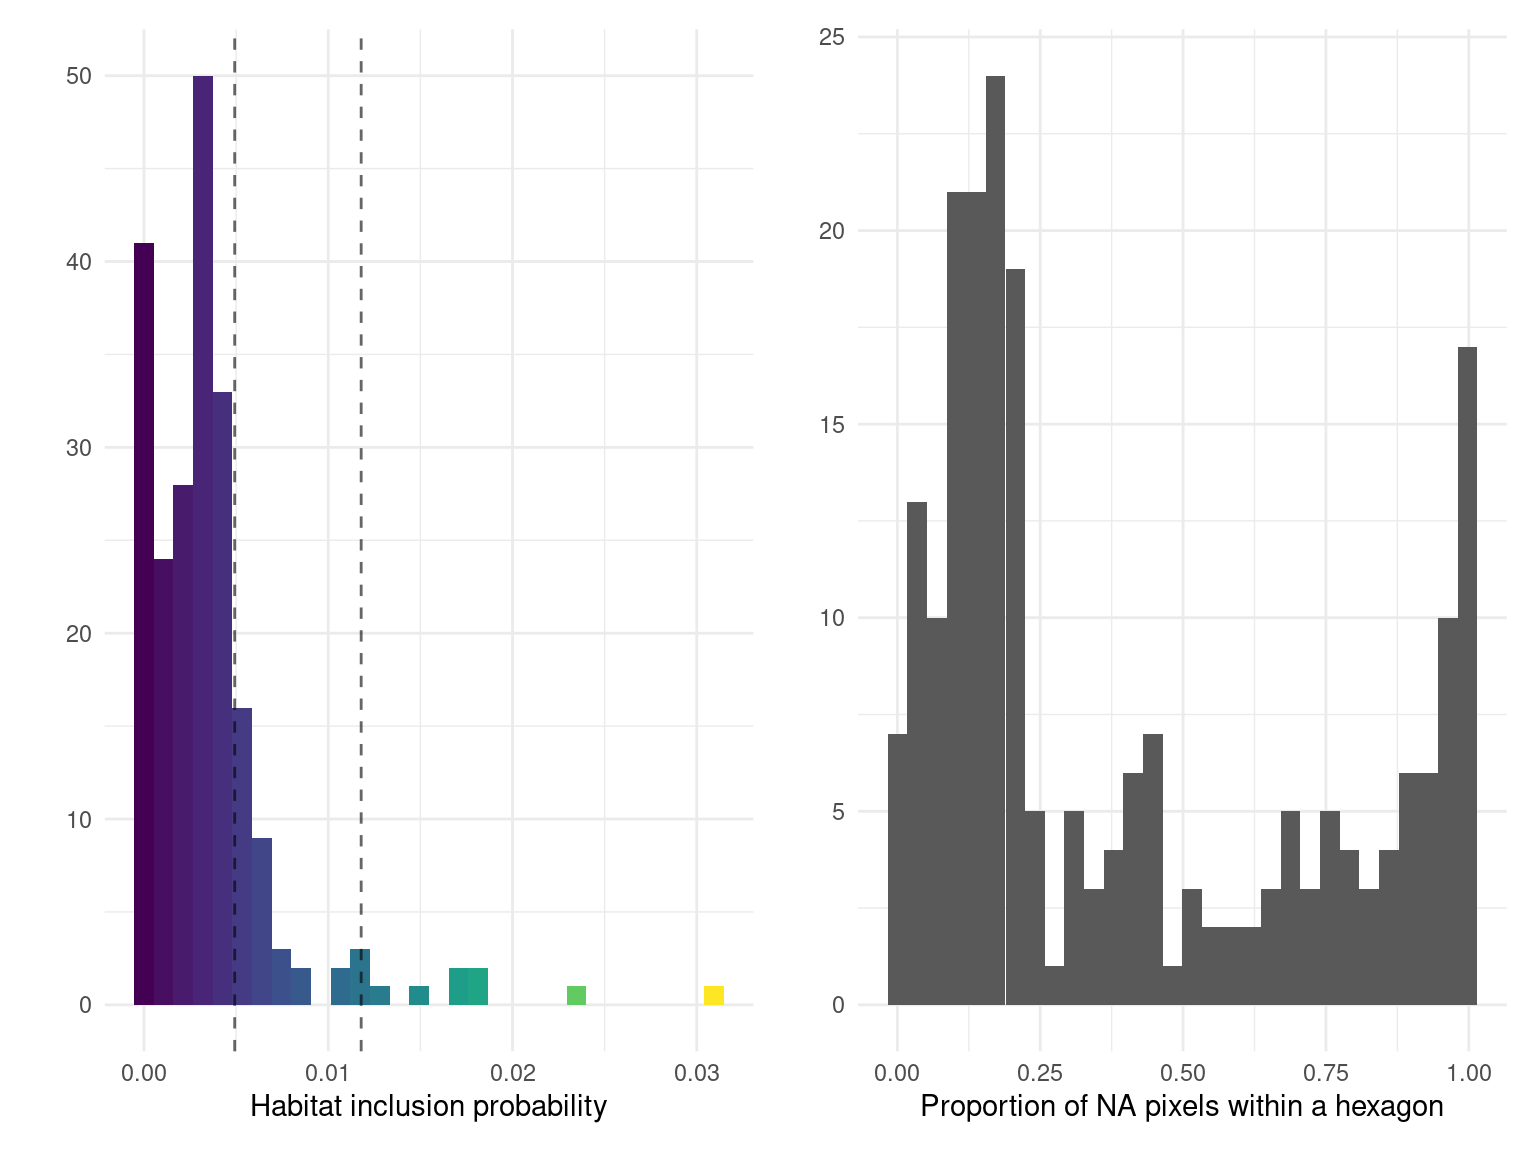
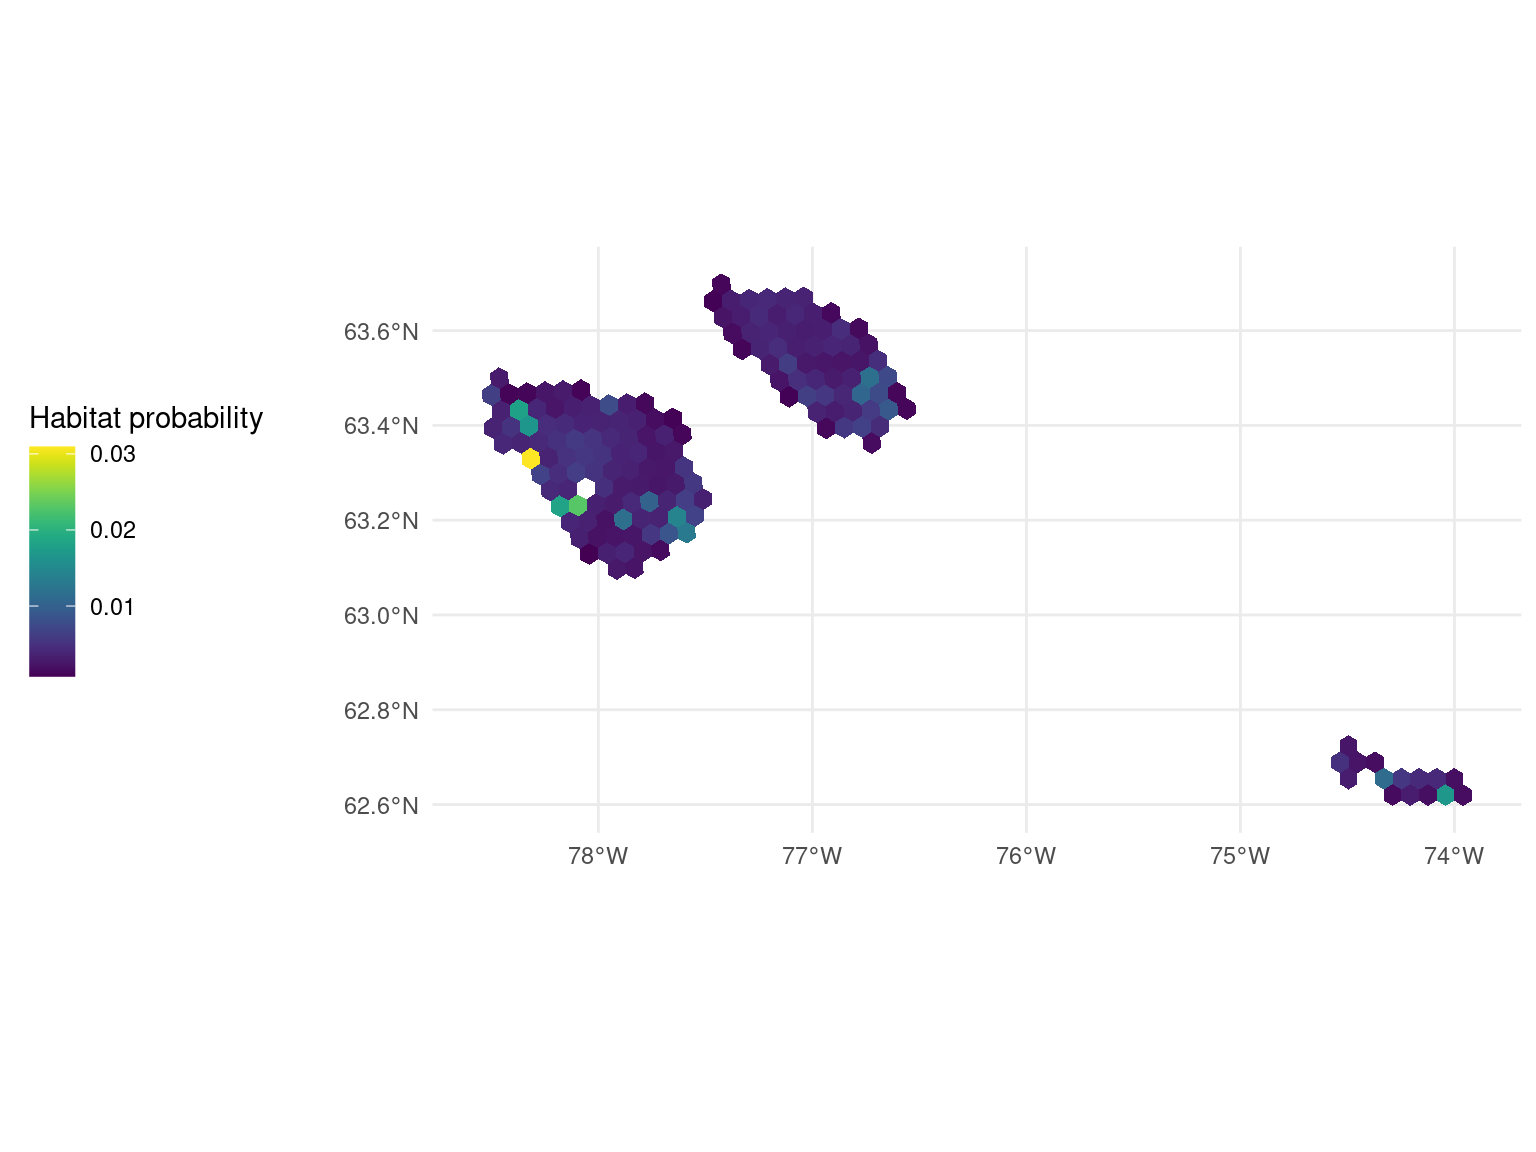
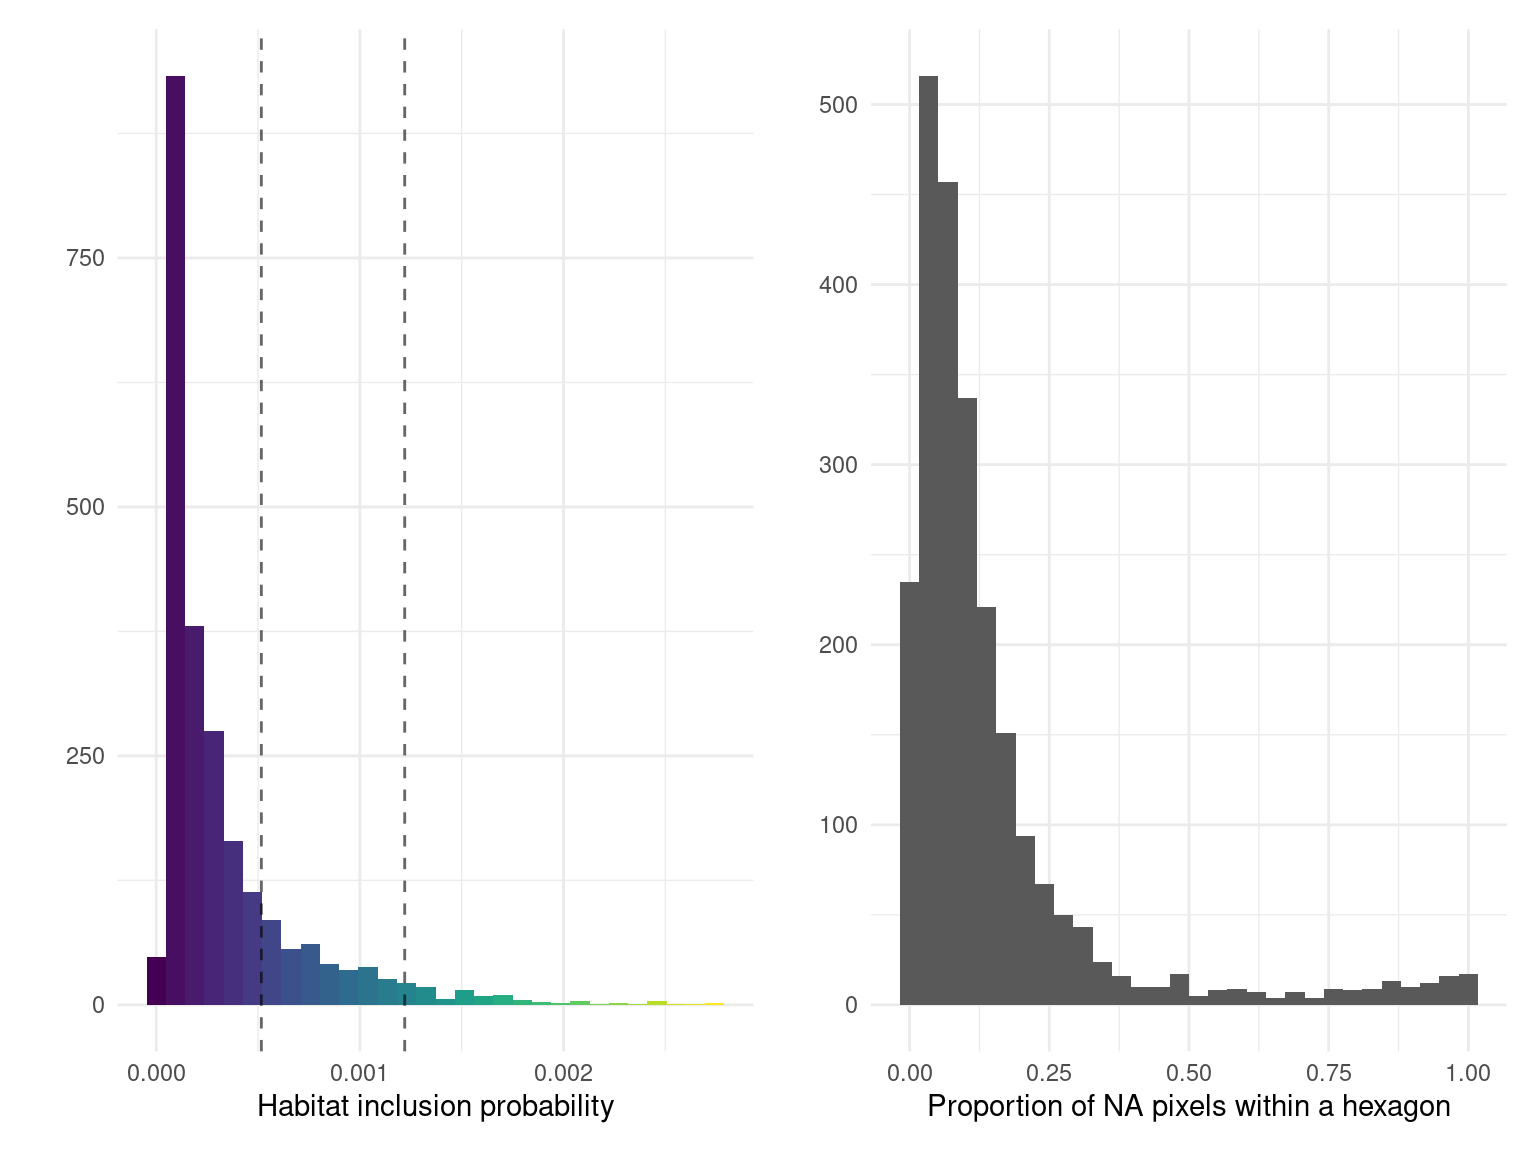
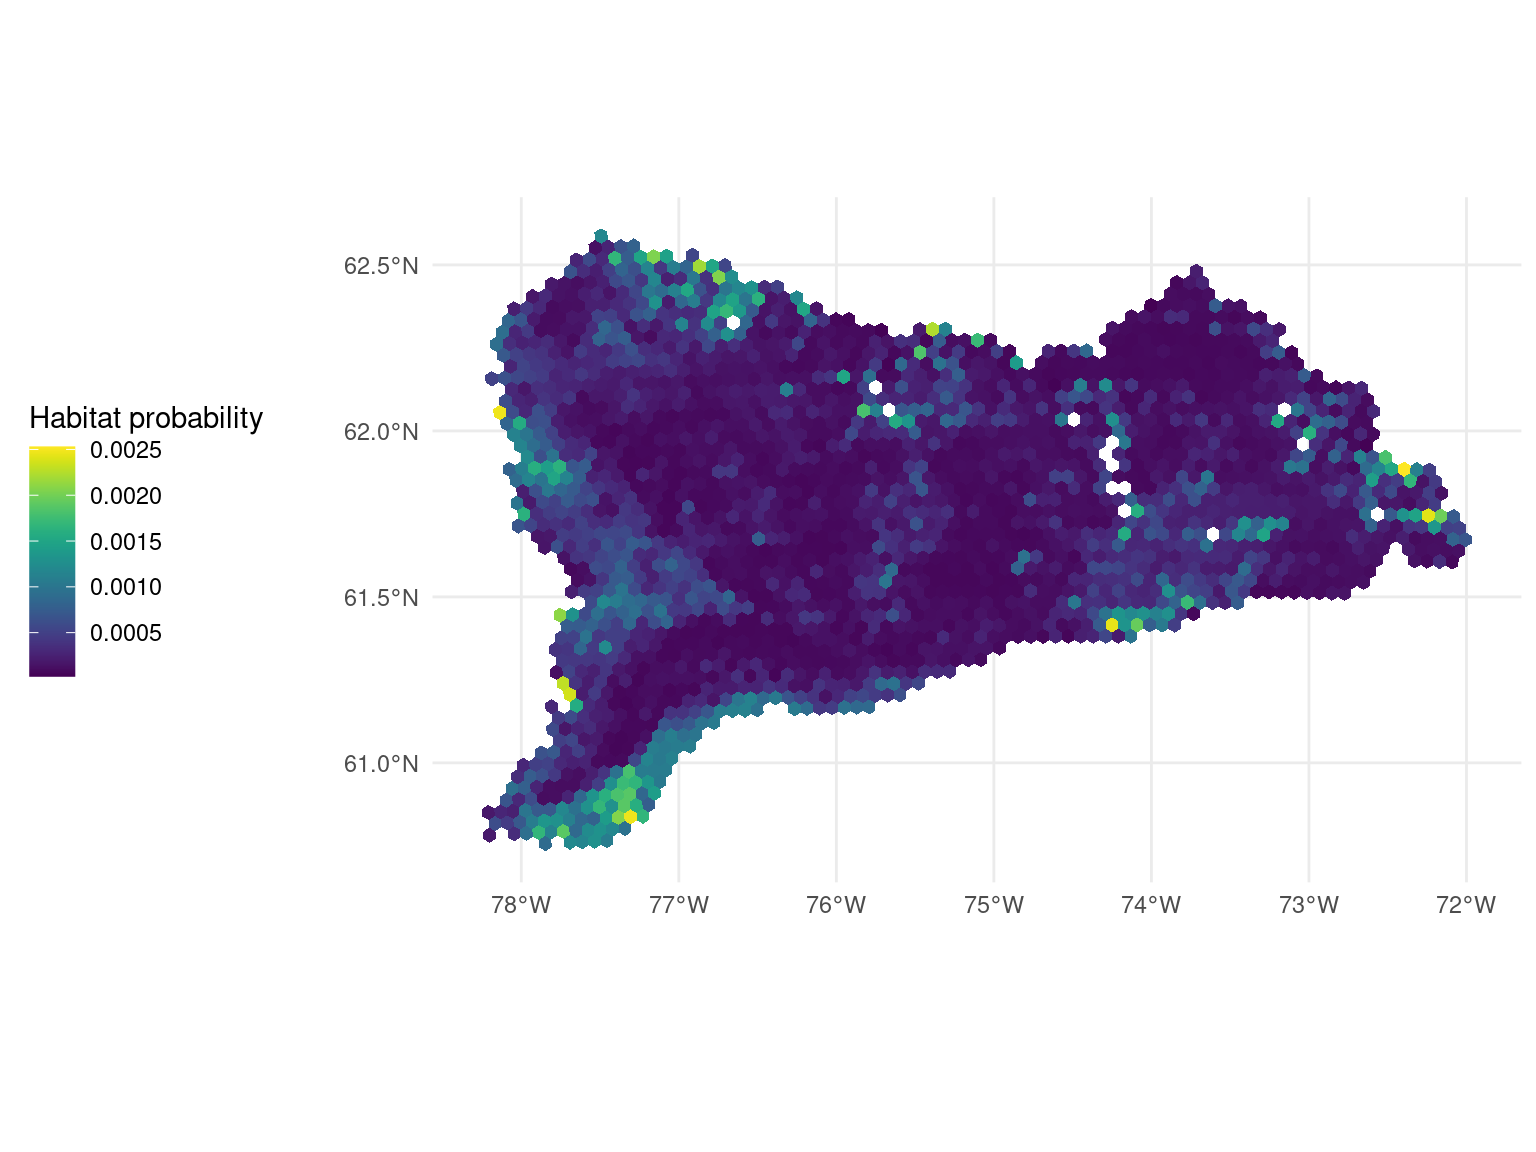
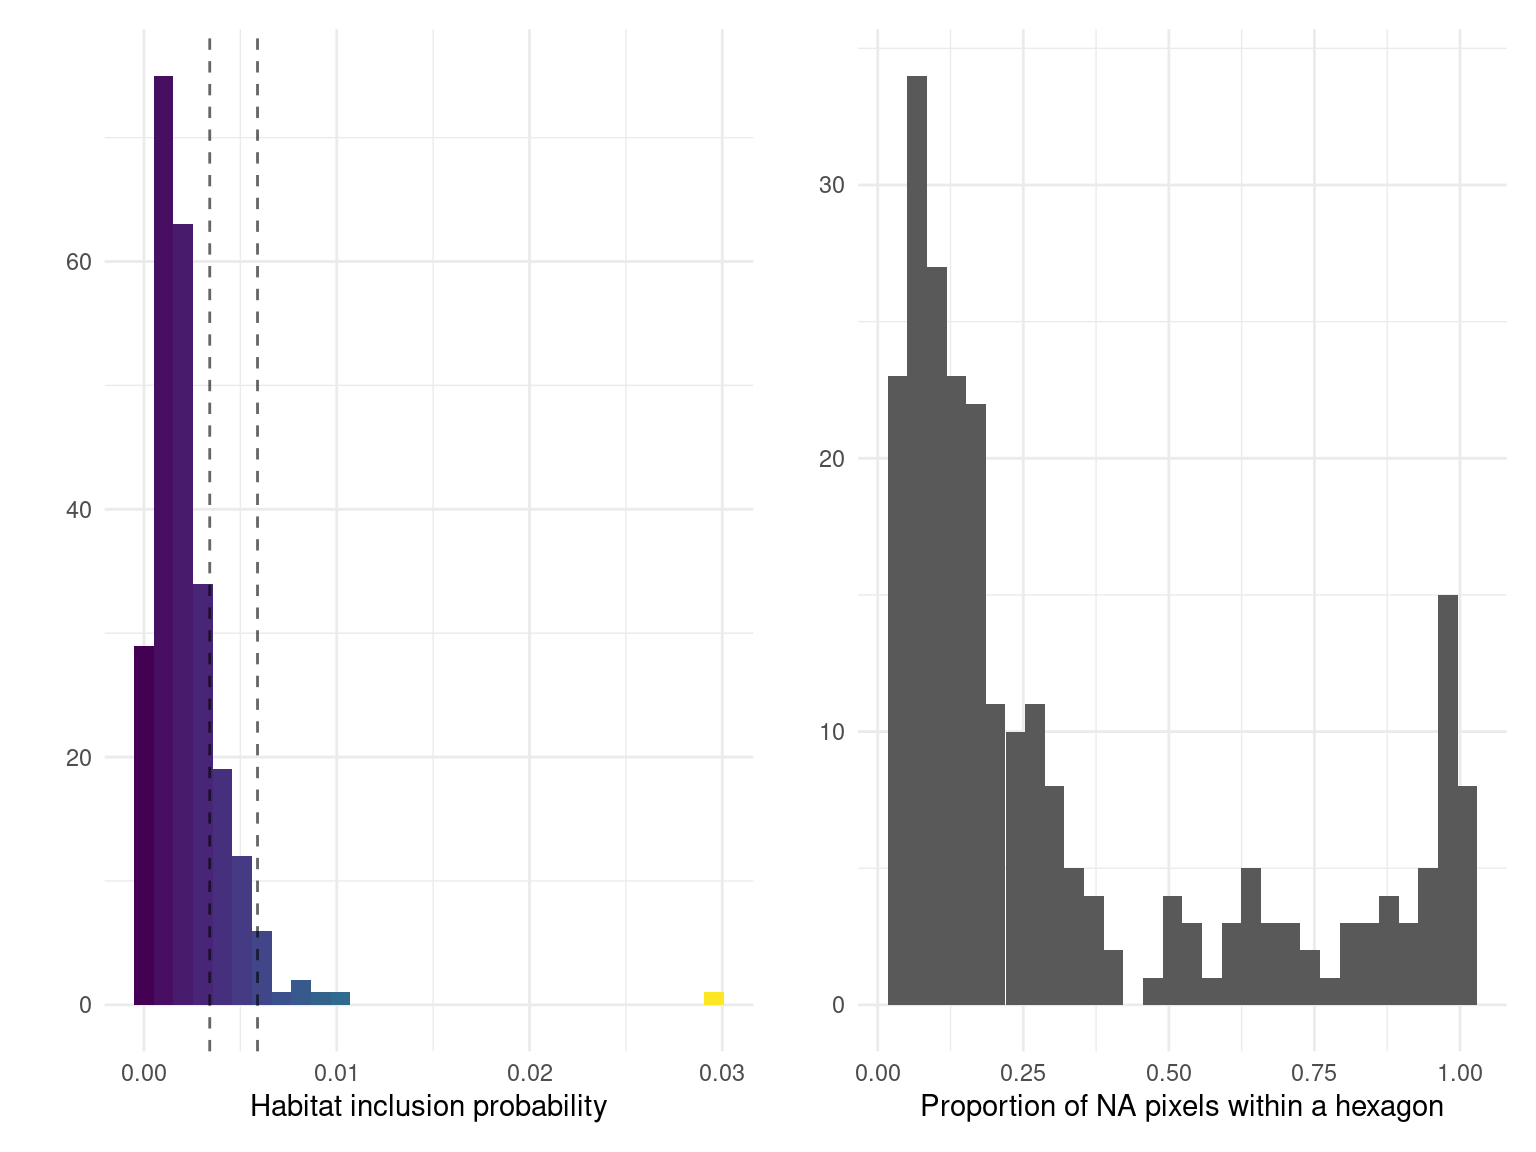
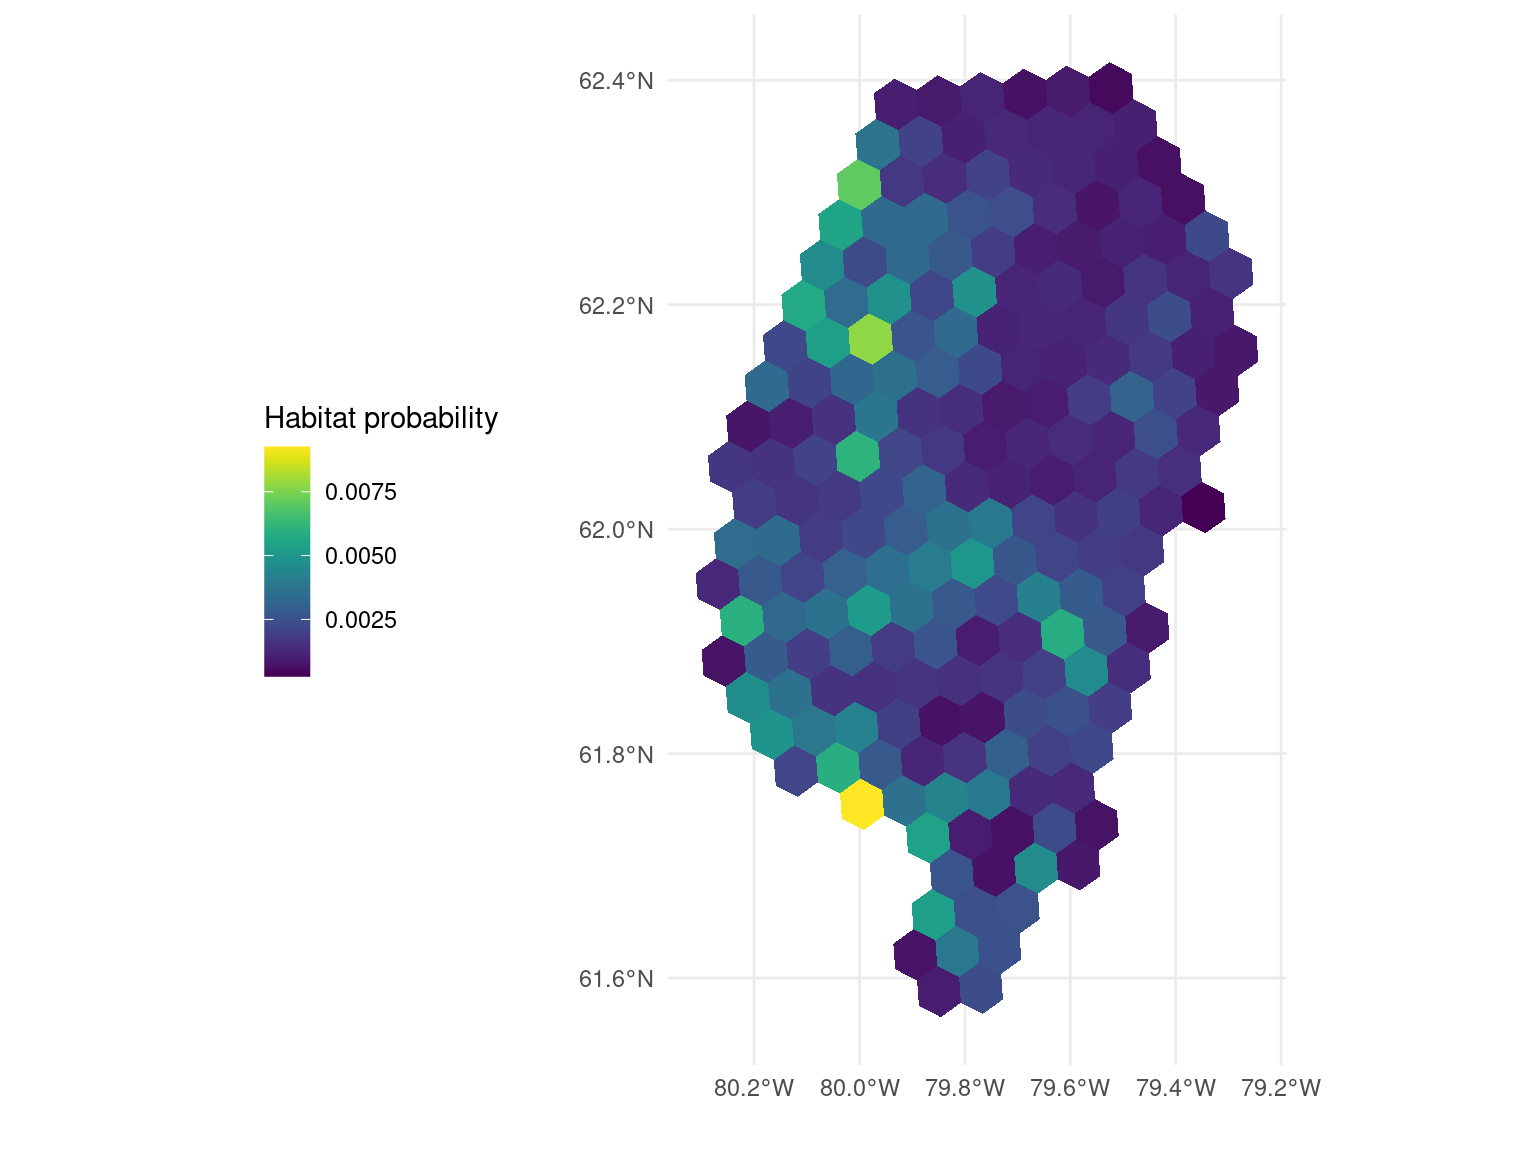
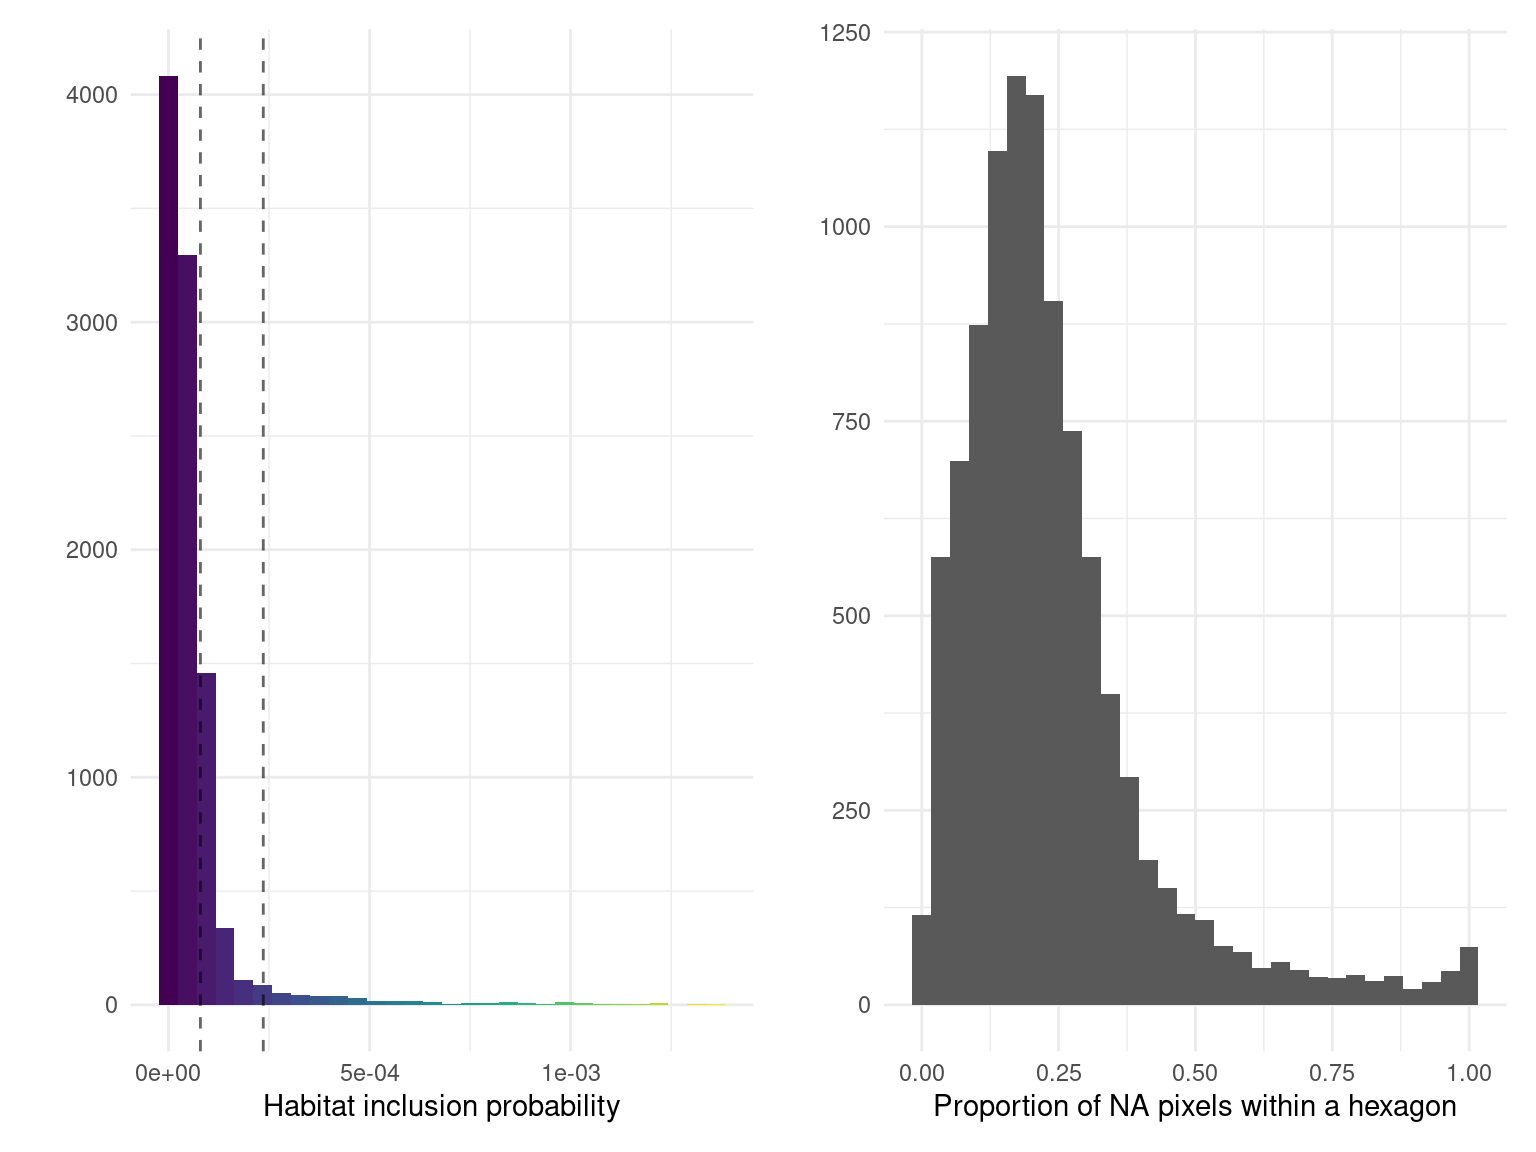
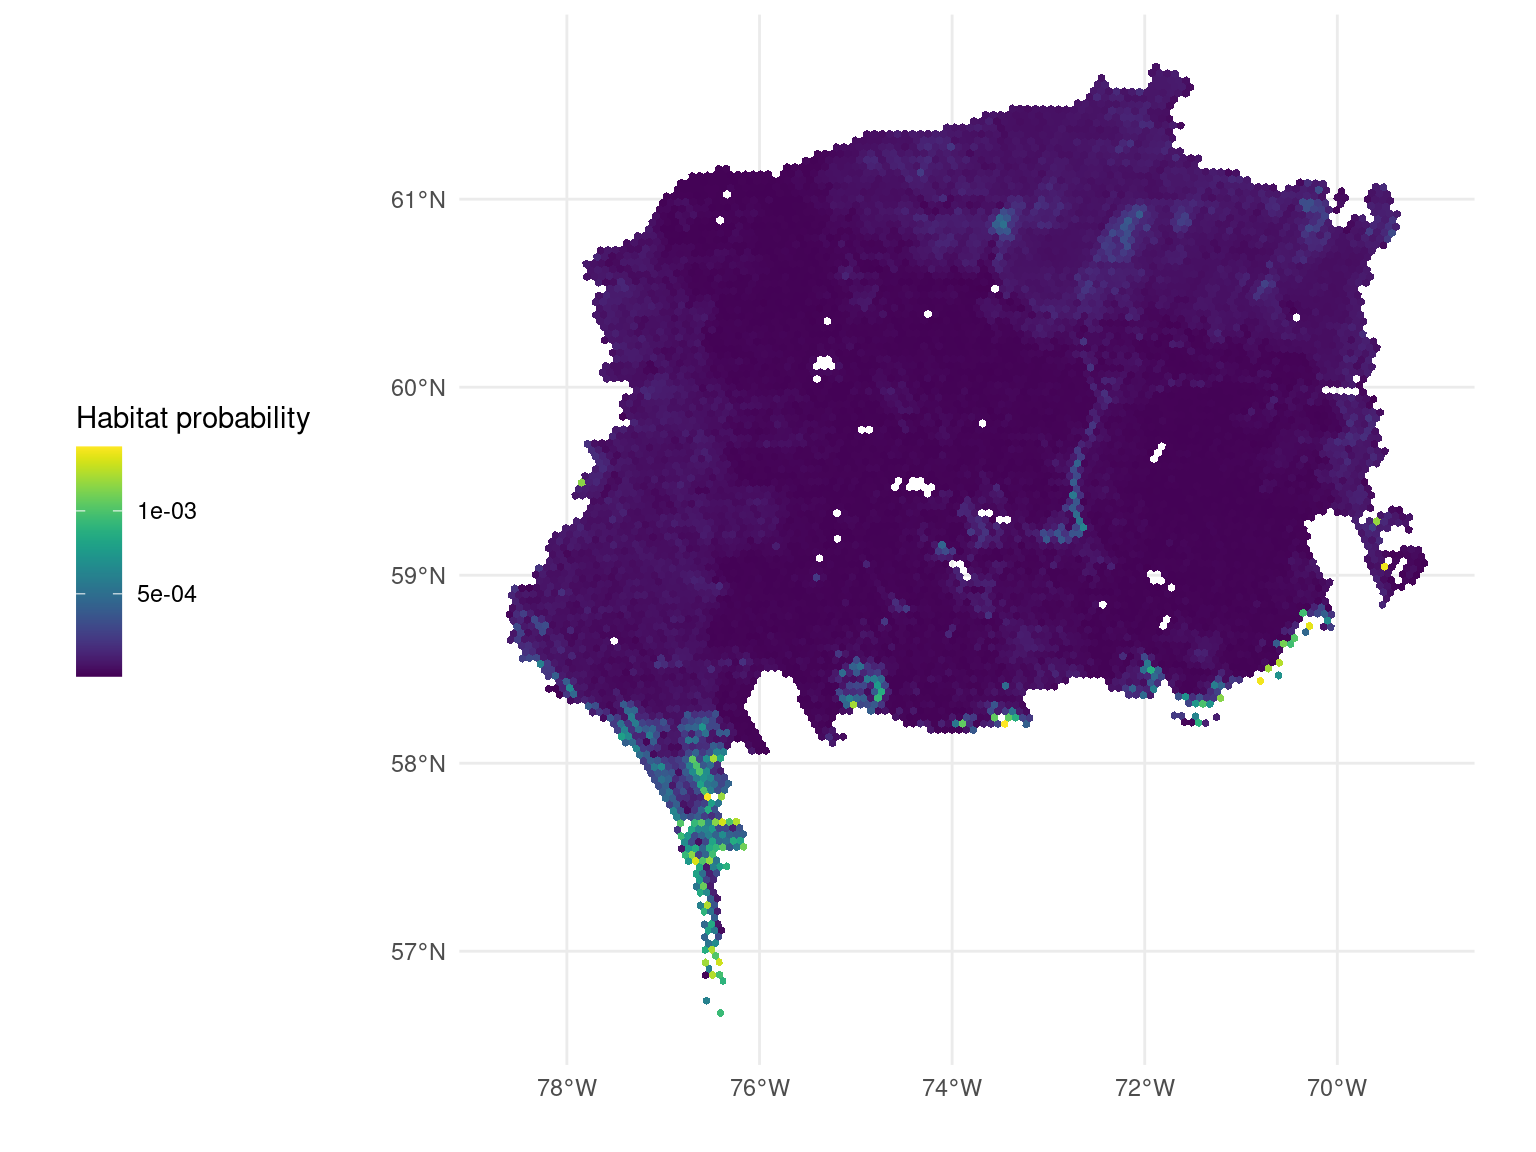
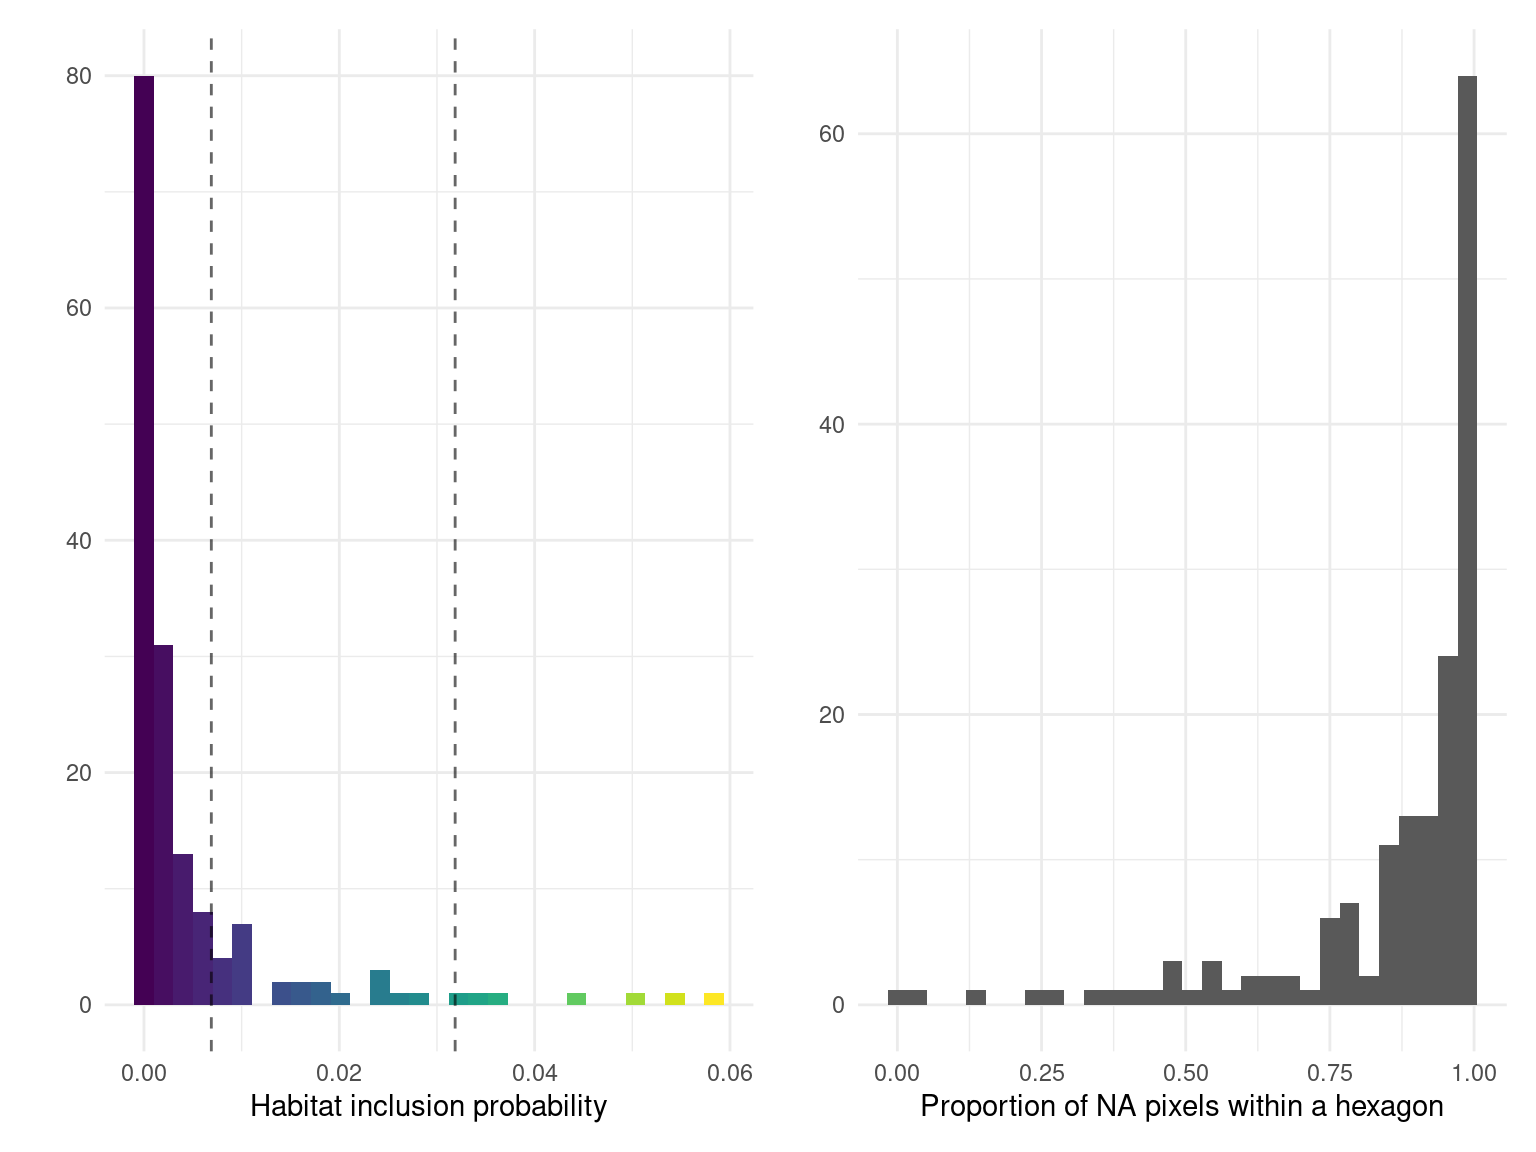
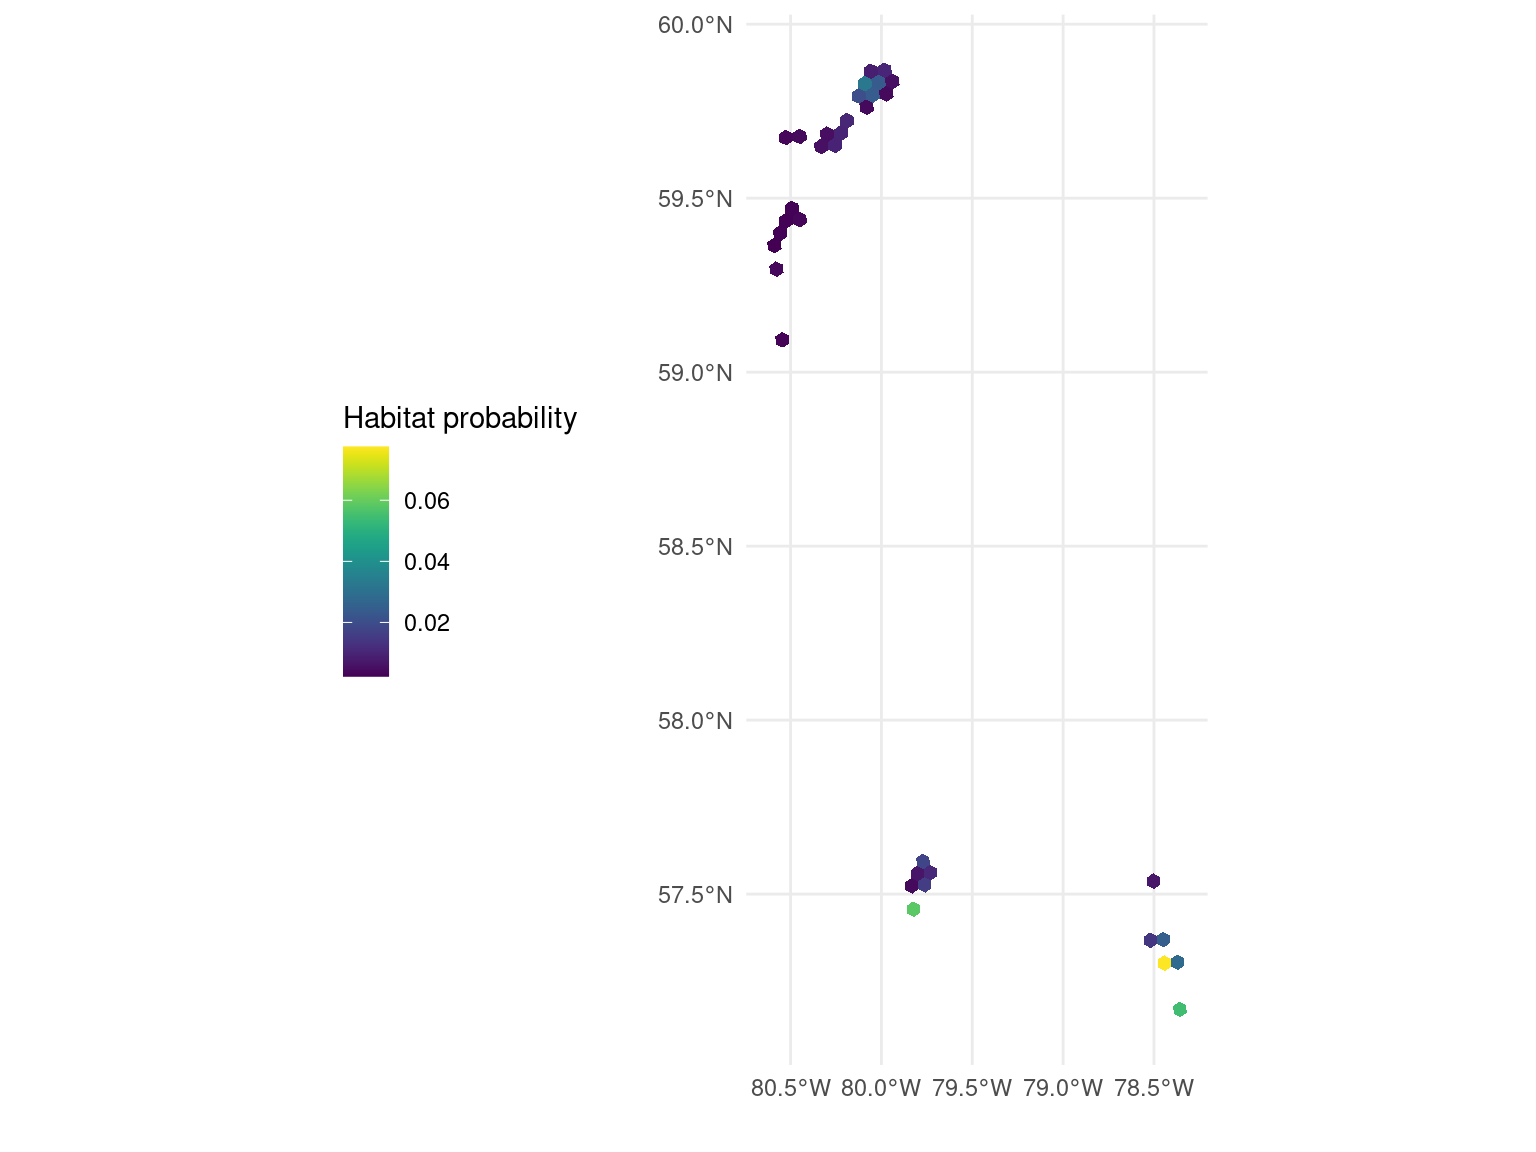
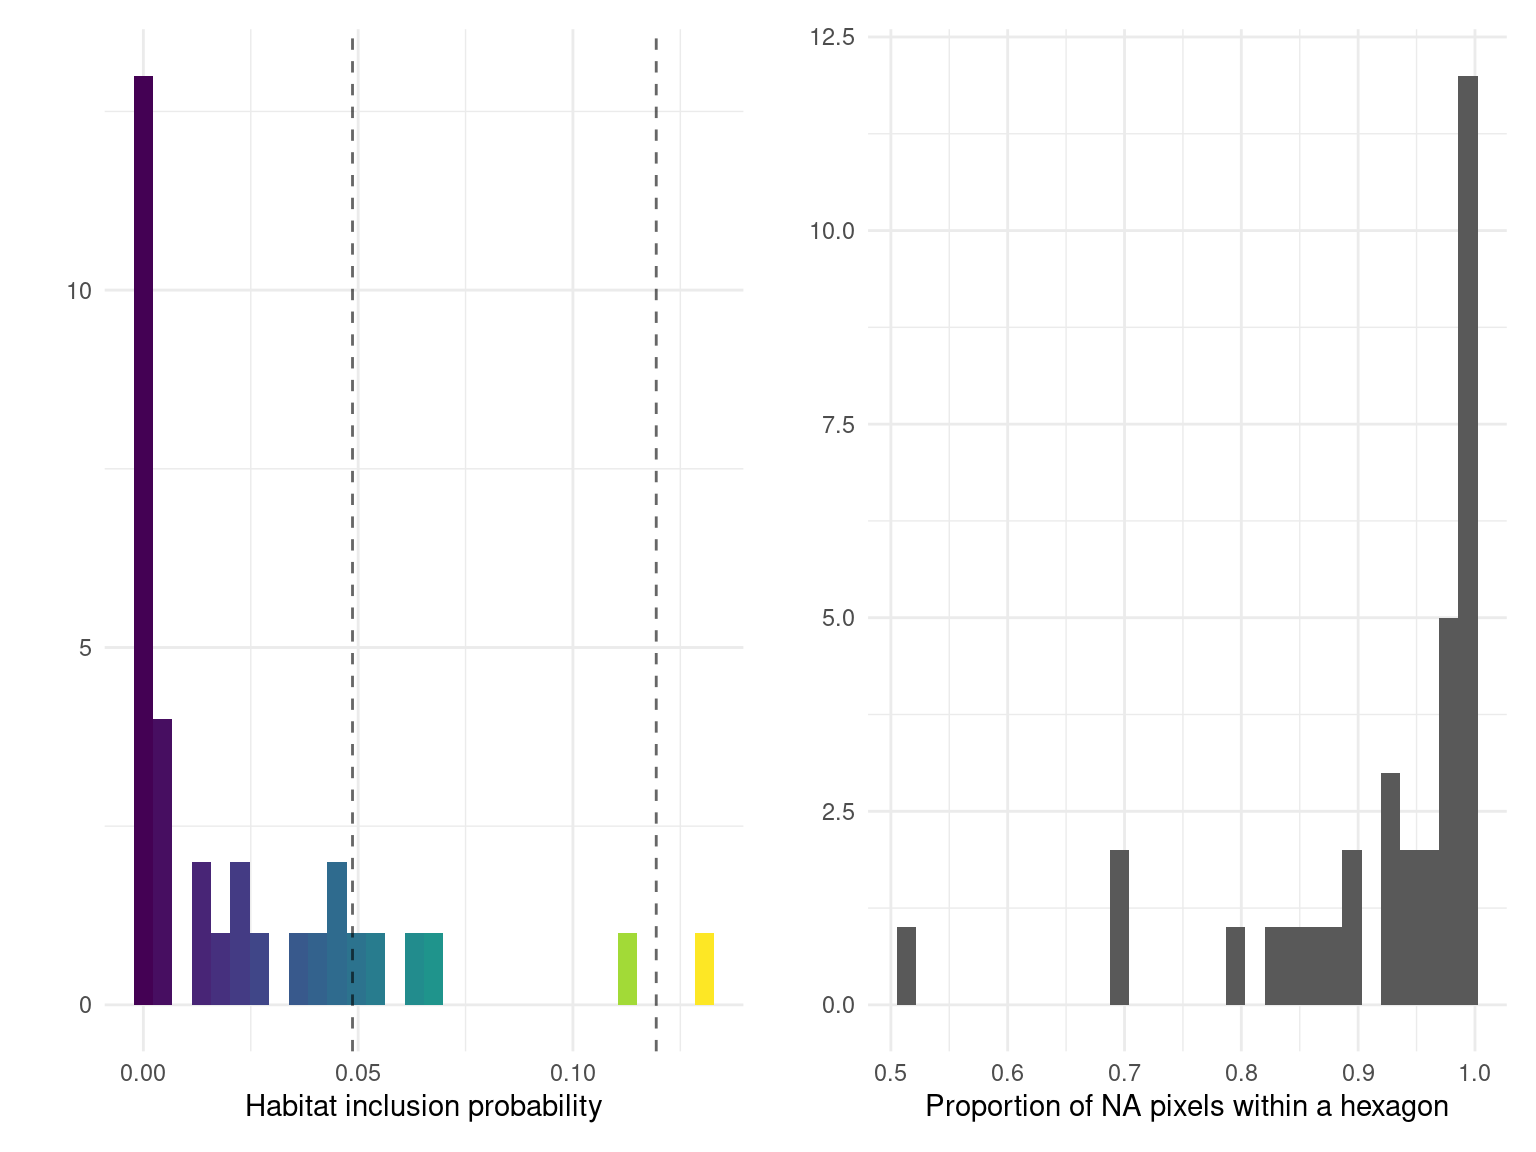
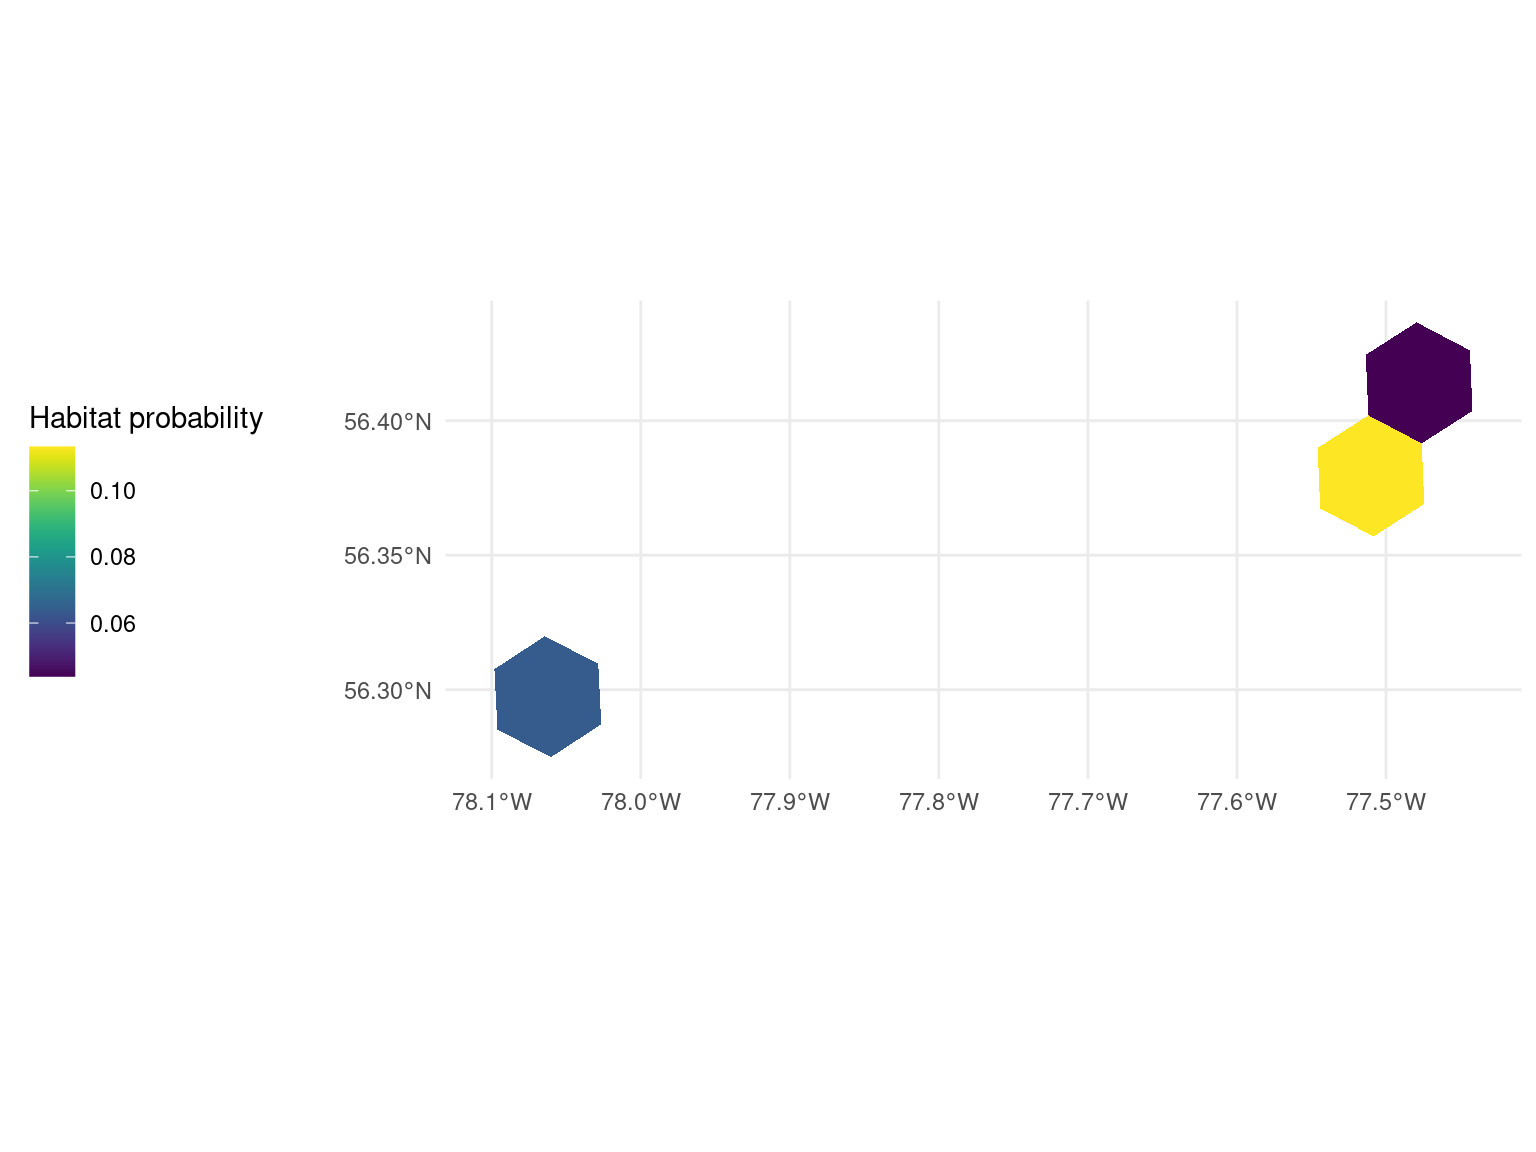
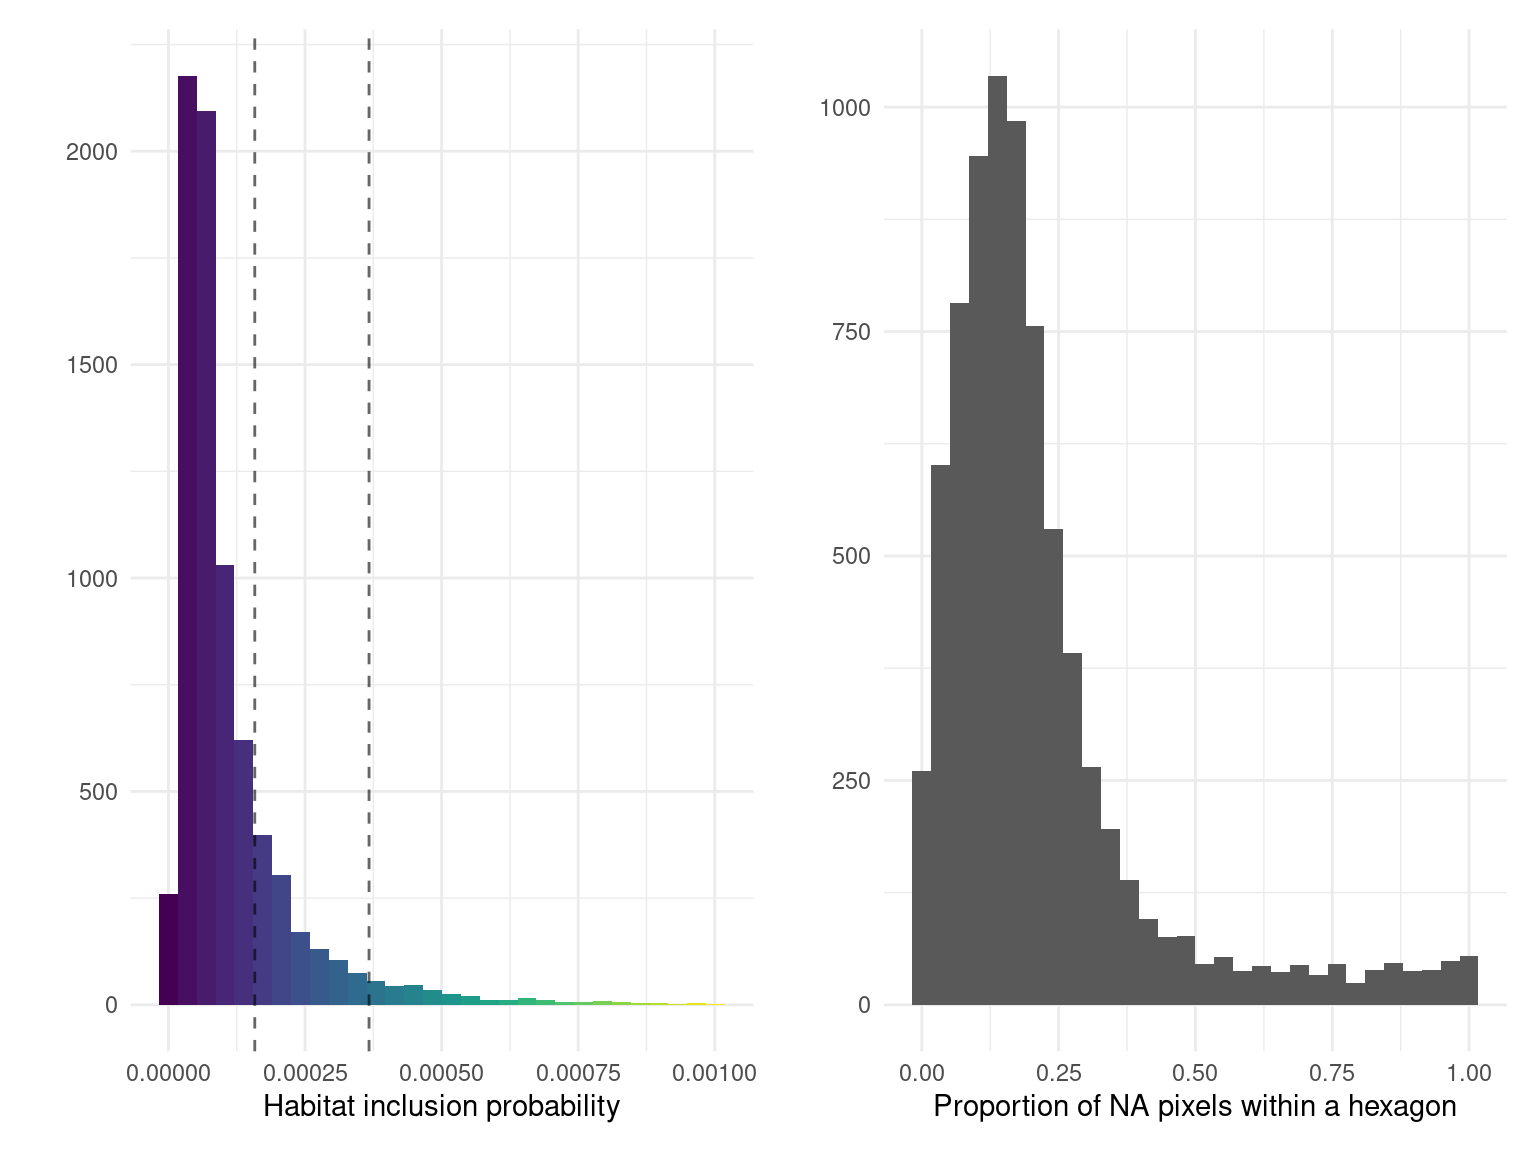
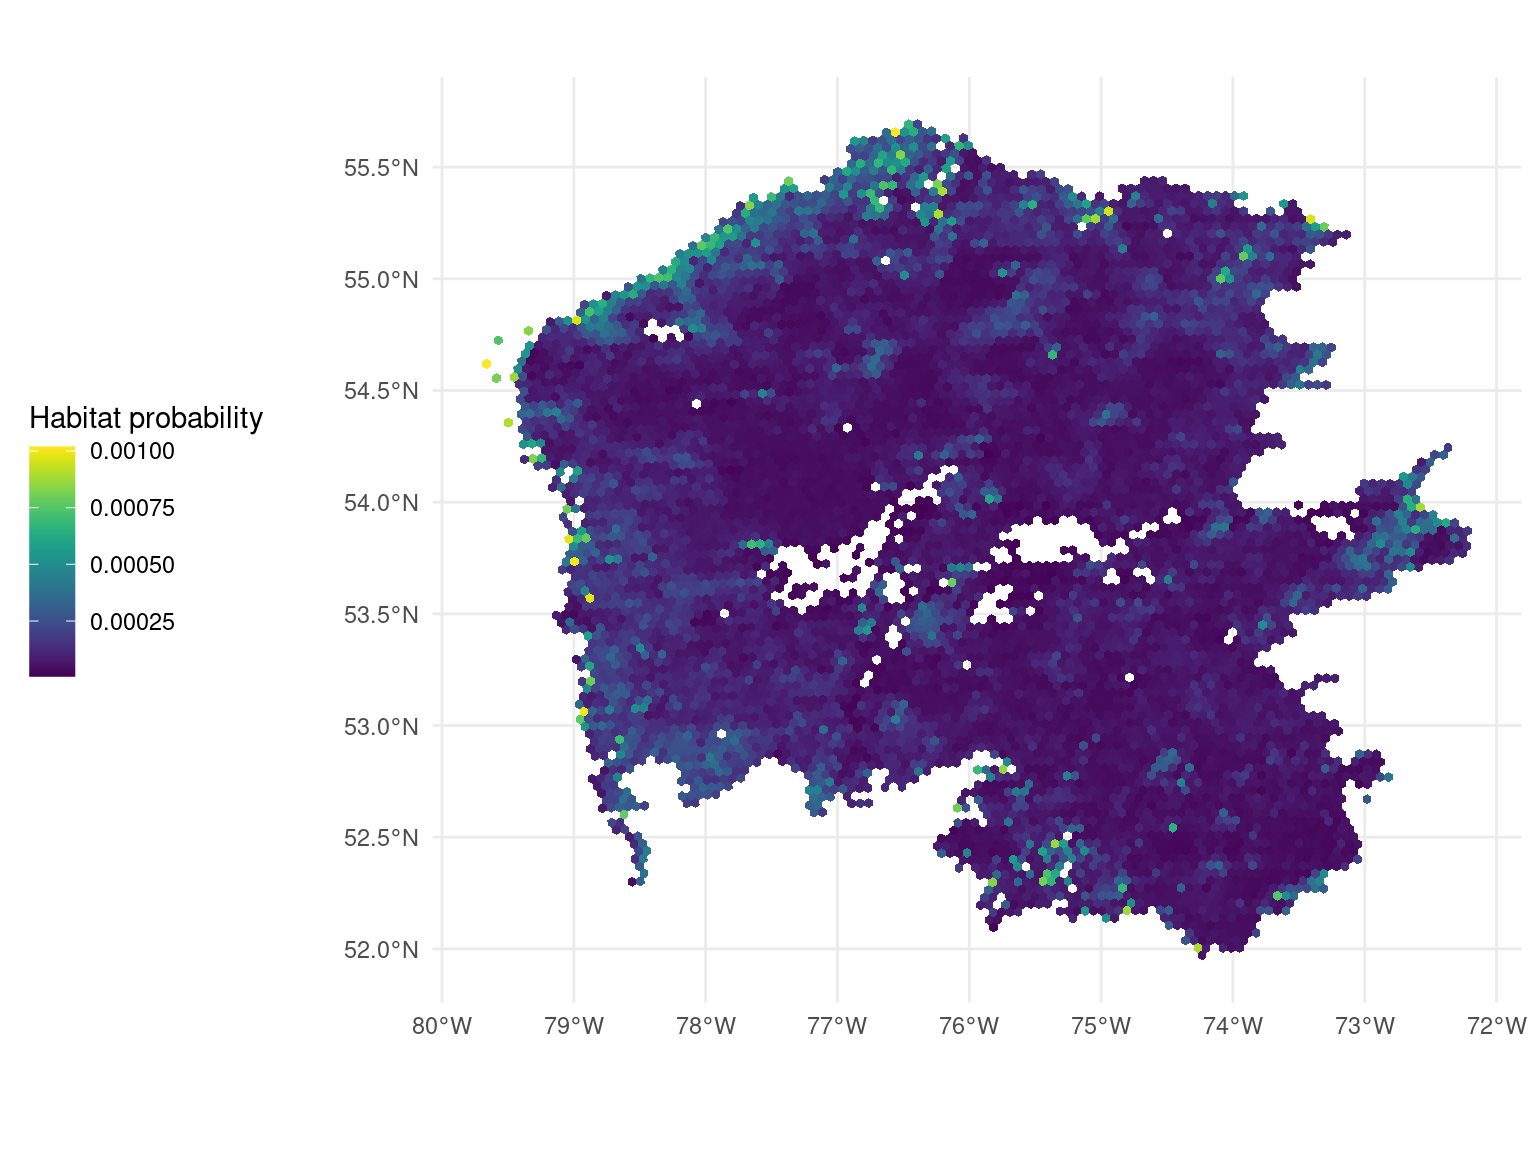
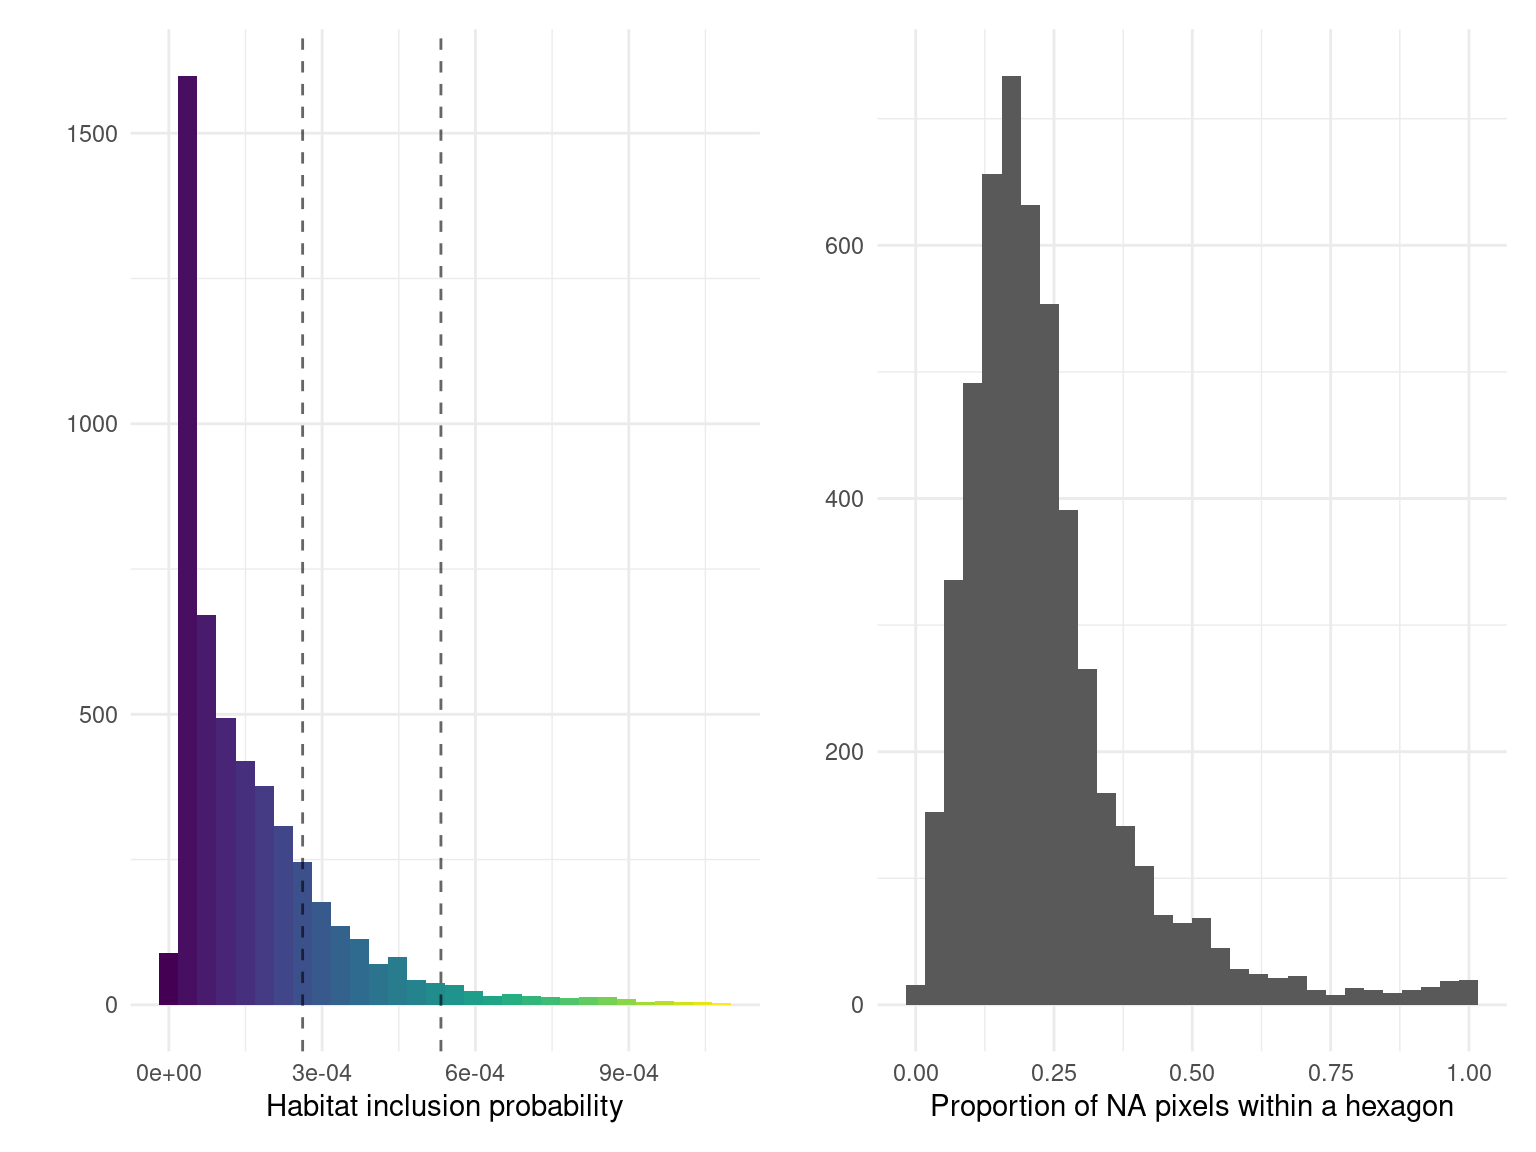
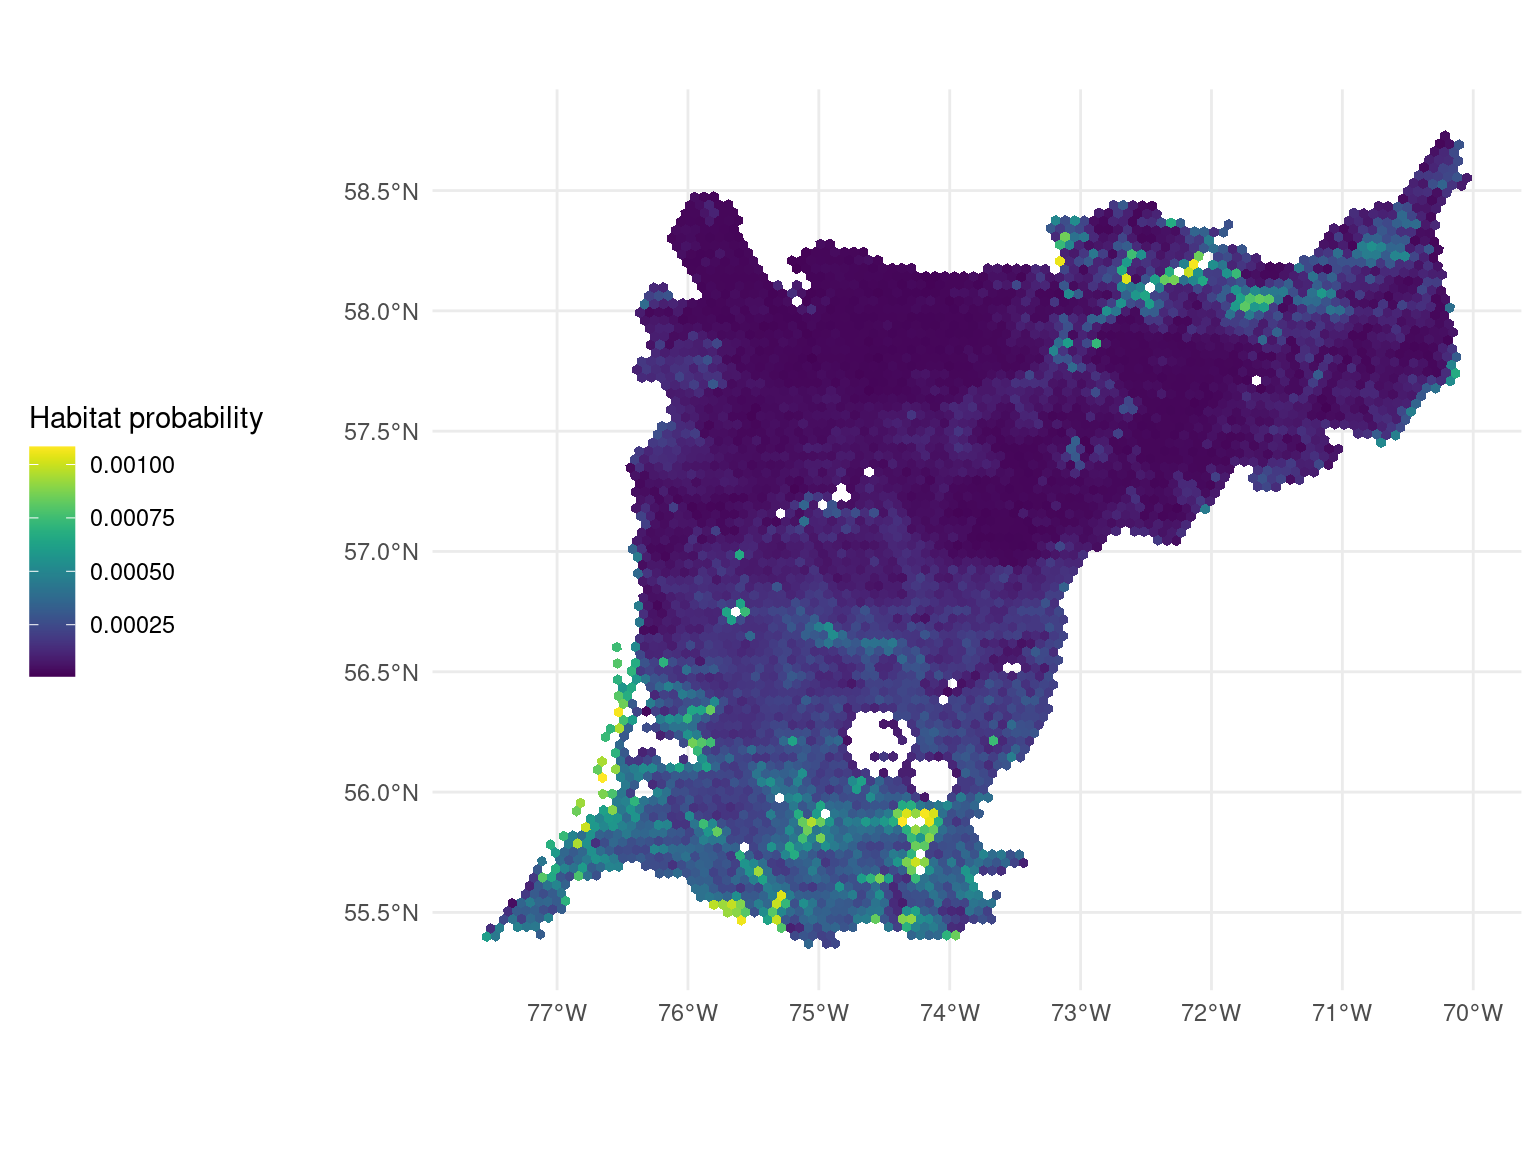
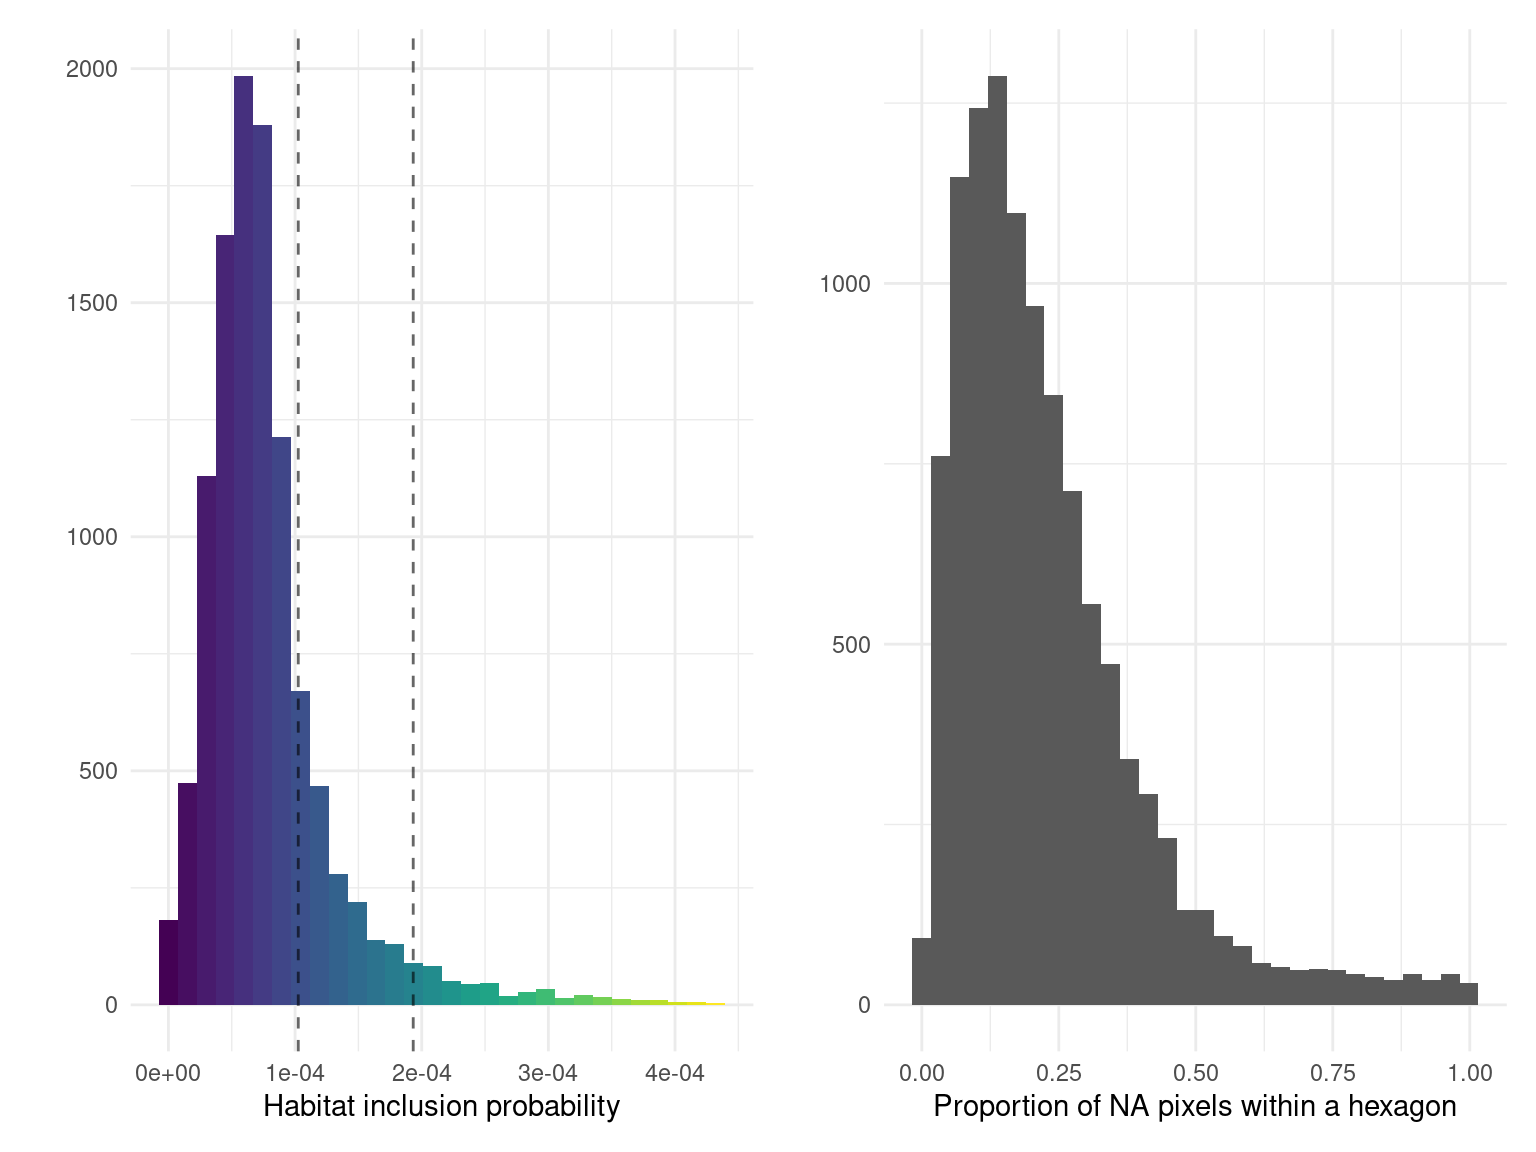
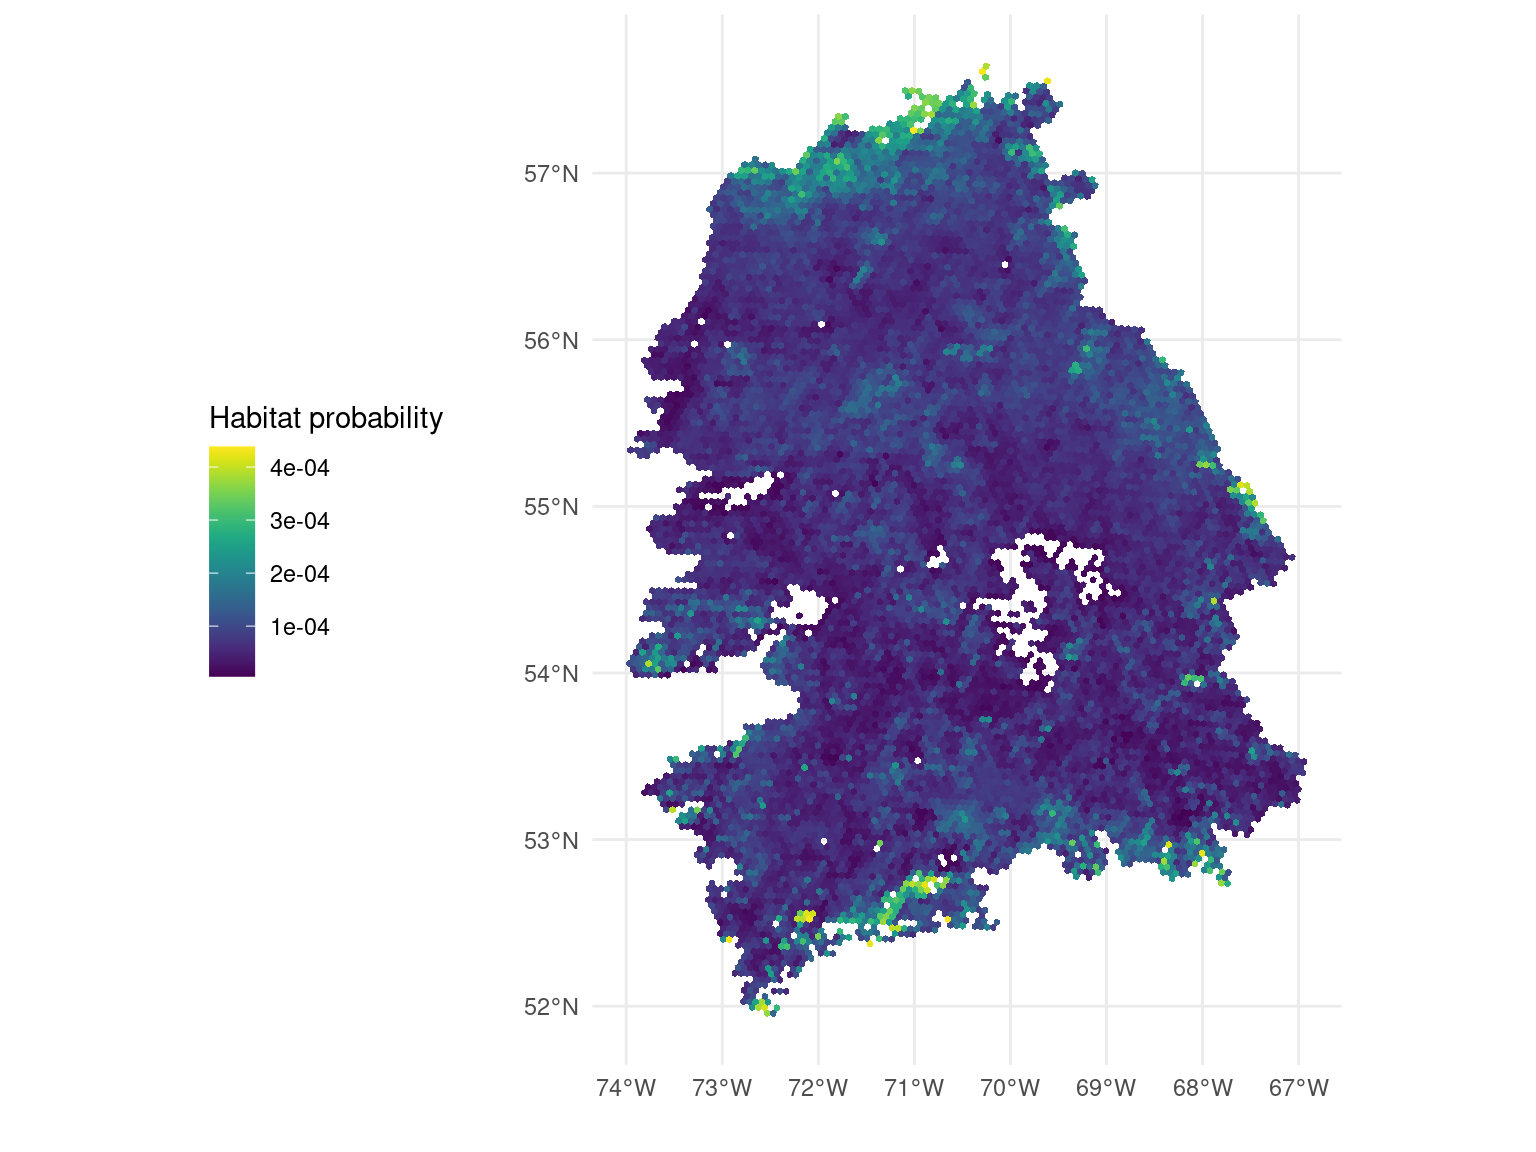
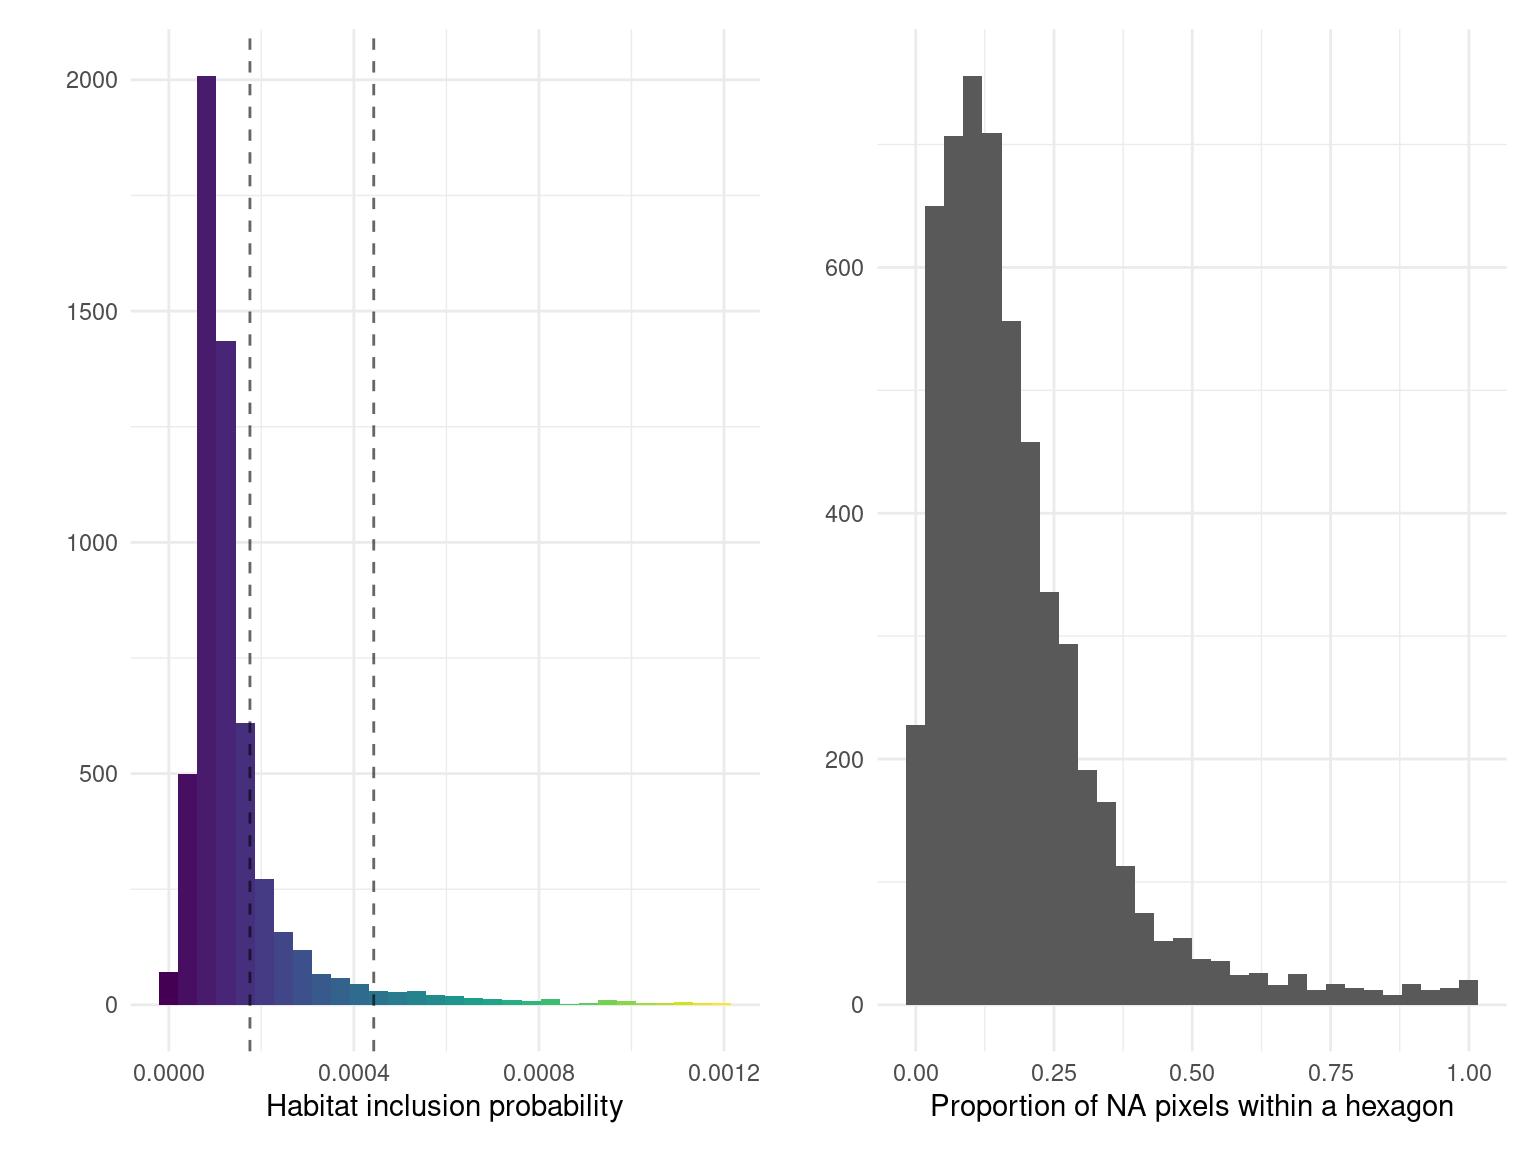
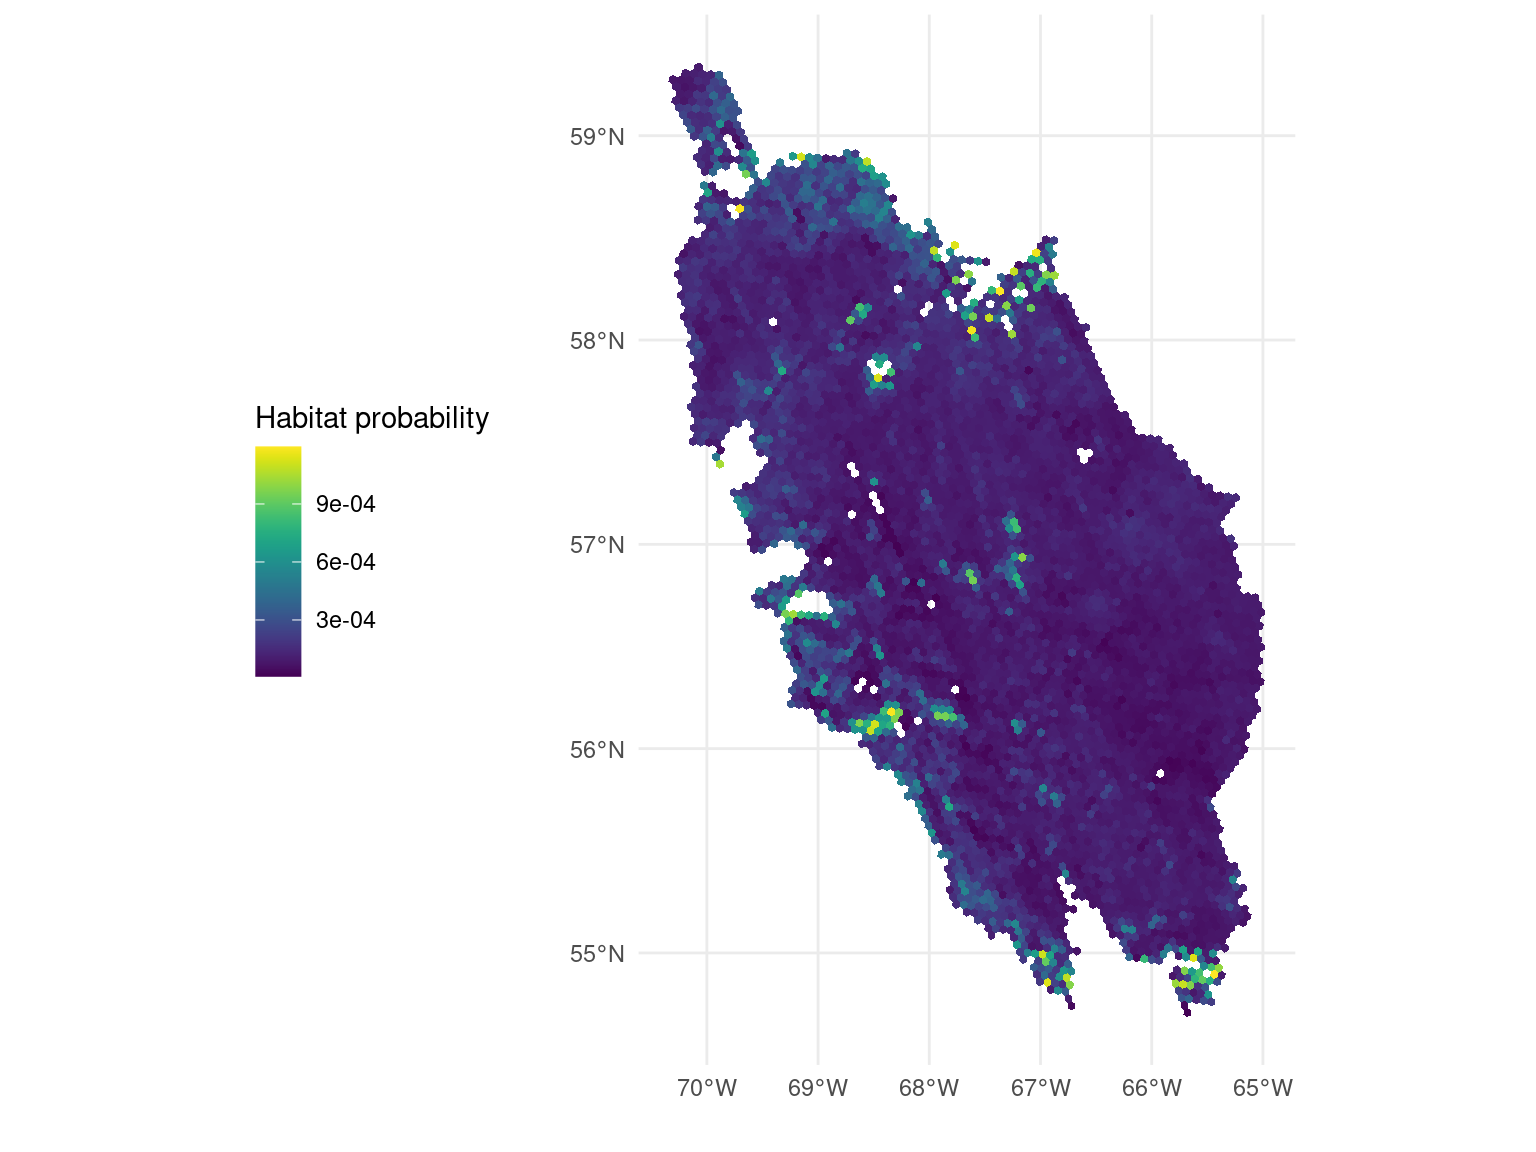
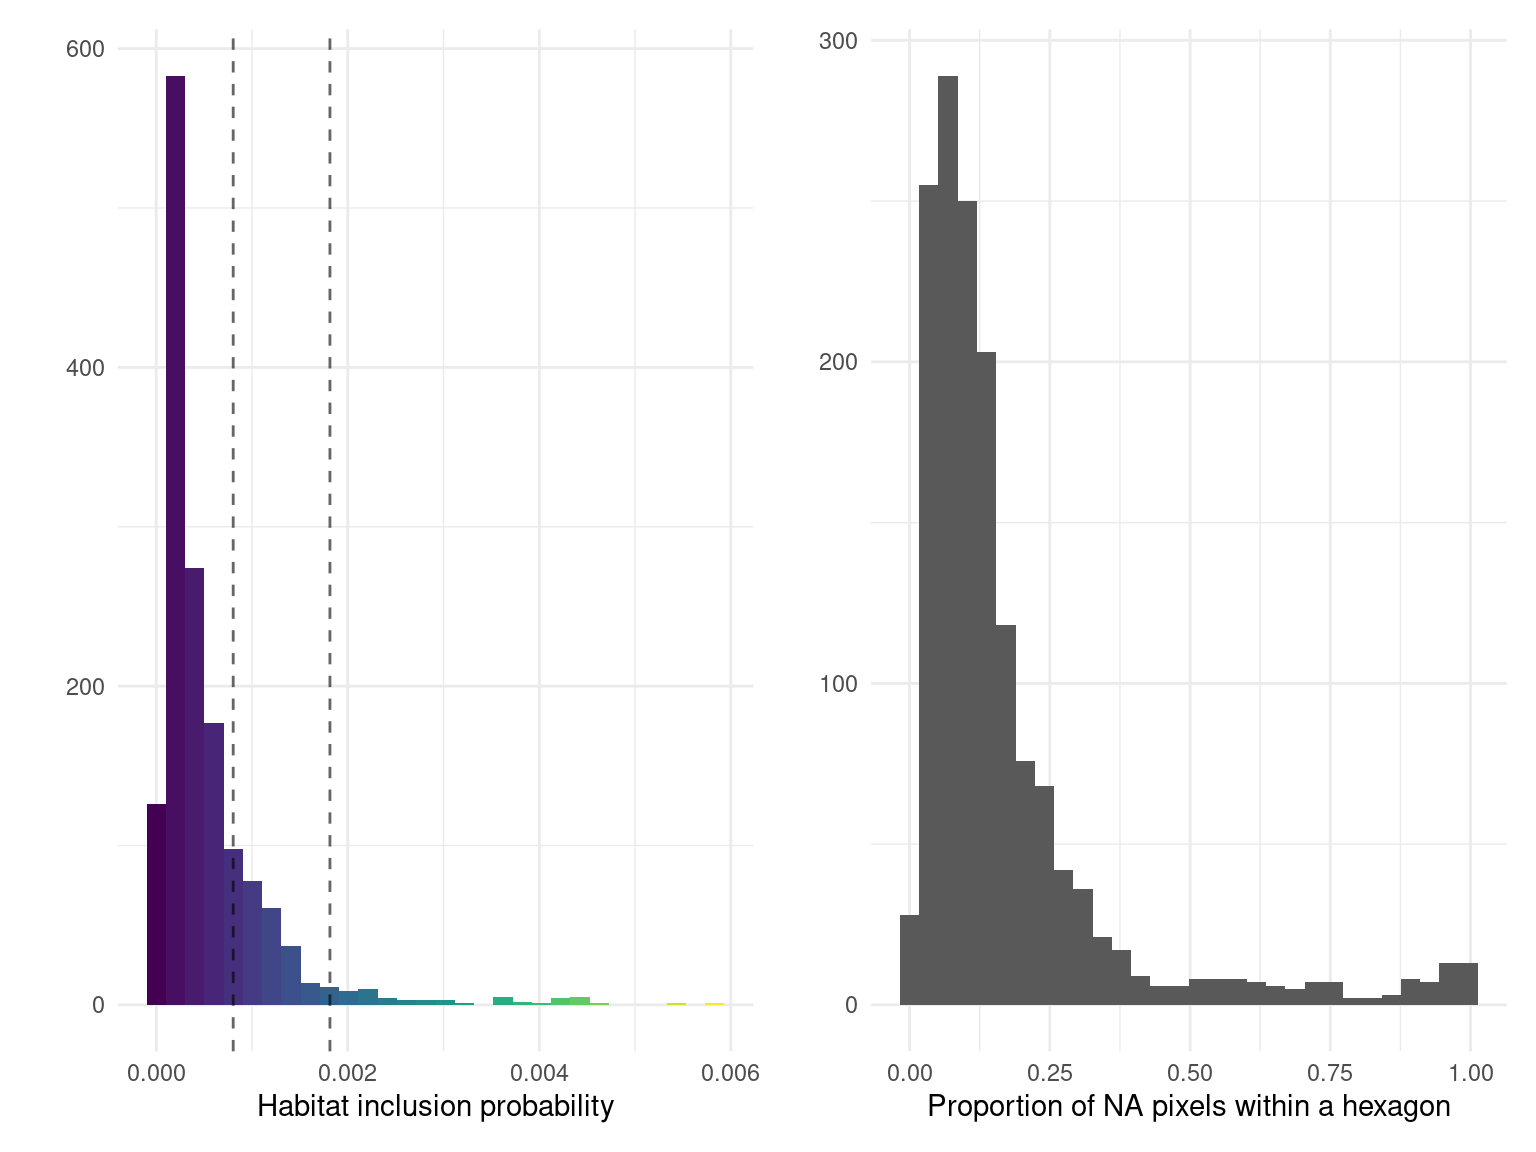
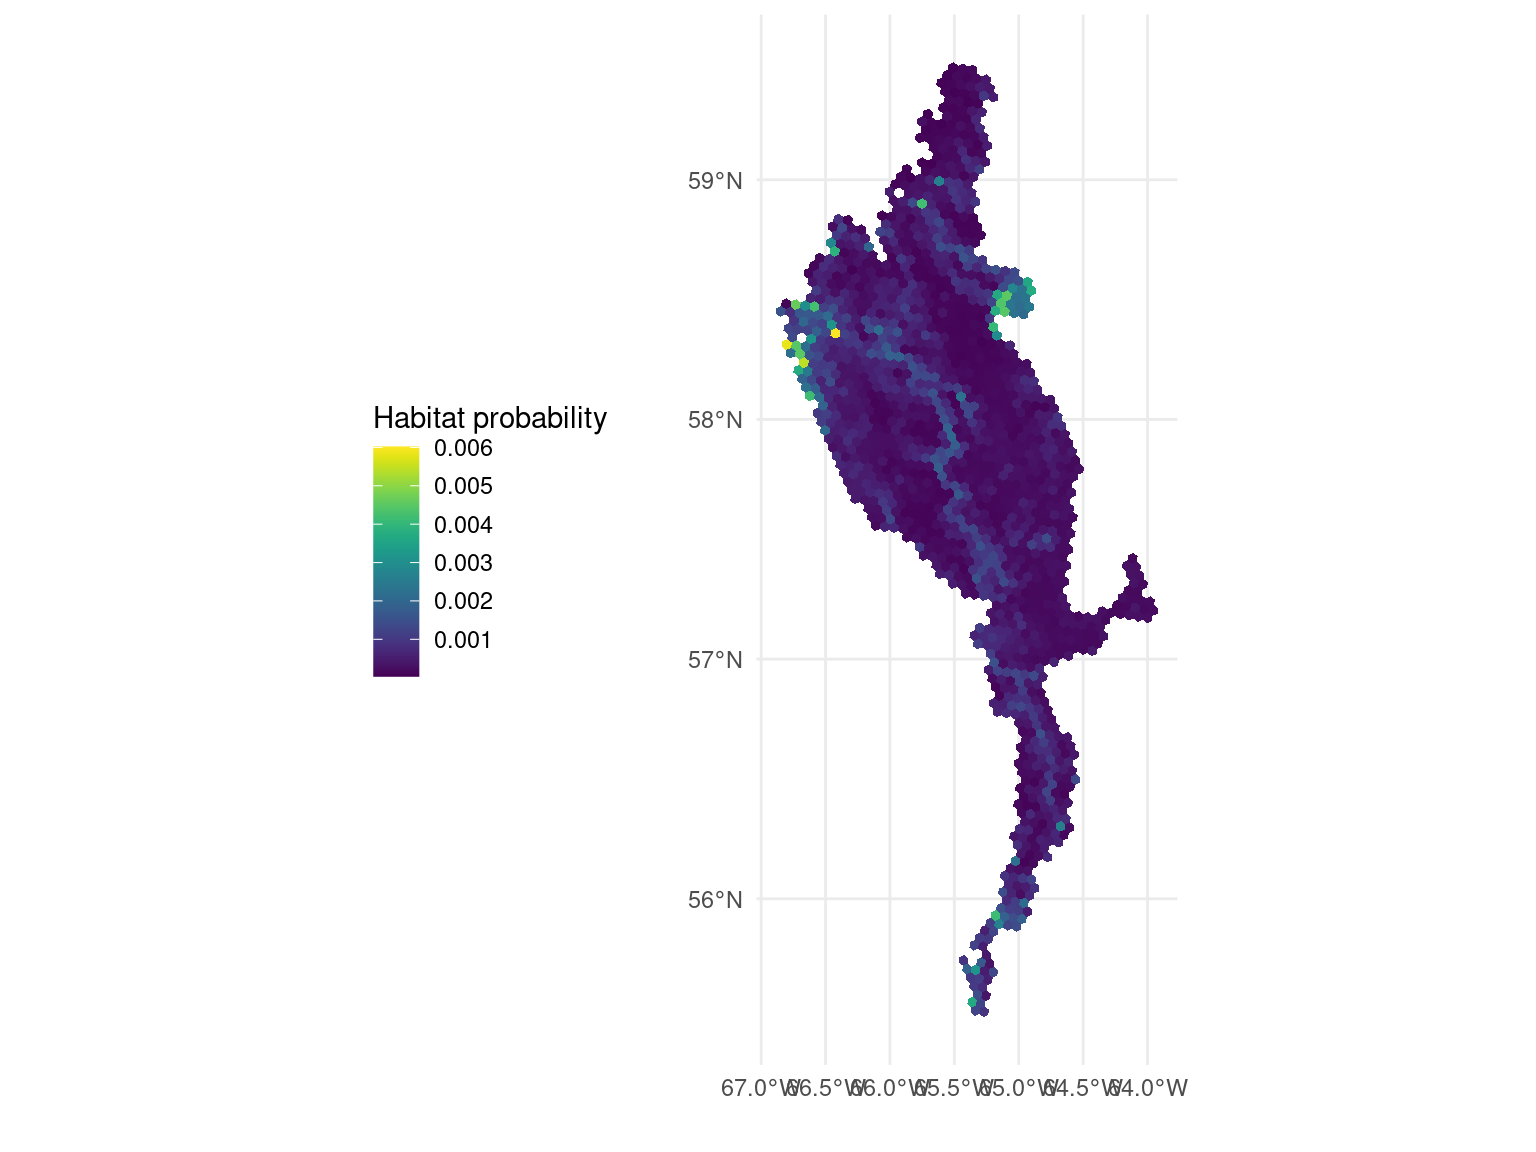
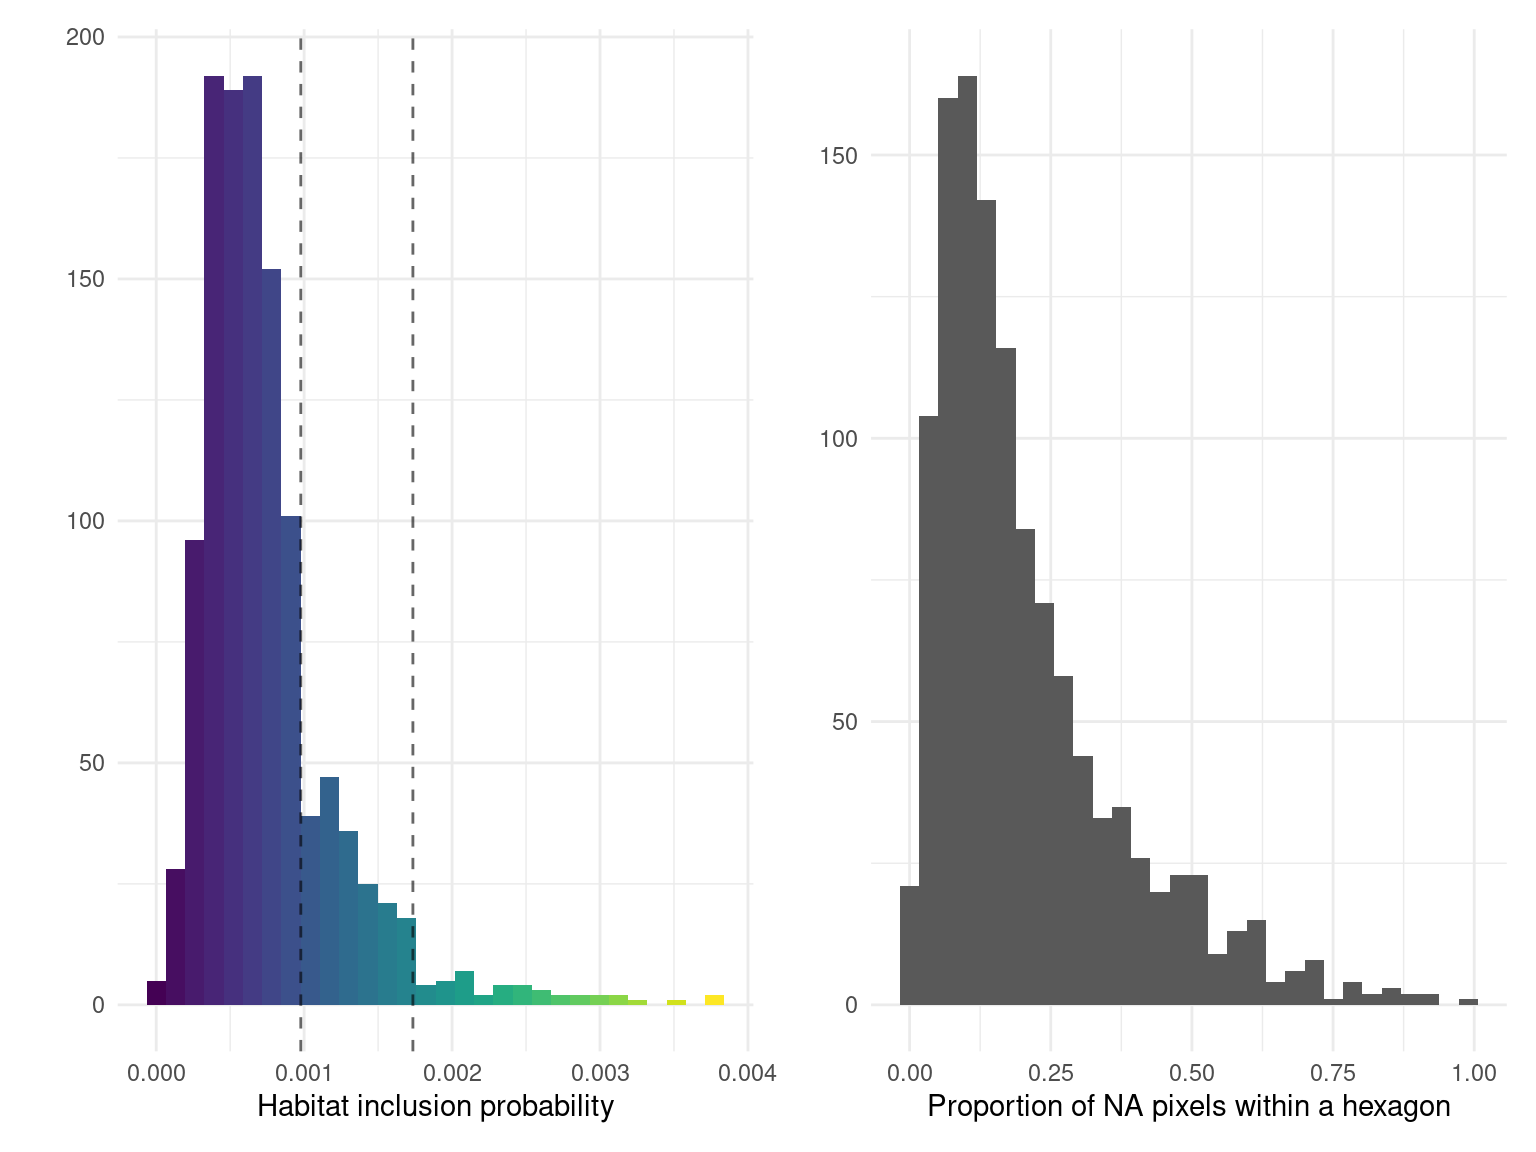
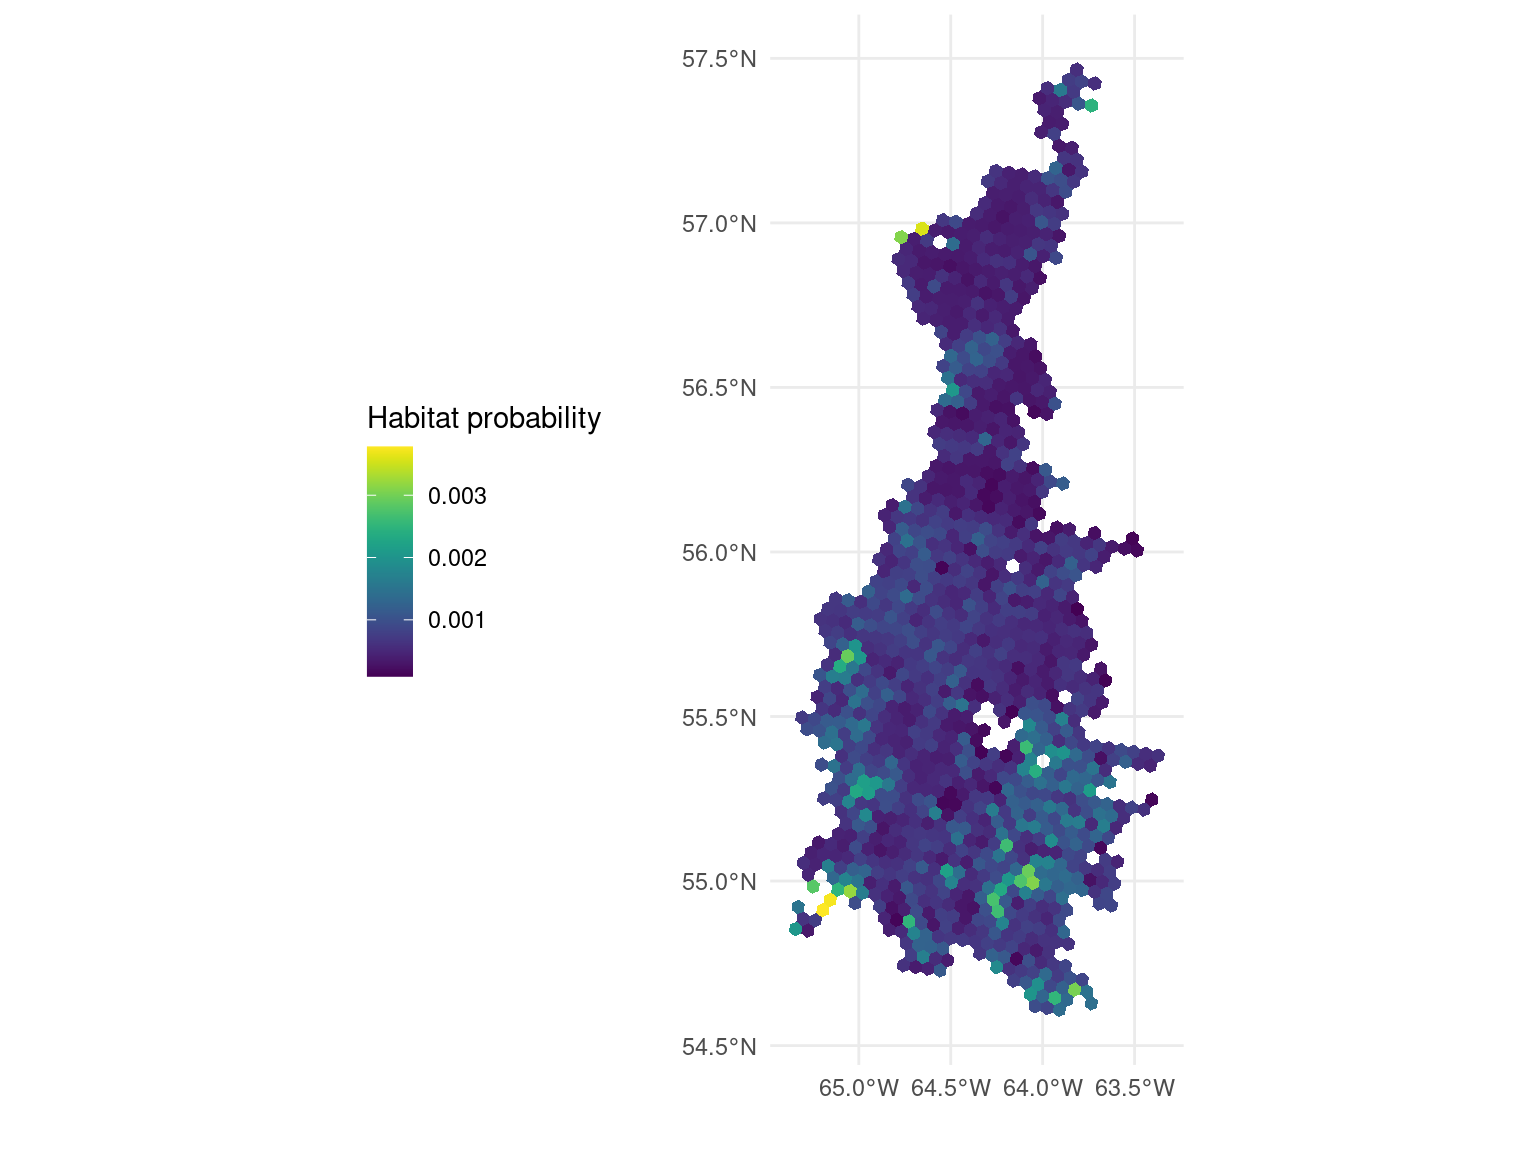
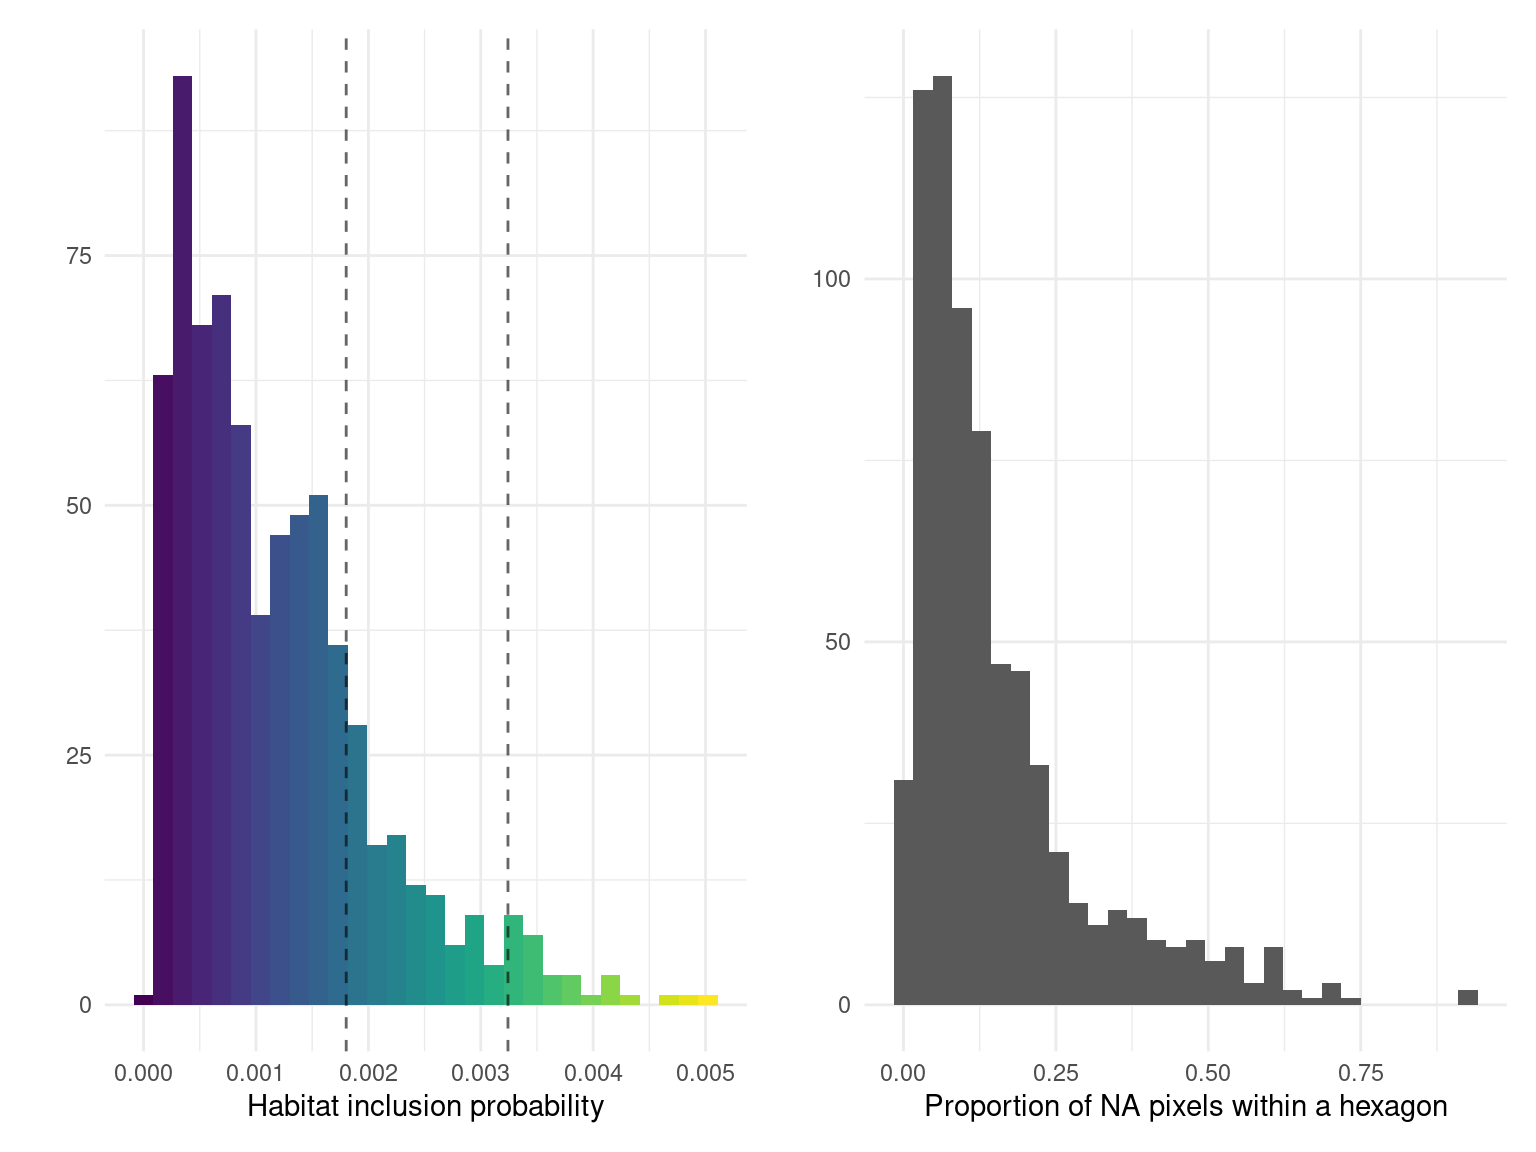
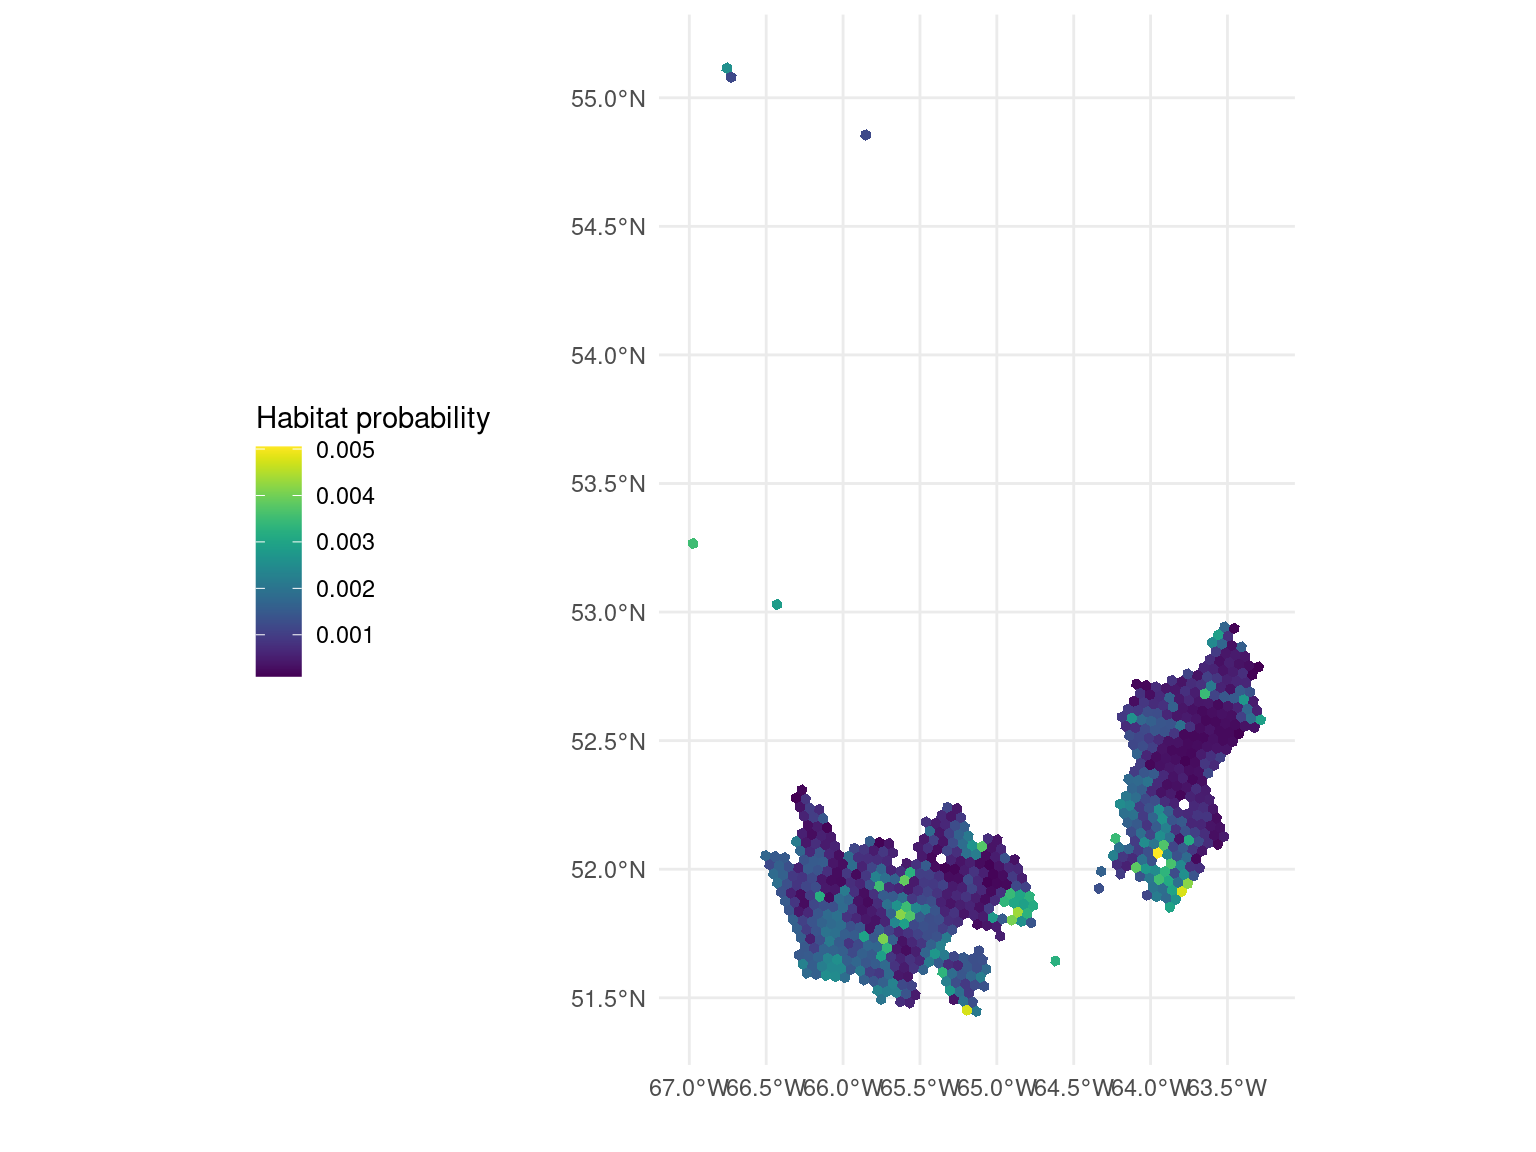
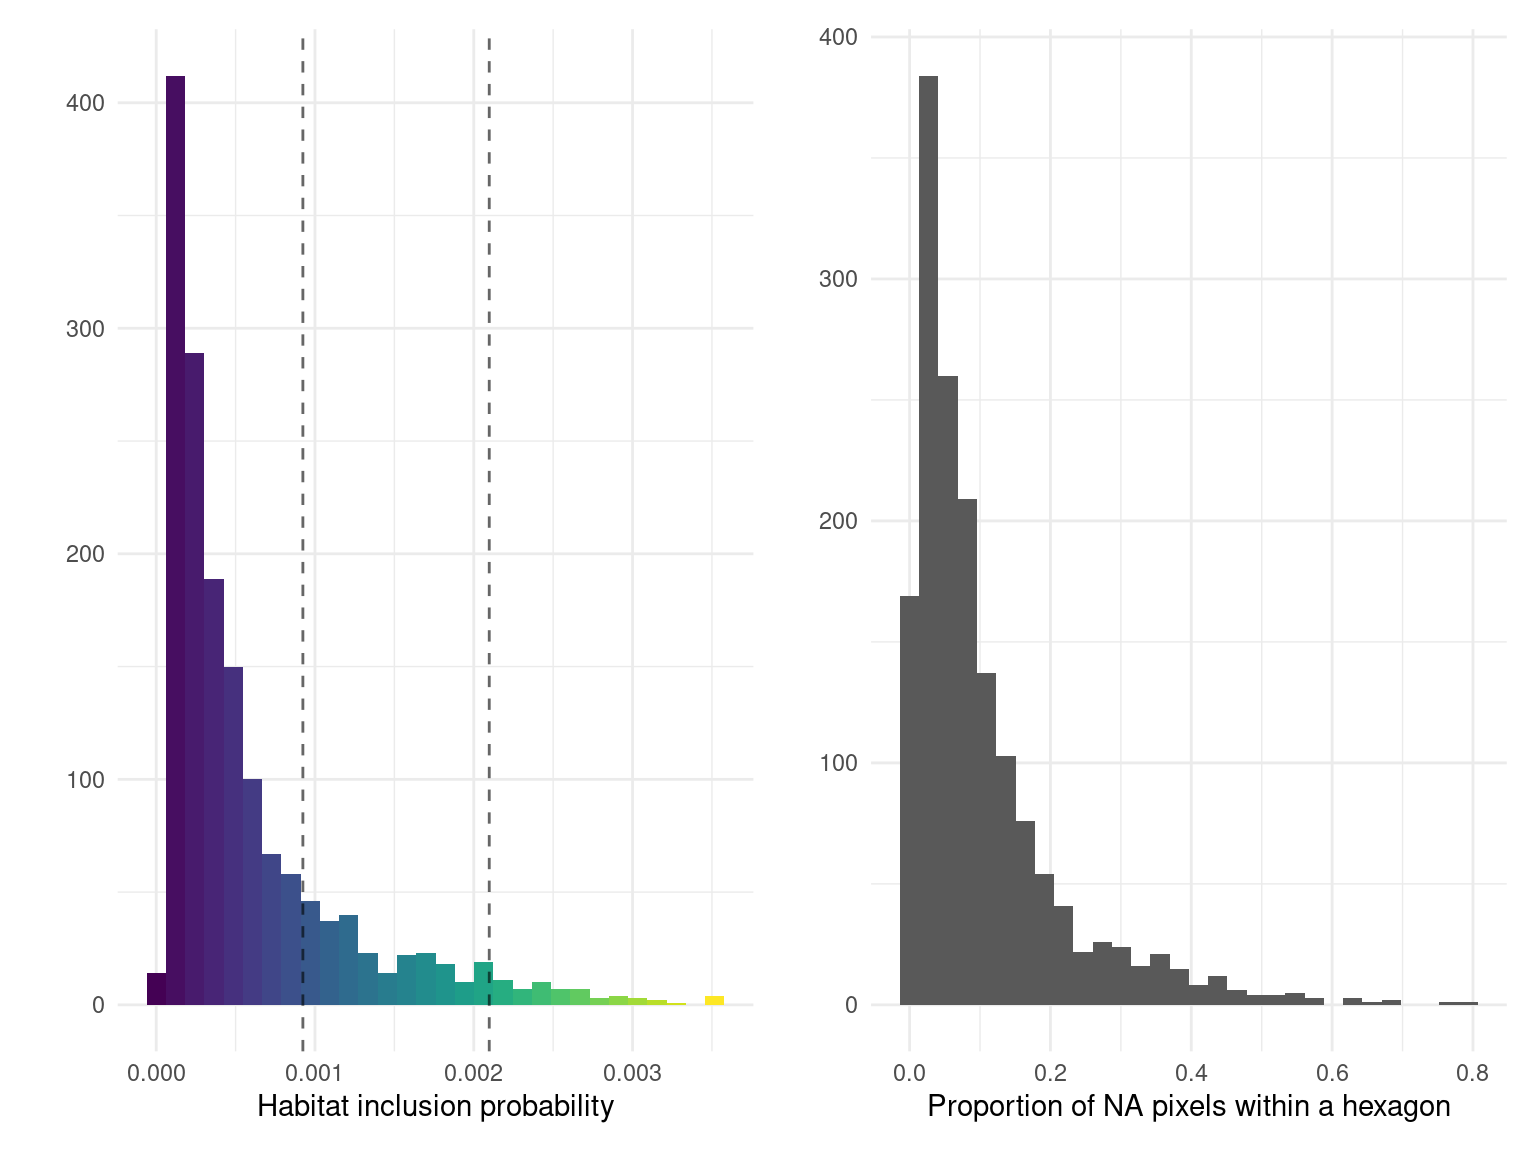
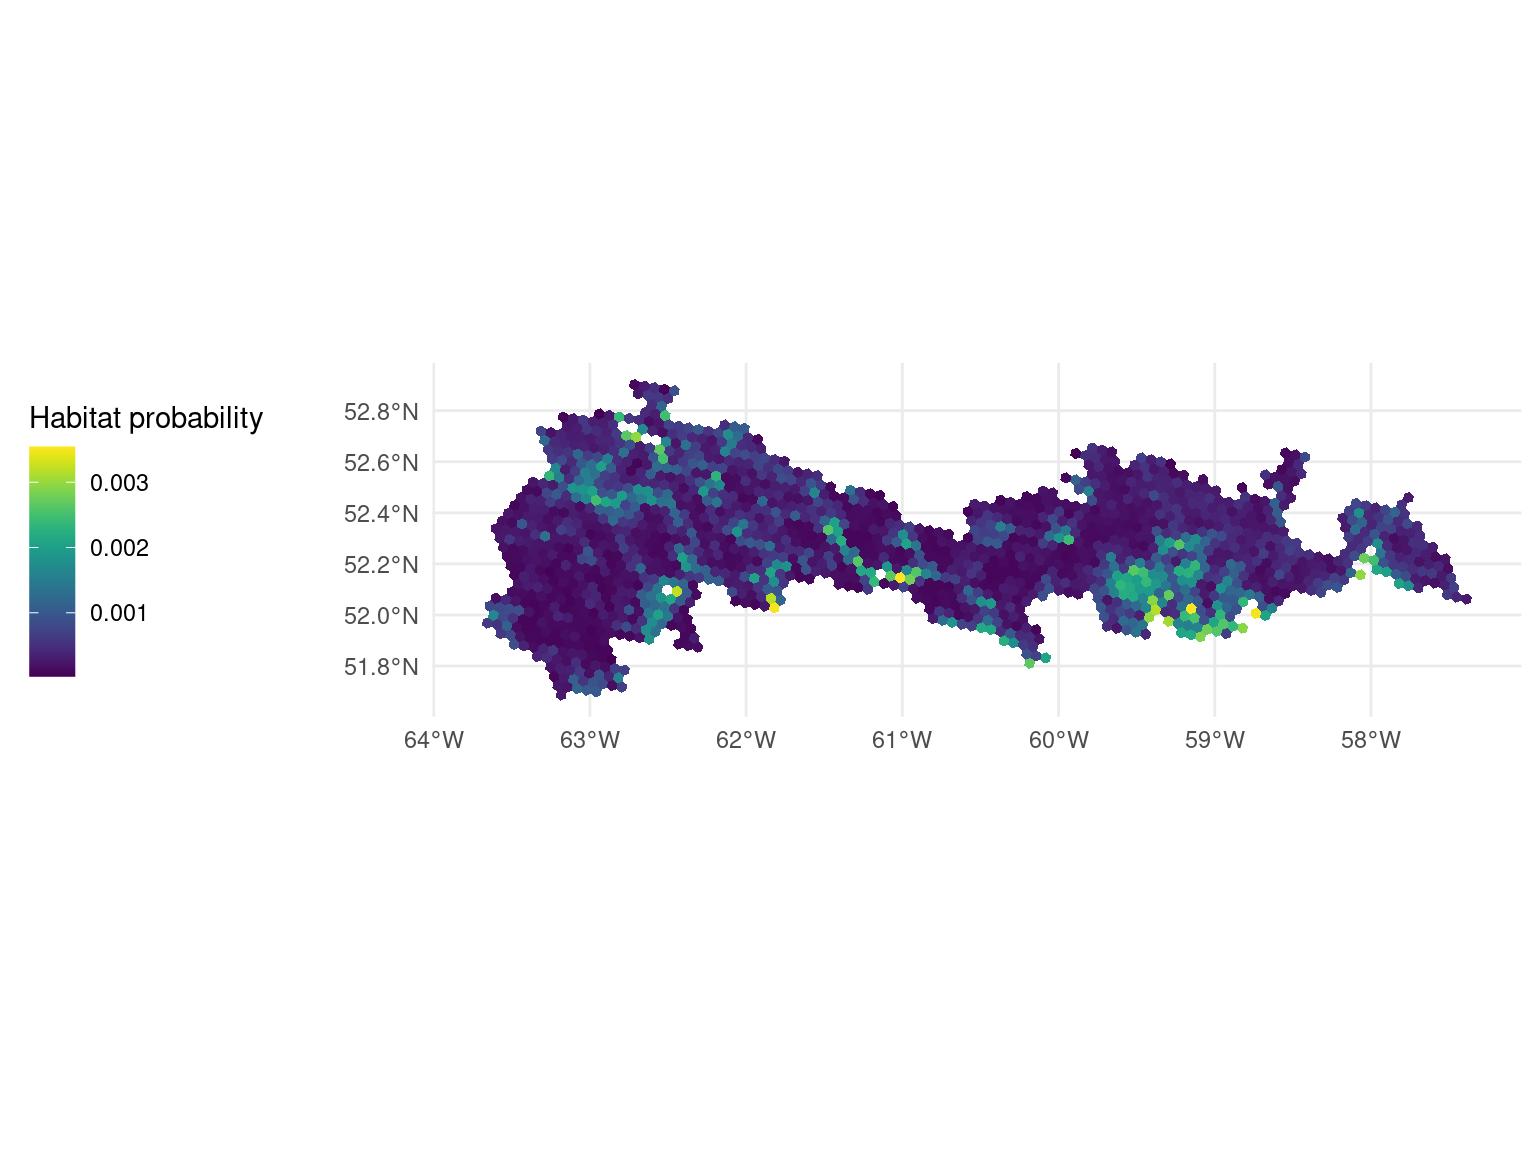
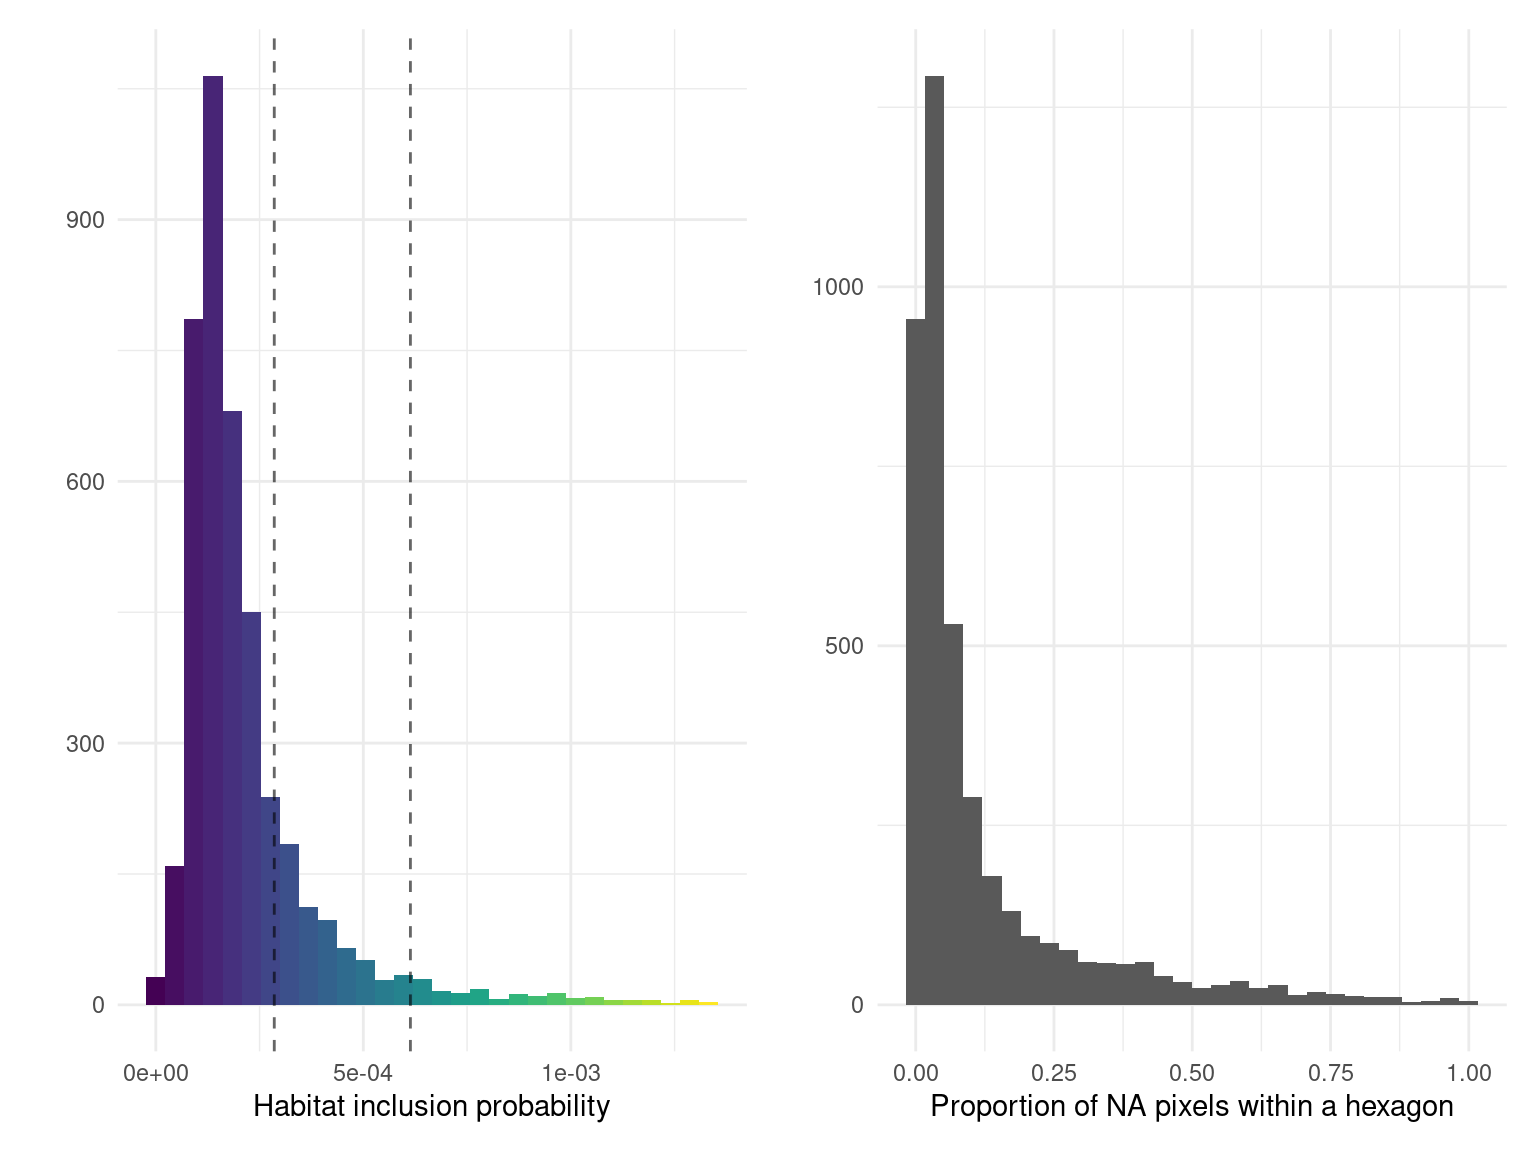
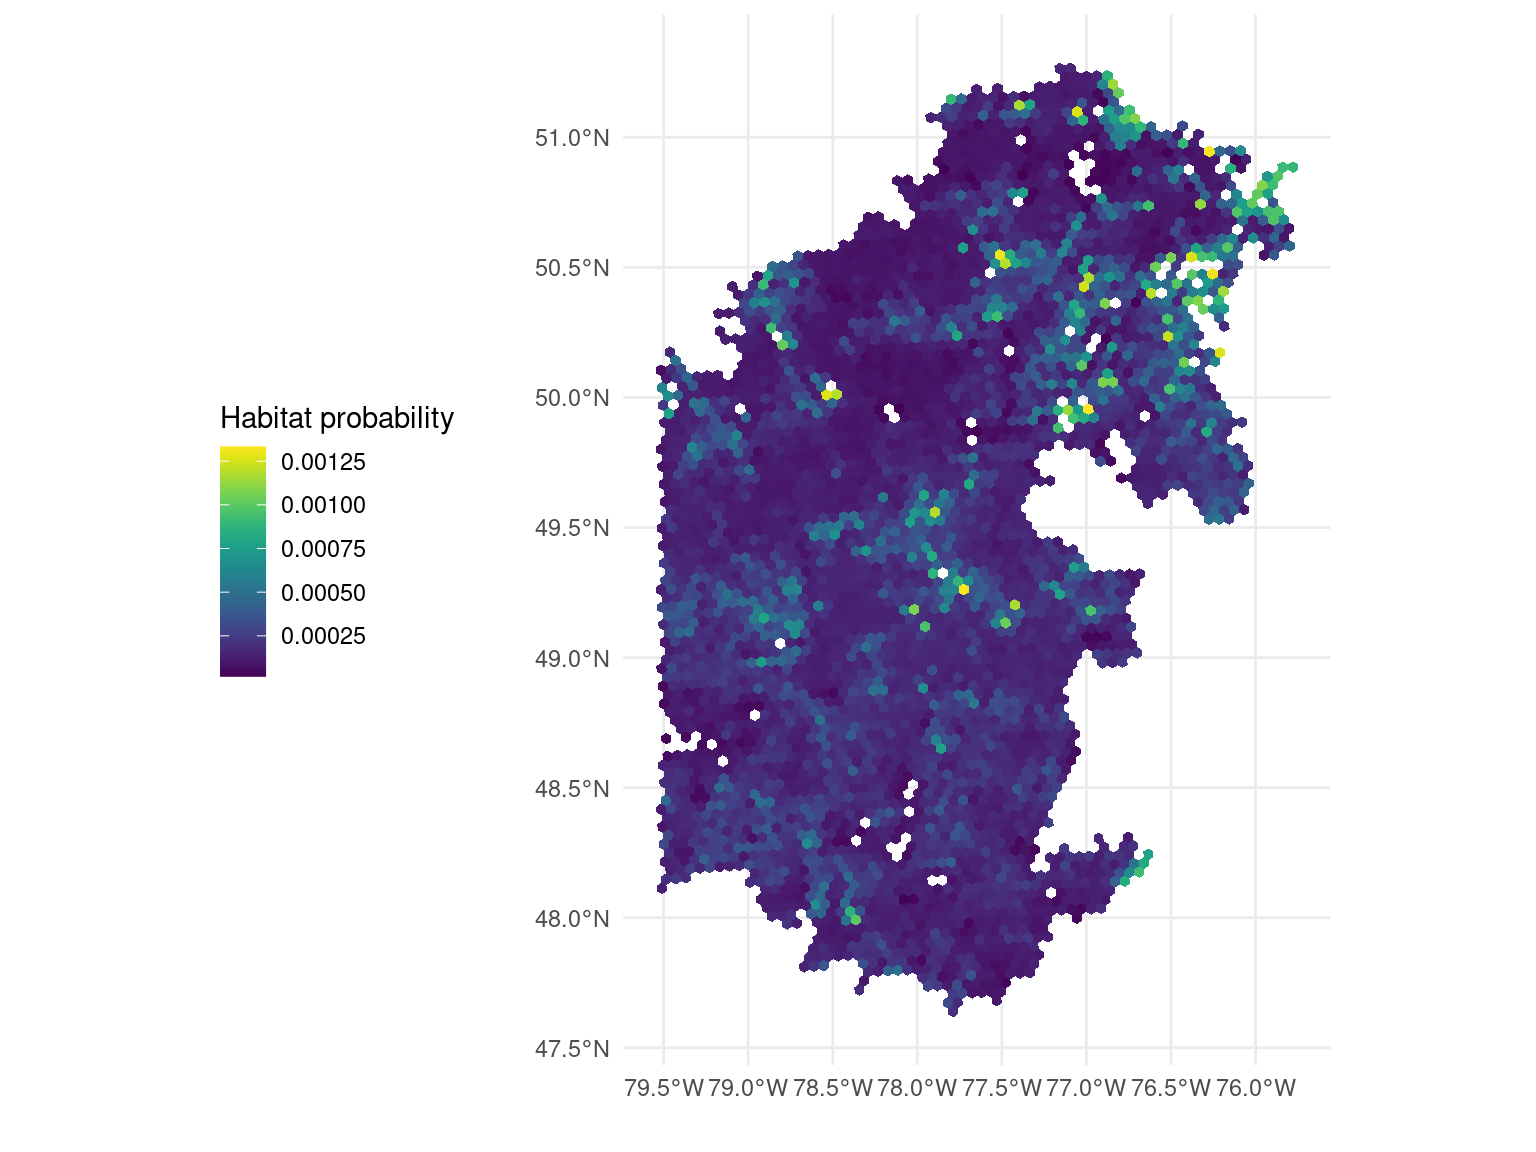
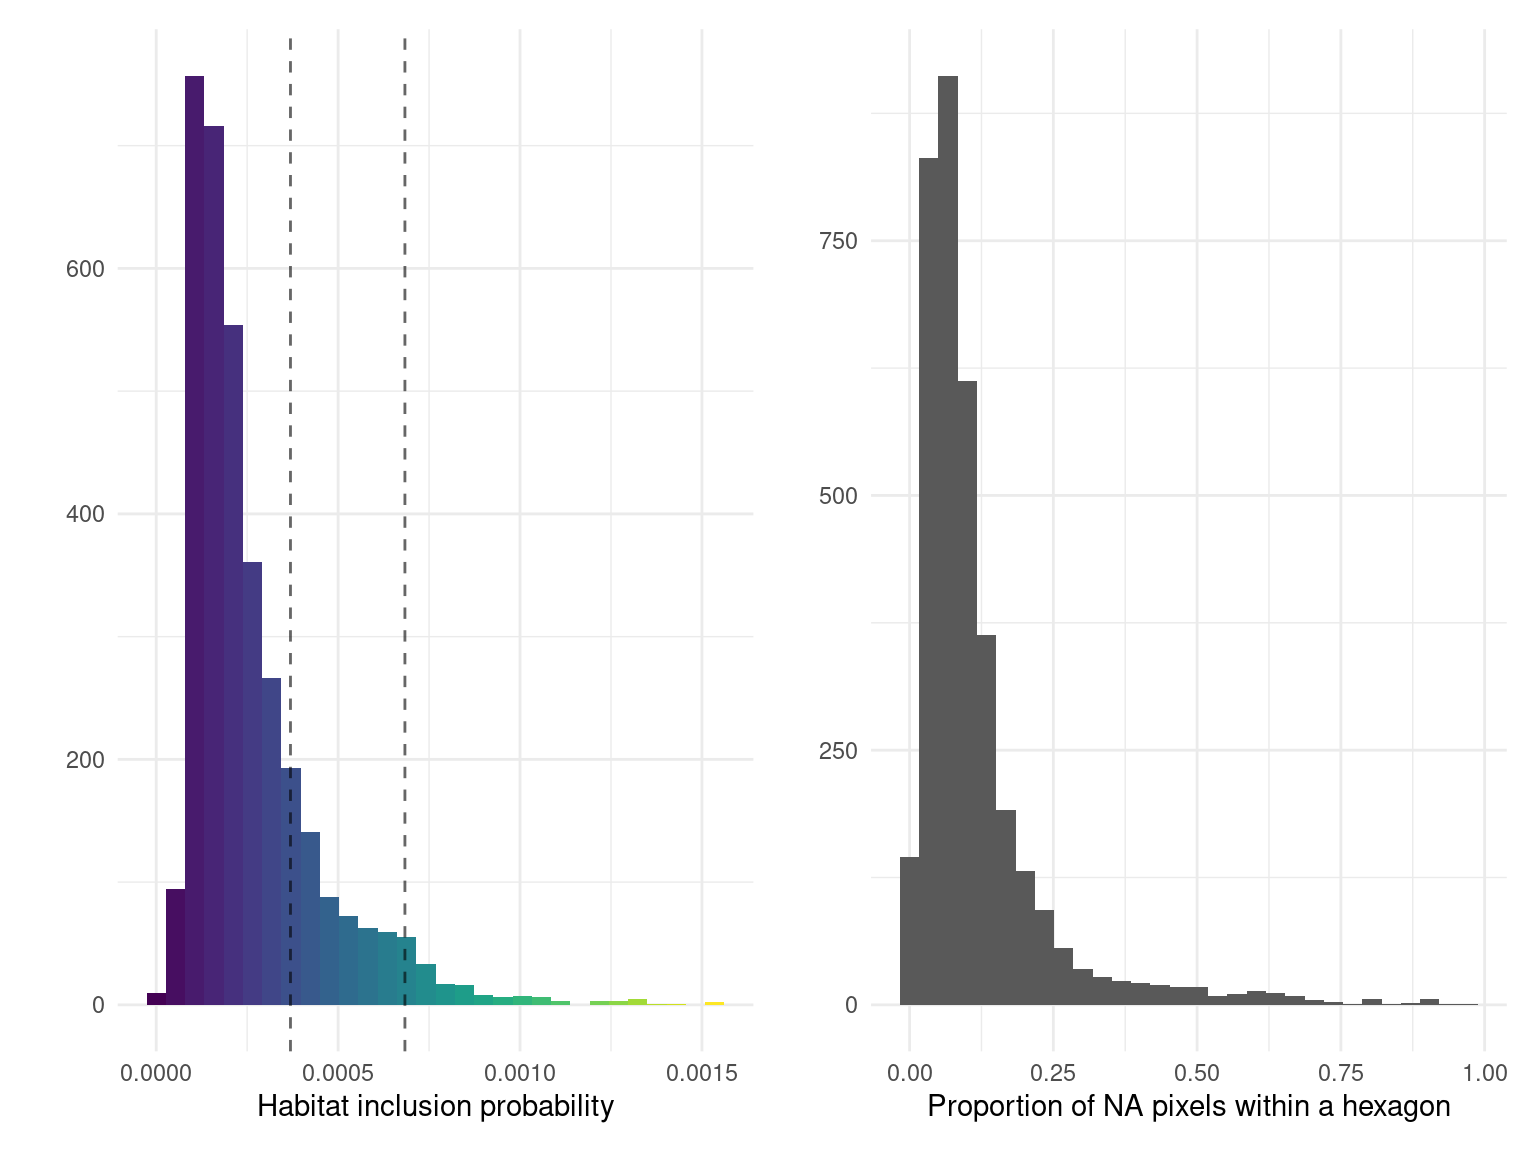
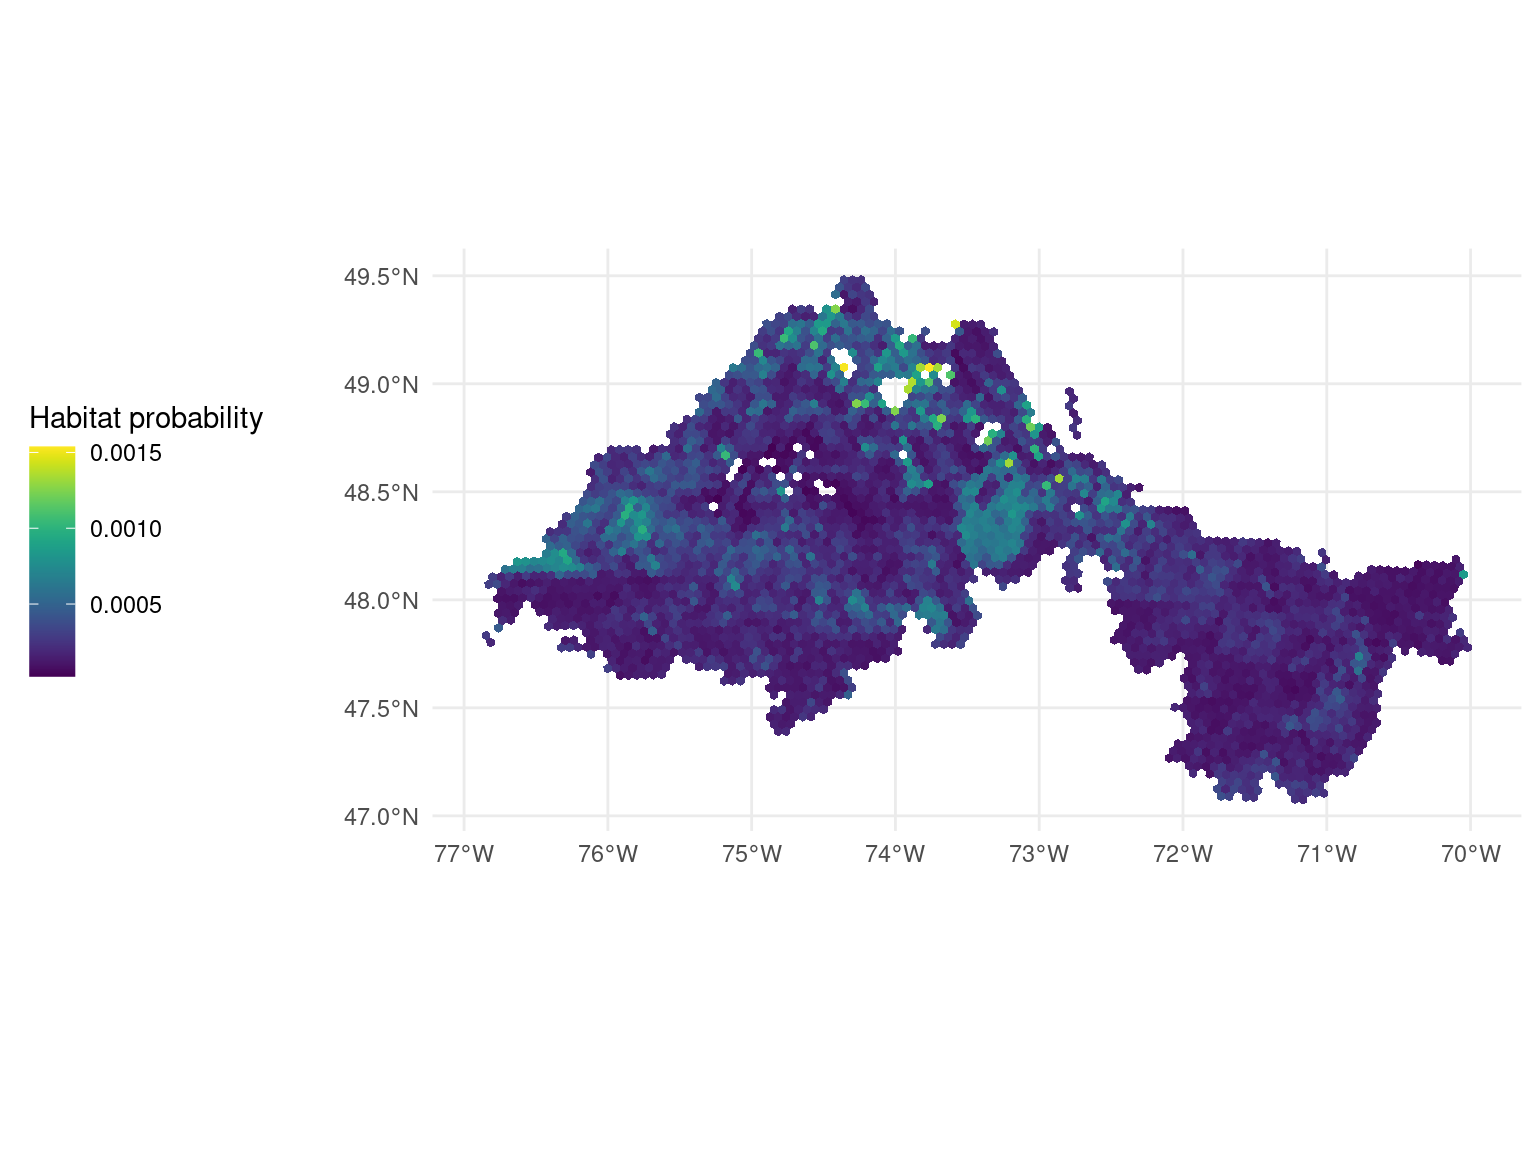
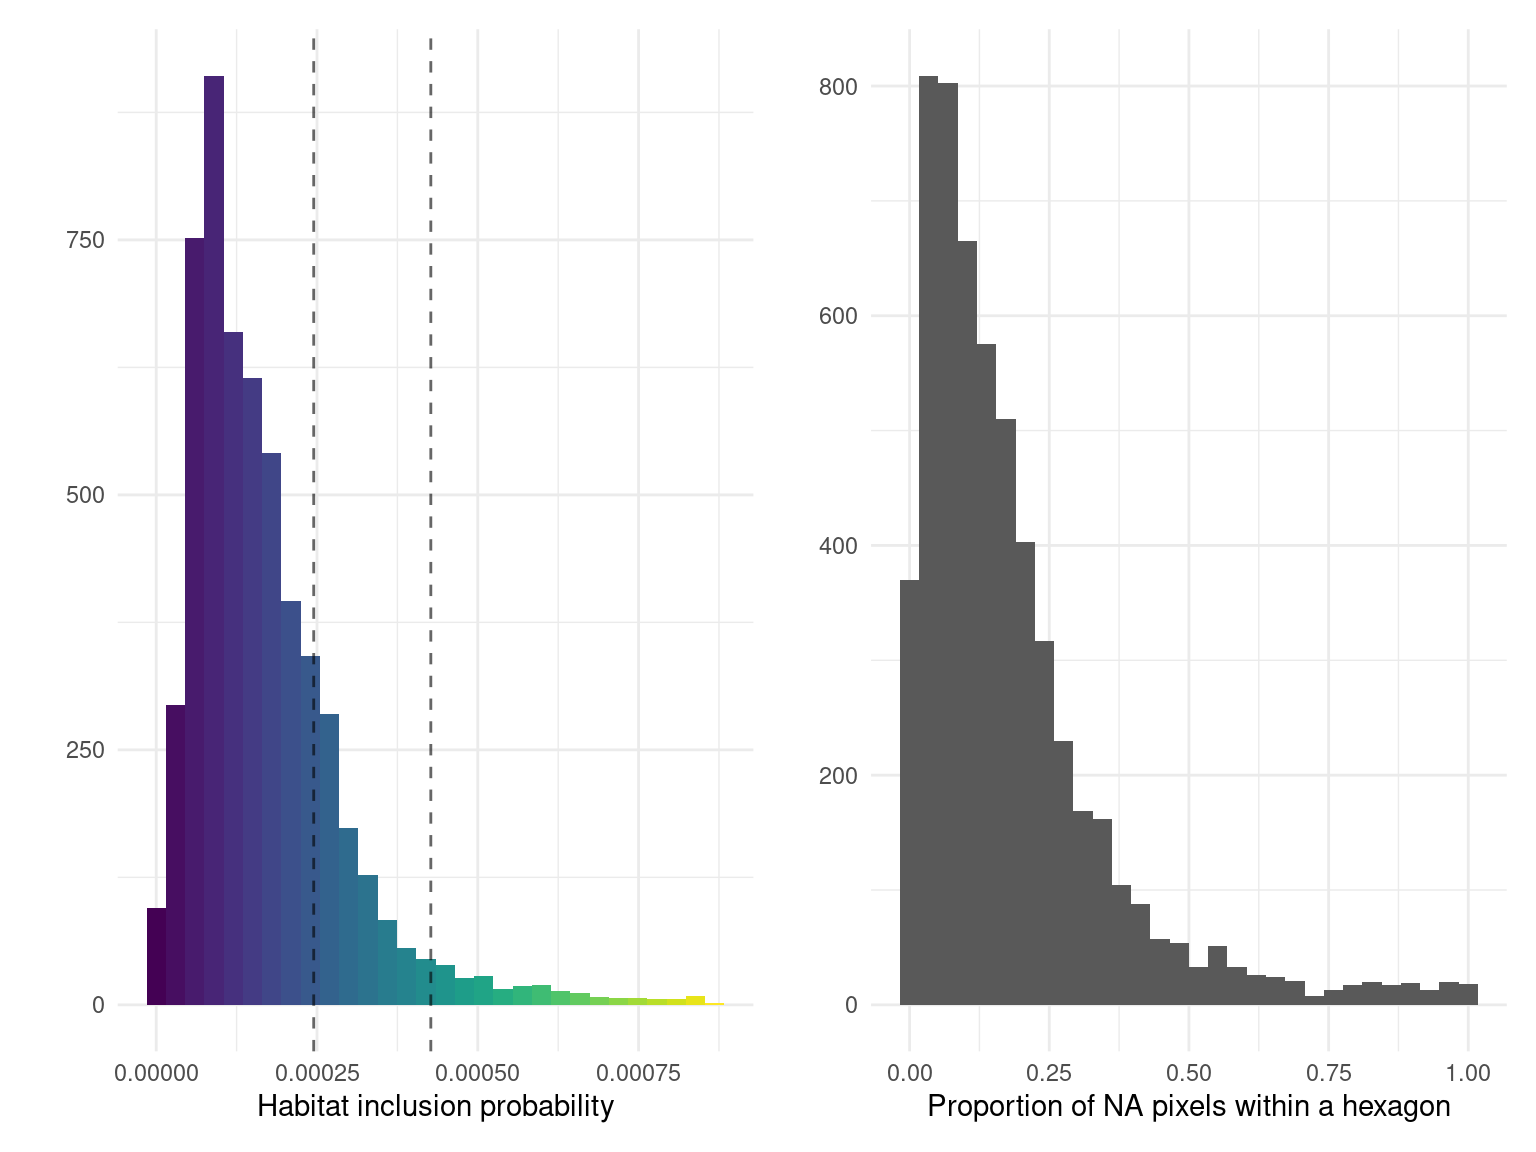
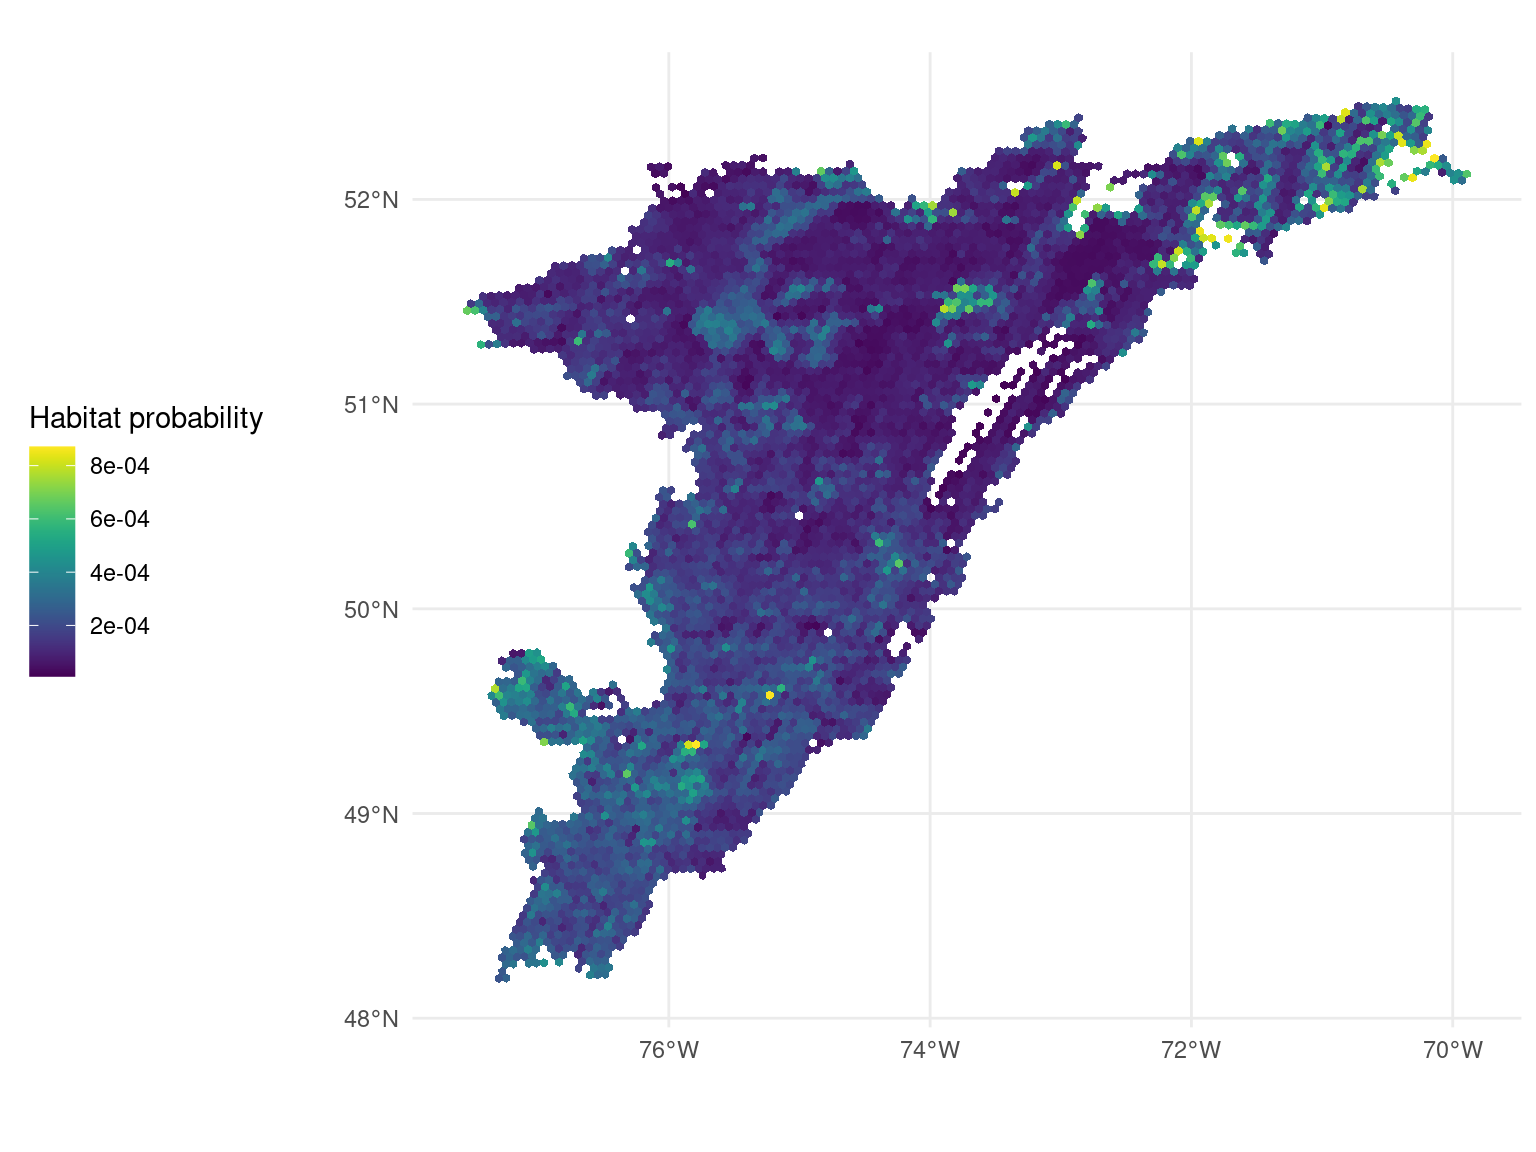
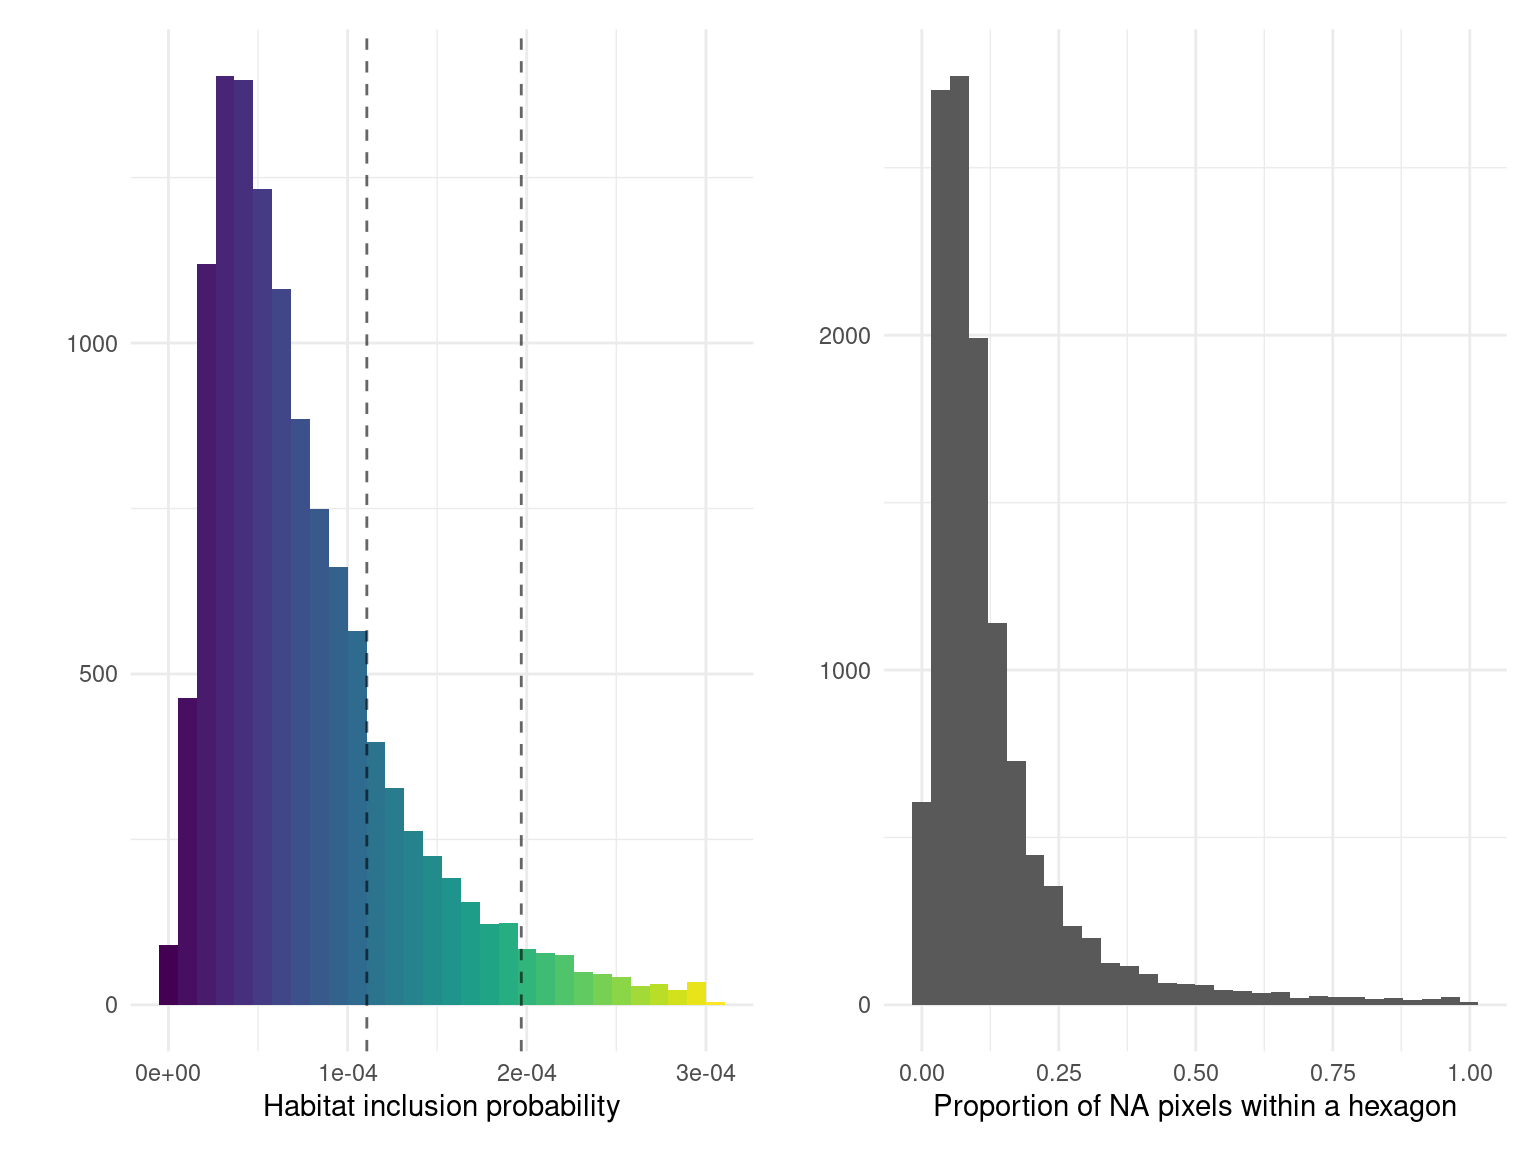
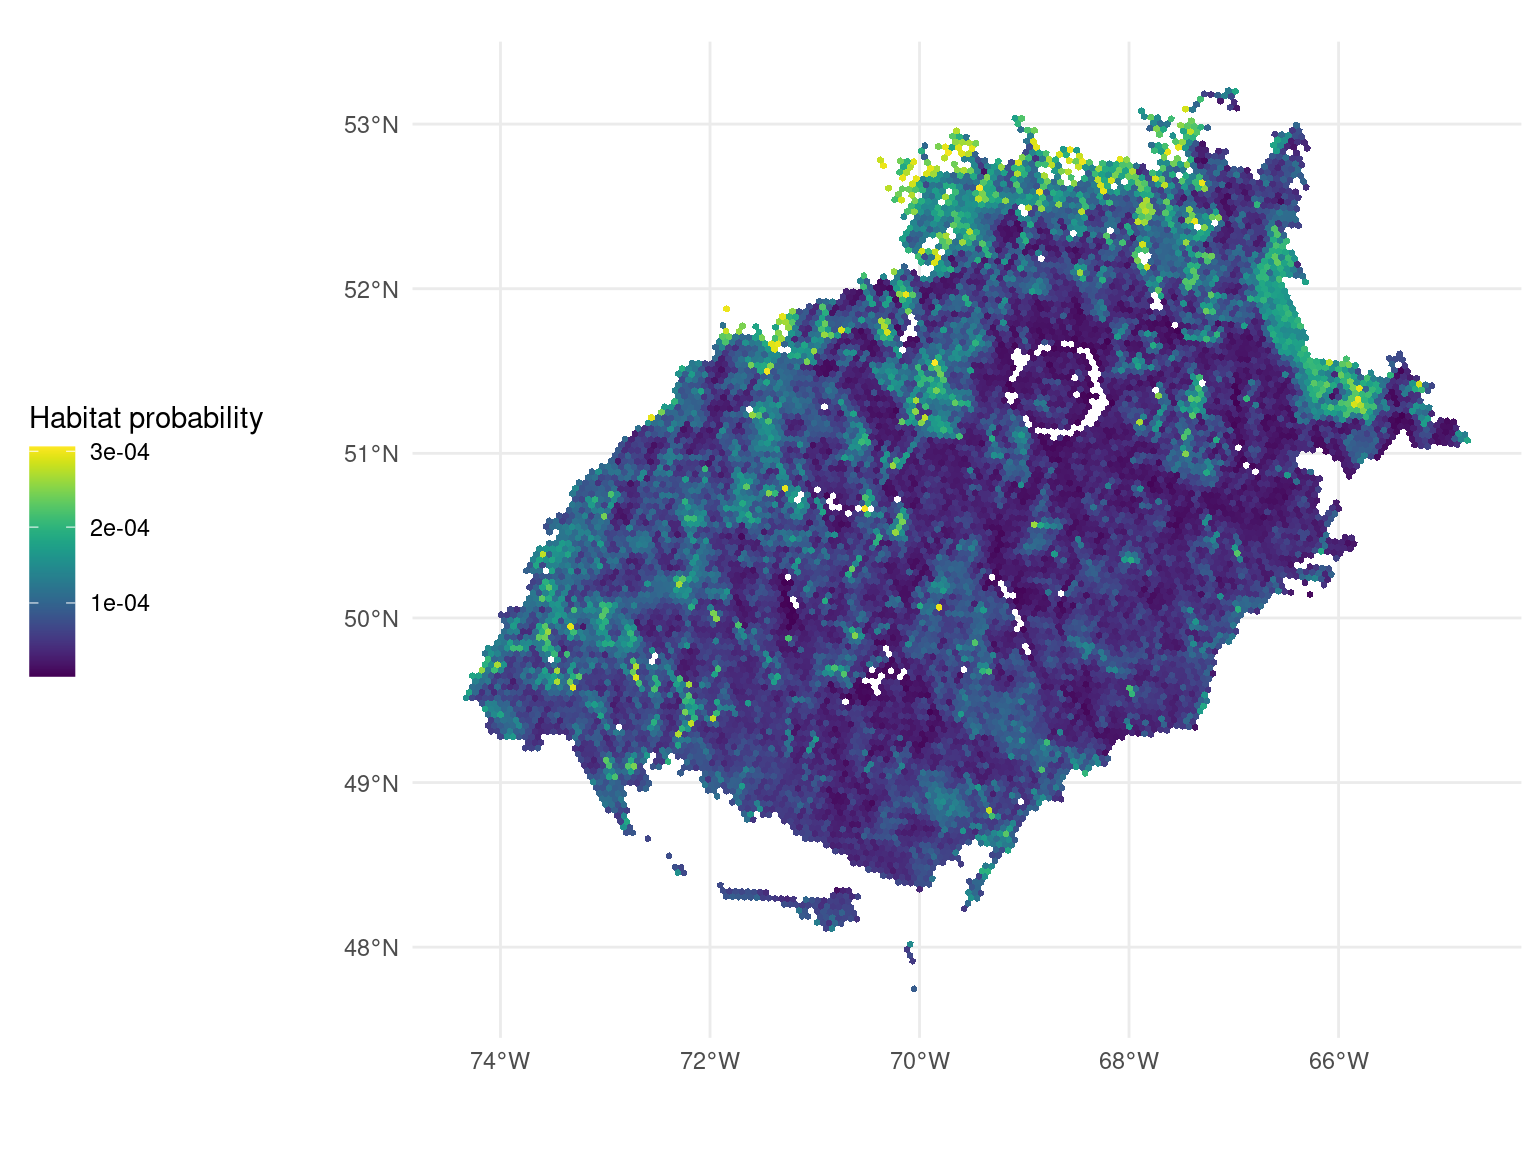
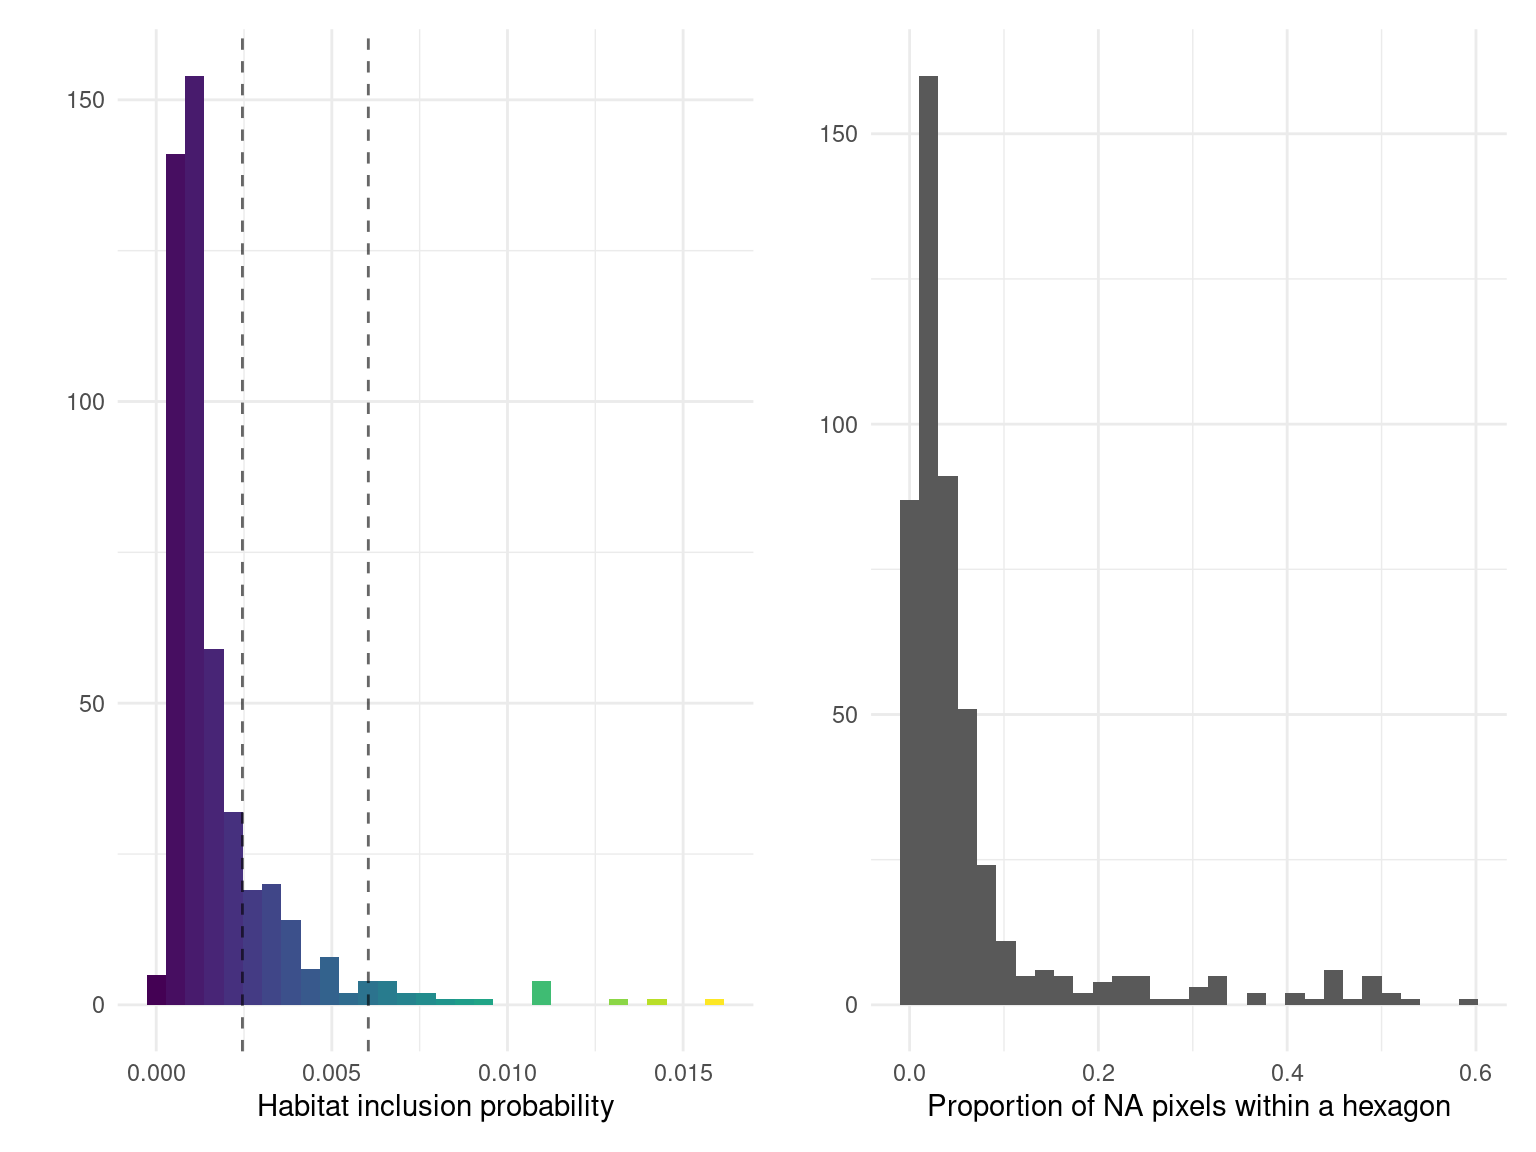
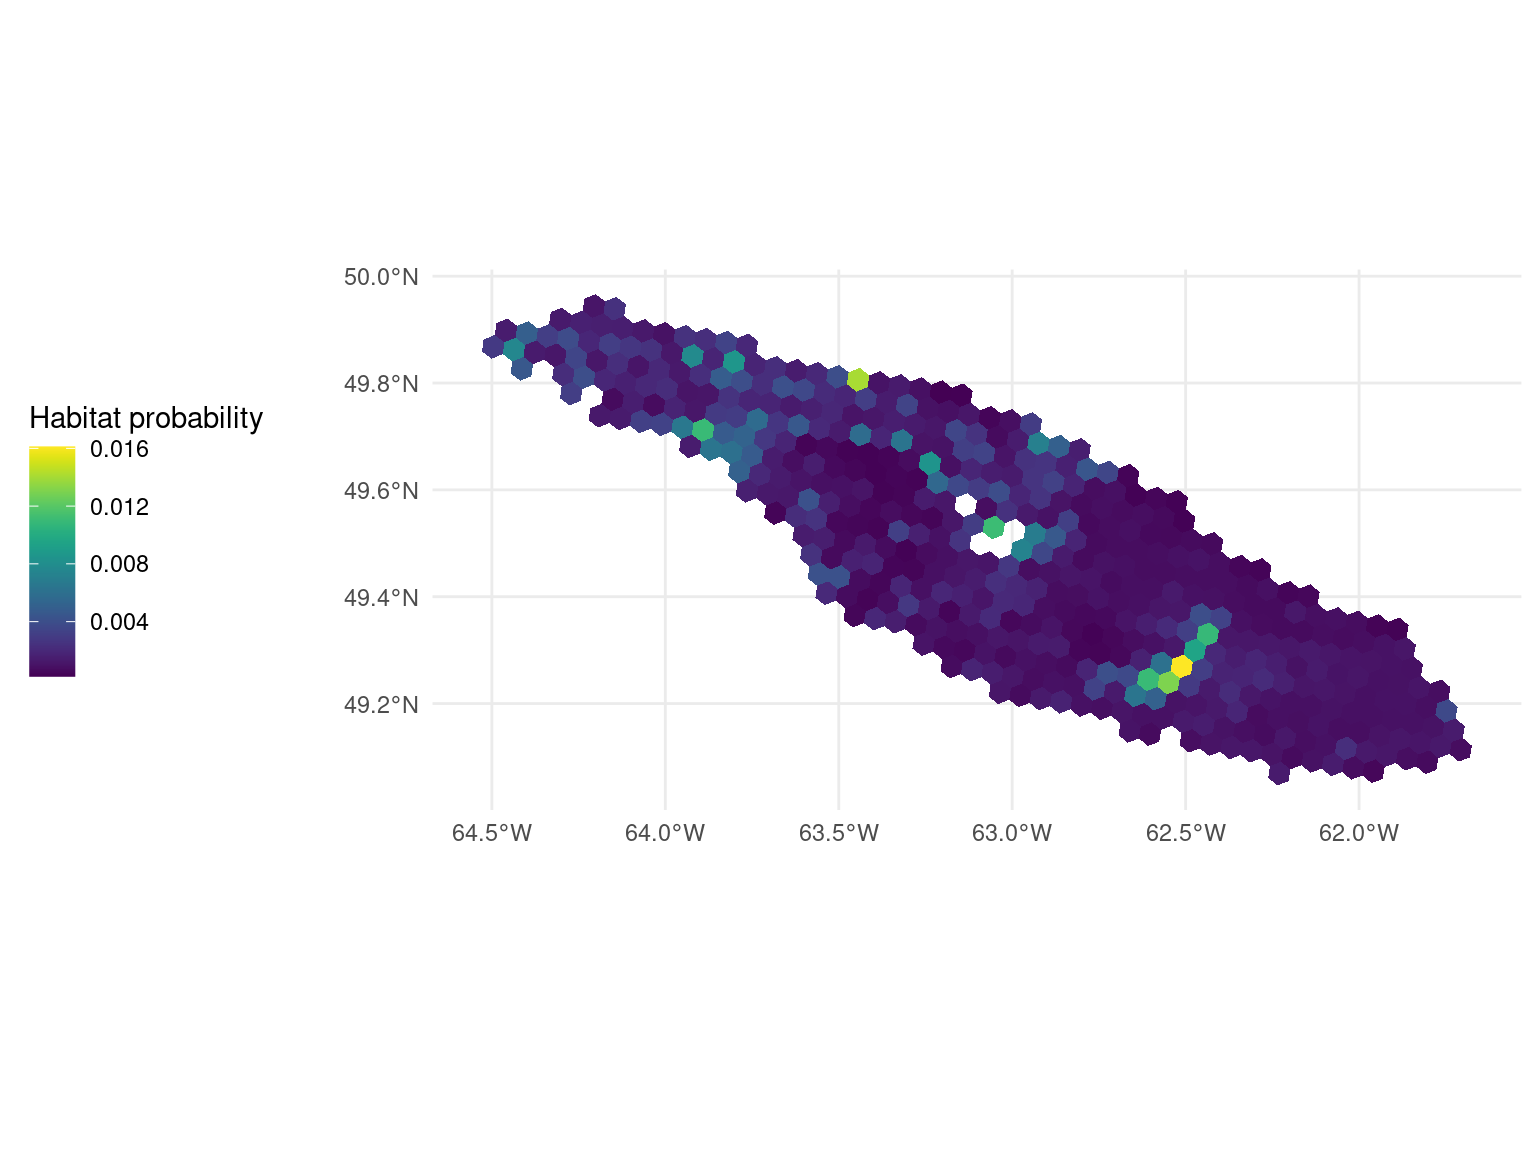
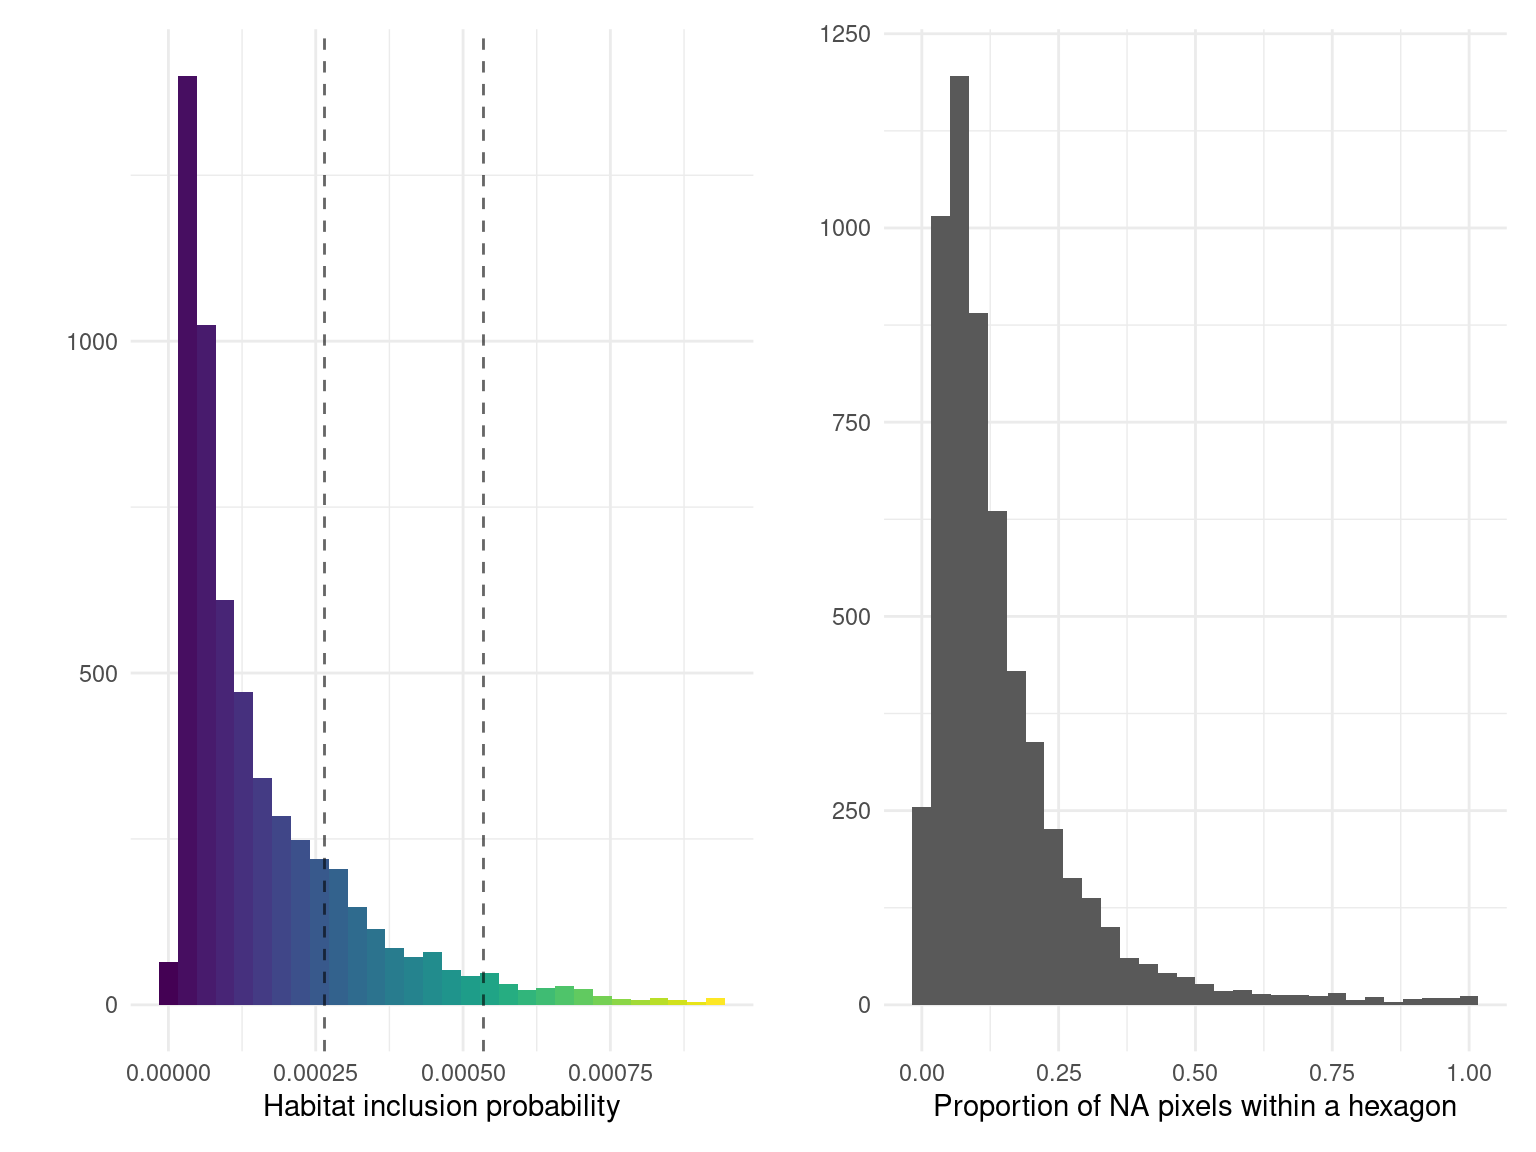
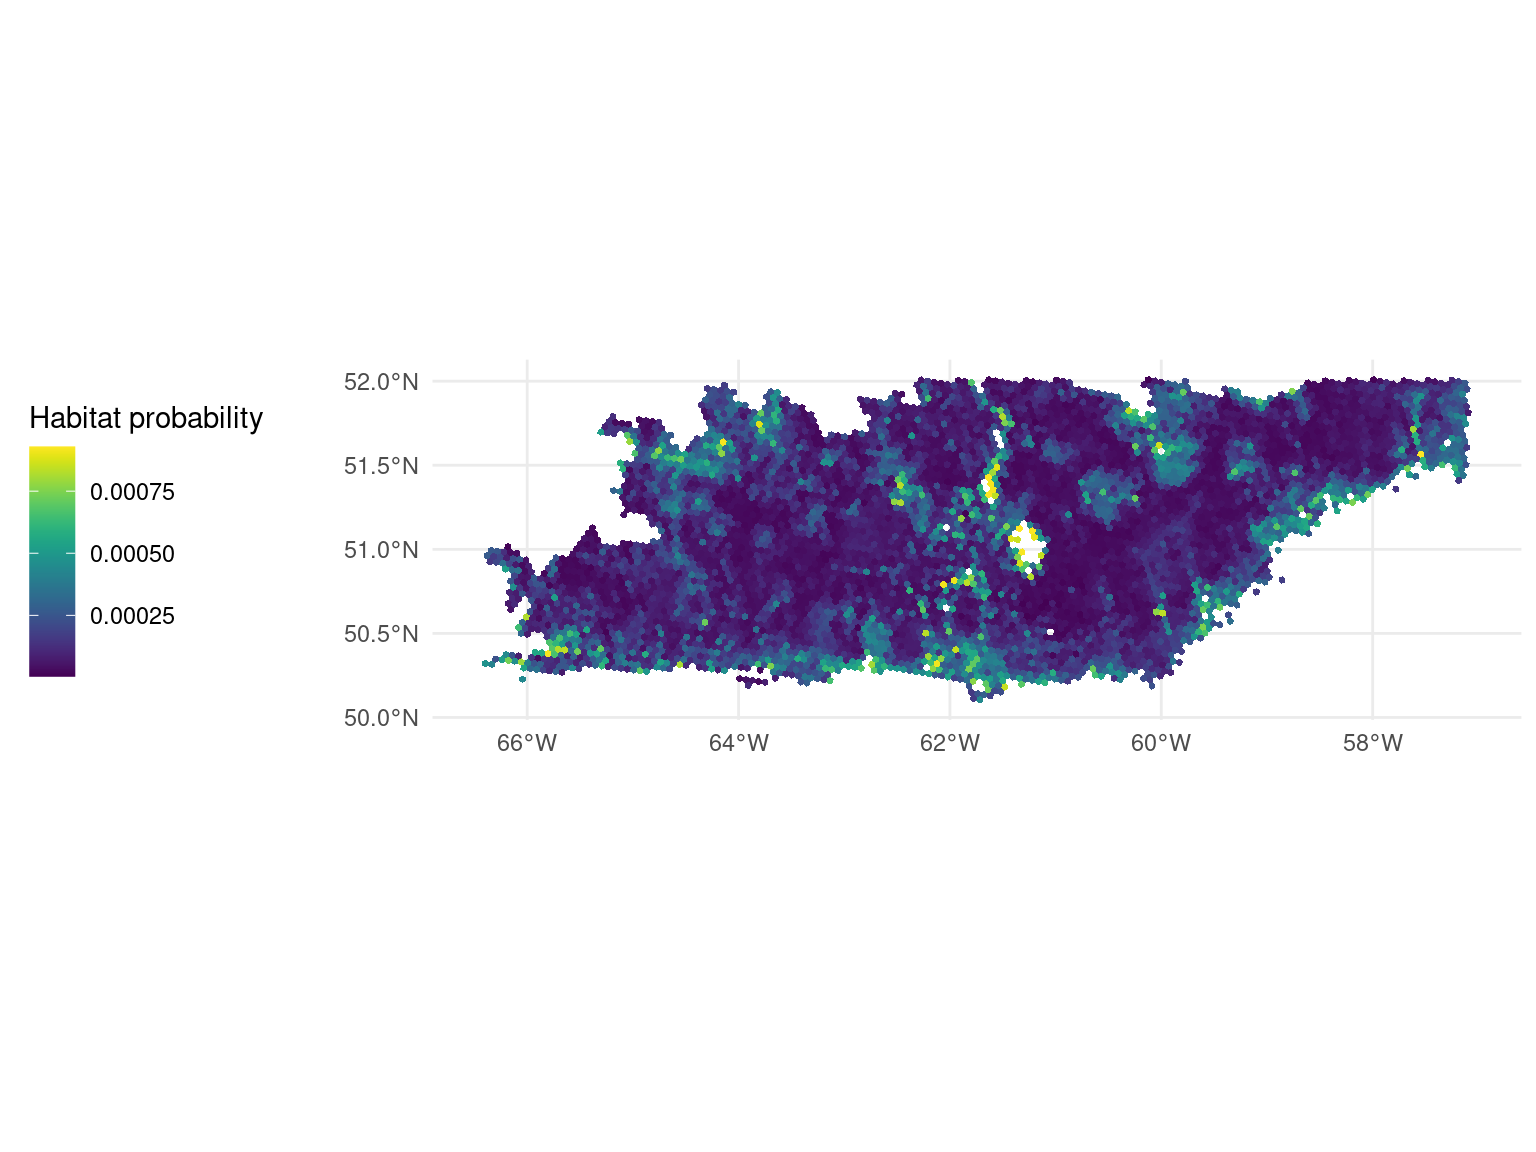
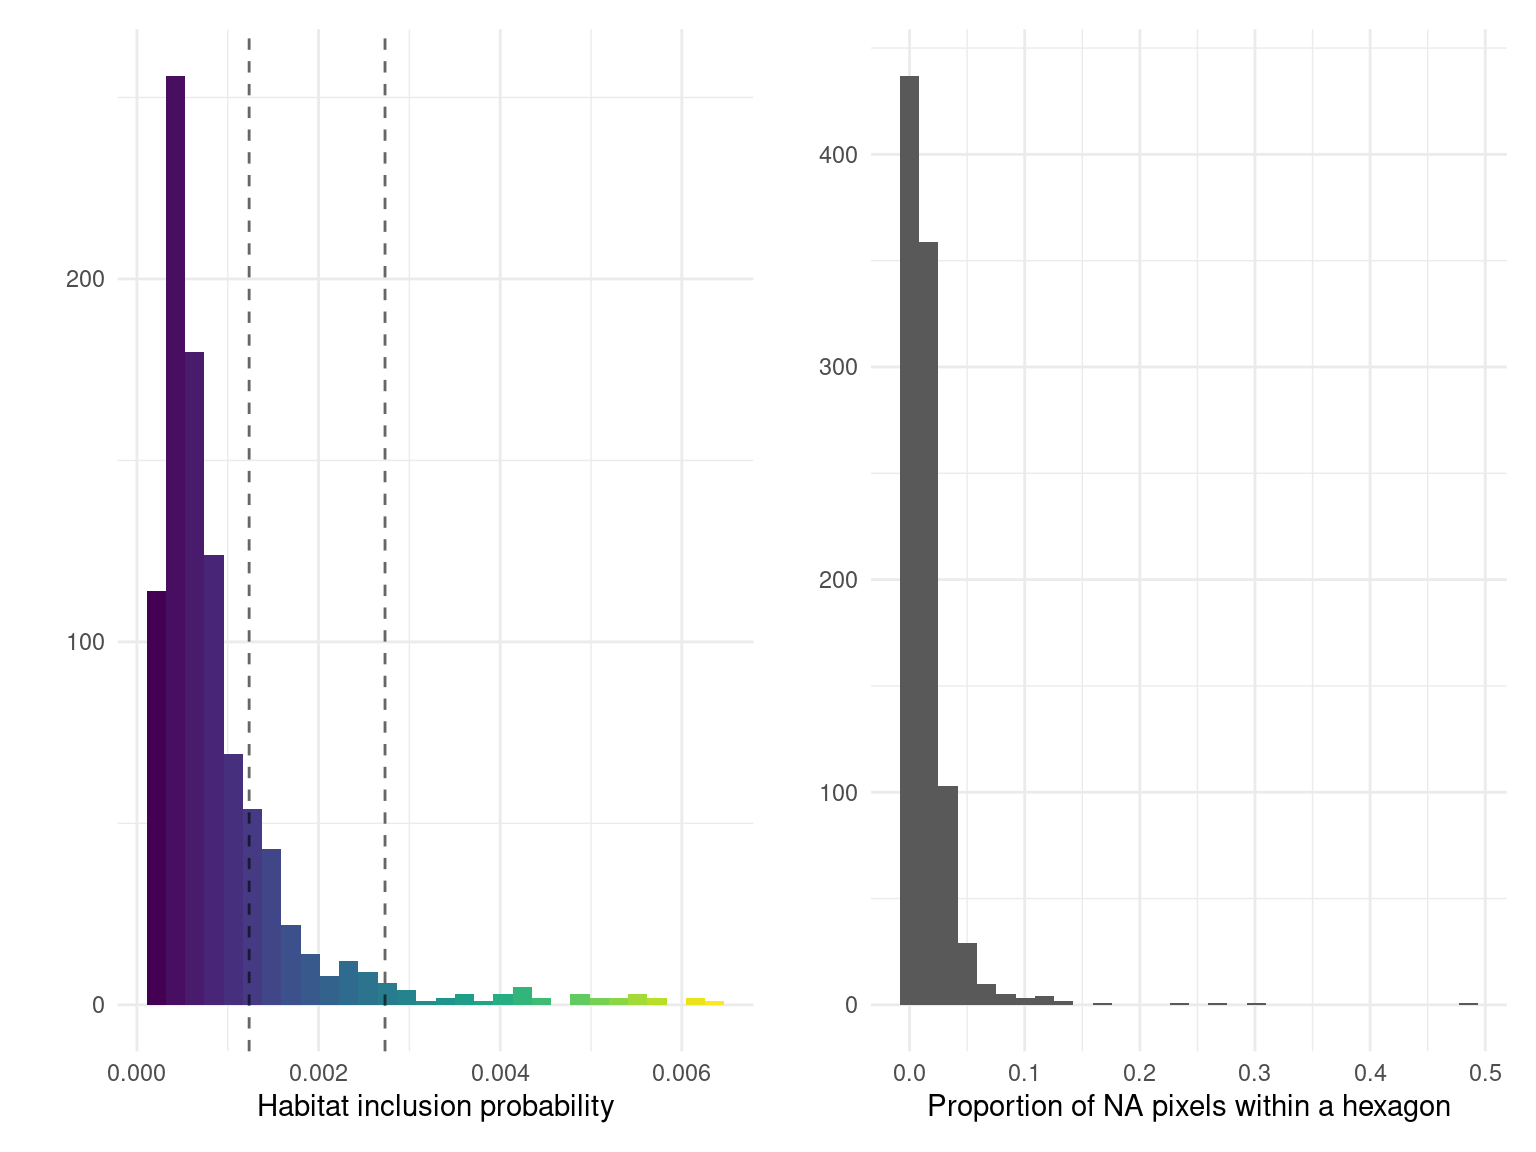
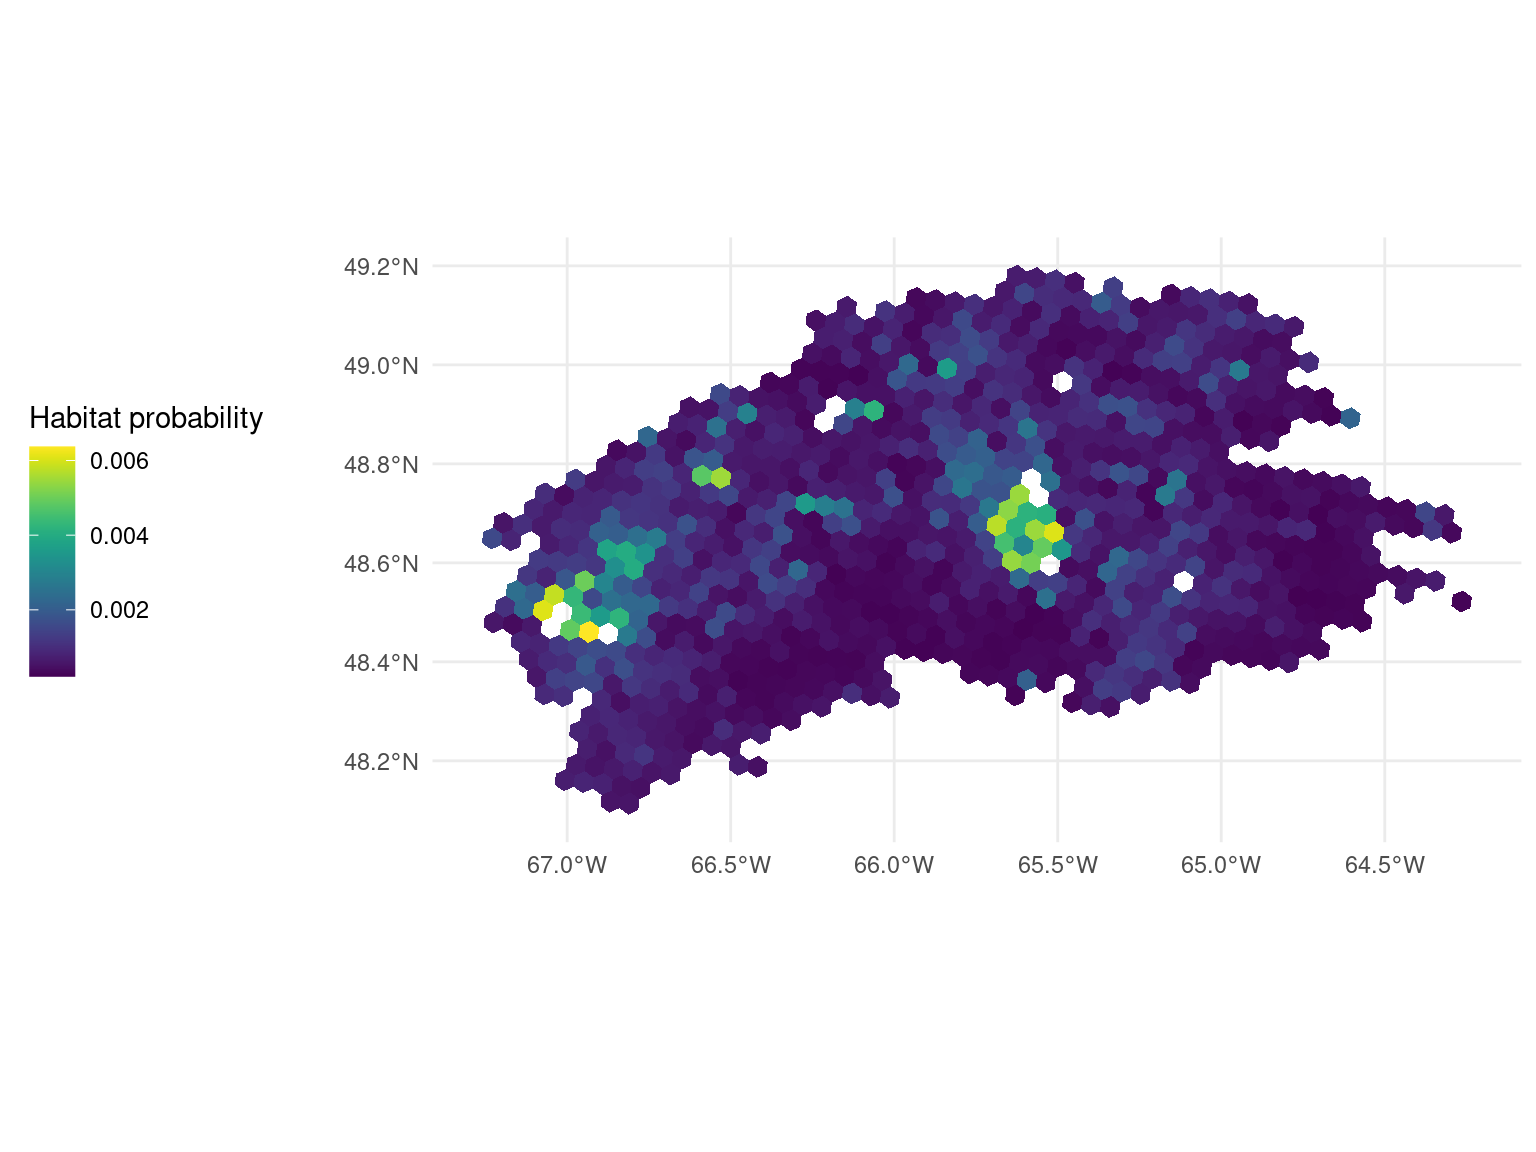
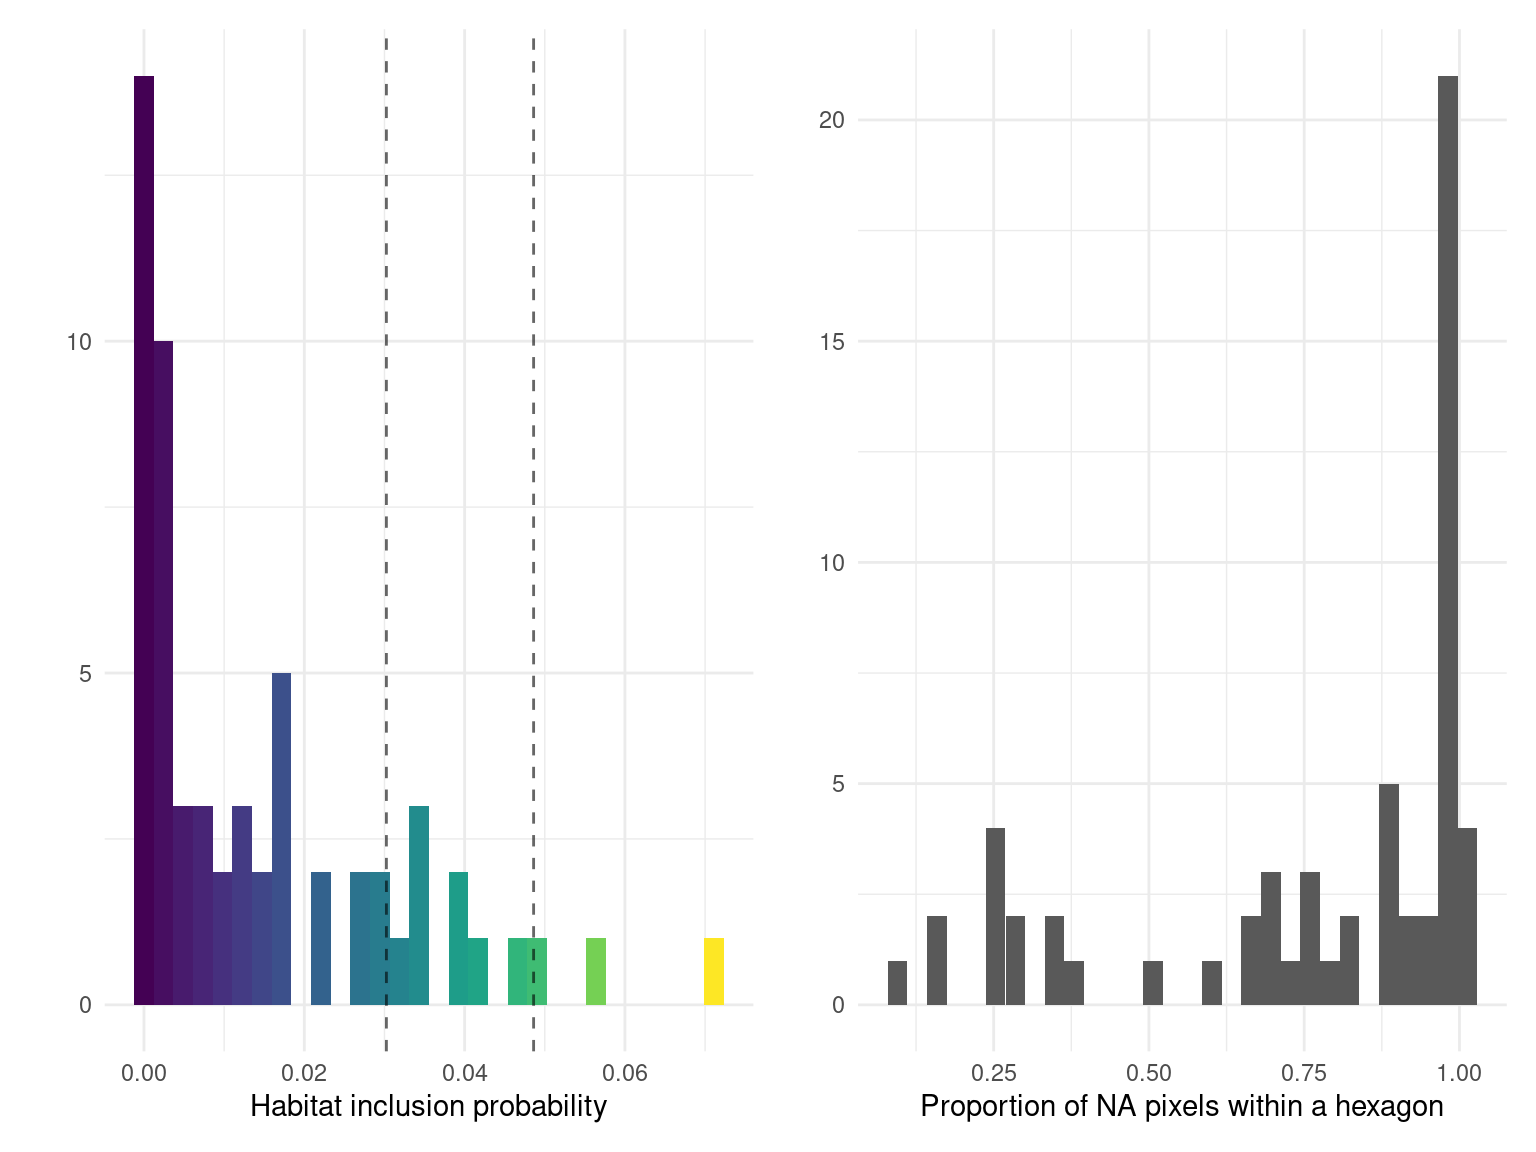
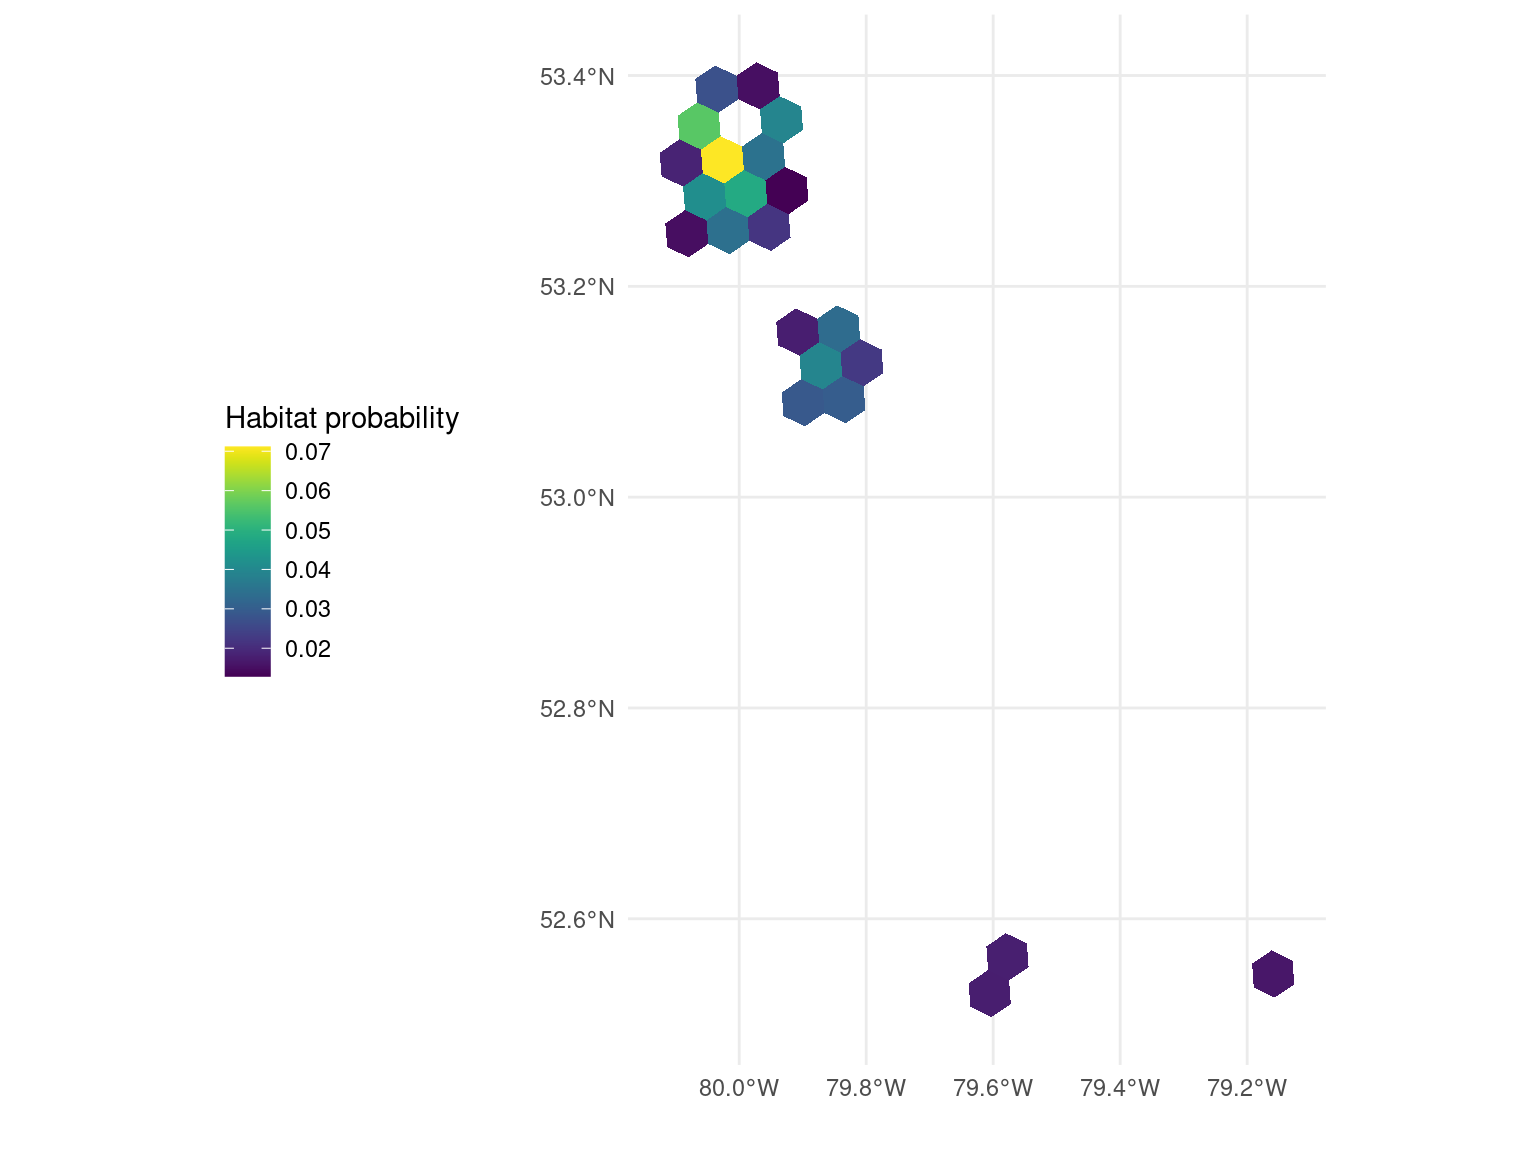
The subsequent histograms illustrate the distribution of habitat inclusion probability and the proportion of NA pixels within each hexagon. For the habitat inclusion probability histogram, the two dashed lines are used to describe the 80% and 95% quantile distribution illustrated in the first figure. The final figure displays the spatial distribution of habitat inclusion probability across the ecoregion. It’s worth noting that in most ecoregions, the distribution of habitat inclusion probability is highly skewed, with only a few hexagons having a very large inclusion probability. This skewed distribution can make it challenging to visualize the gradient of inclusion probability. To avoid this issue, we removed the hexagons with the top 0.1% inclusion probability to improve the clarity of the inclusion probability gradient.
Ecoregion 7
 ## Ecoregion 28
 ## Ecoregion 30
 ## Ecoregion 31
 ## Ecoregion 46
 ## Ecoregion 47
 ## Ecoregion 48
 ## Ecoregion 49
 ## Ecoregion 72
 ## Ecoregion 73
 ## Ecoregion 74
 ## Ecoregion 75
 ## Ecoregion 76
 ## Ecoregion 77
 ## Ecoregion 78
 ## Ecoregion 86
 ## Ecoregion 96
 ## Ecoregion 99
 ## Ecoregion 100
 ## Ecoregion 101
 ## Ecoregion 102
 ## Ecoregion 103
 ## Ecoregion 117
 ## Ecoregion 216
 ## Ecoregion 217