10 Ecoregion summary: cost
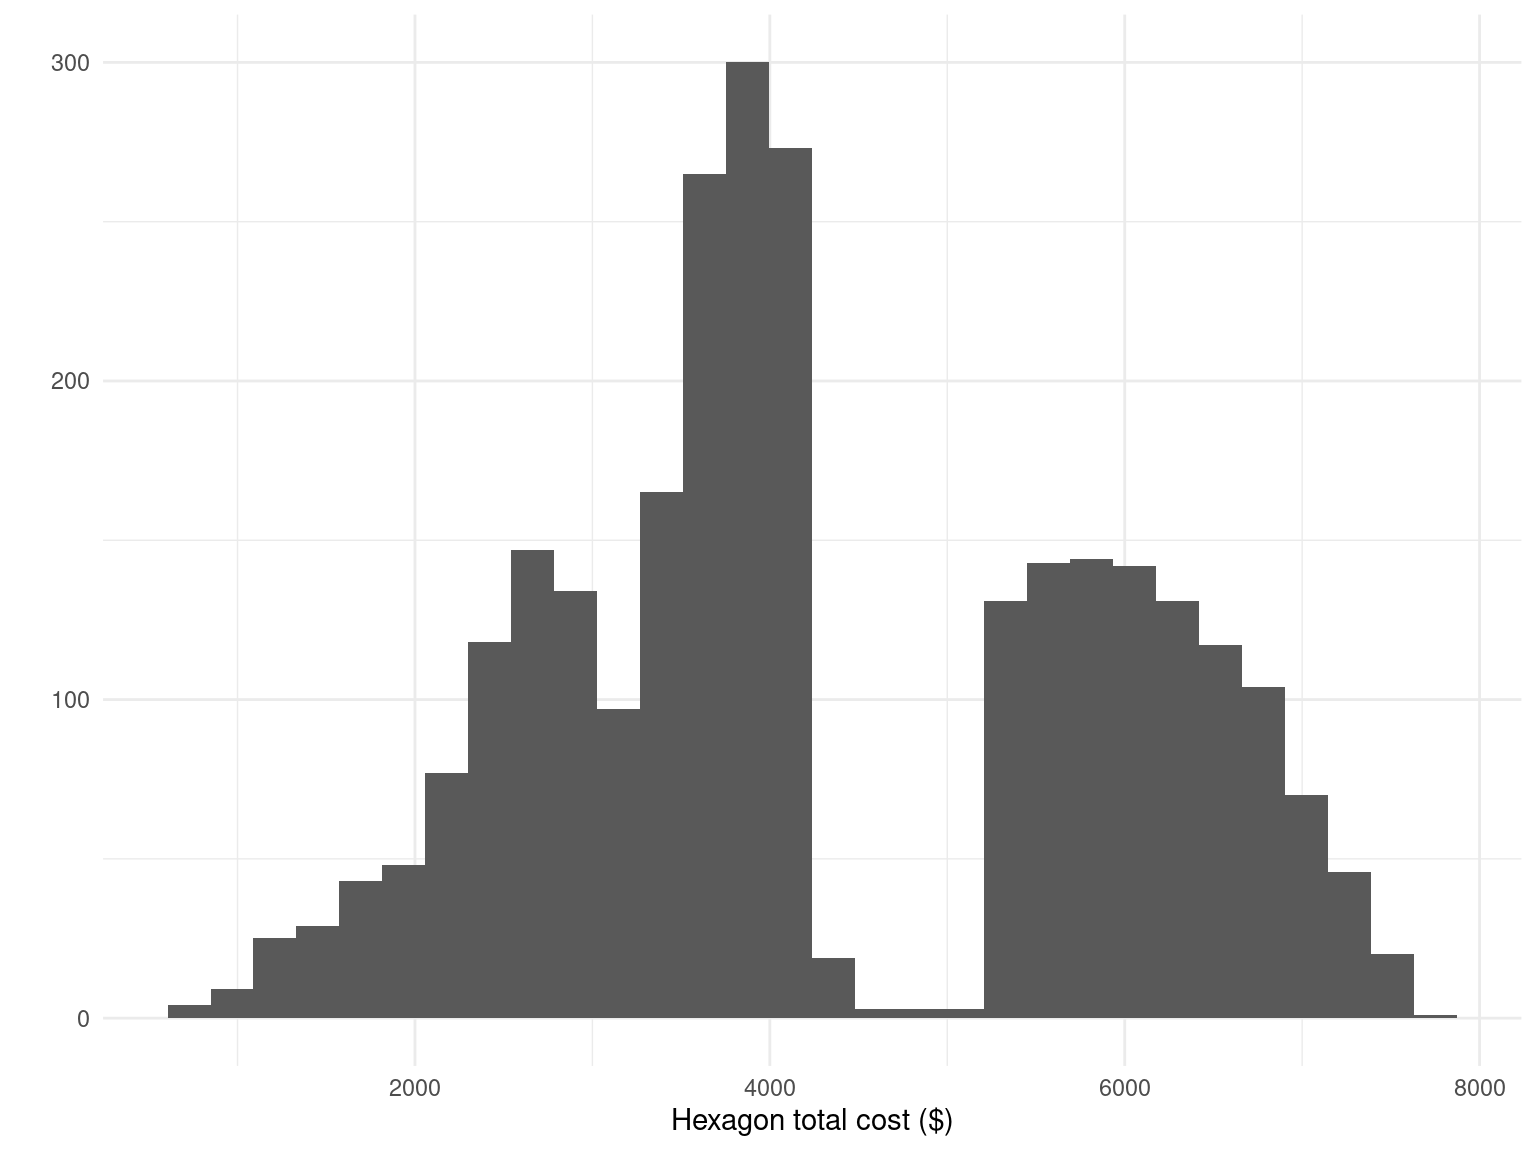
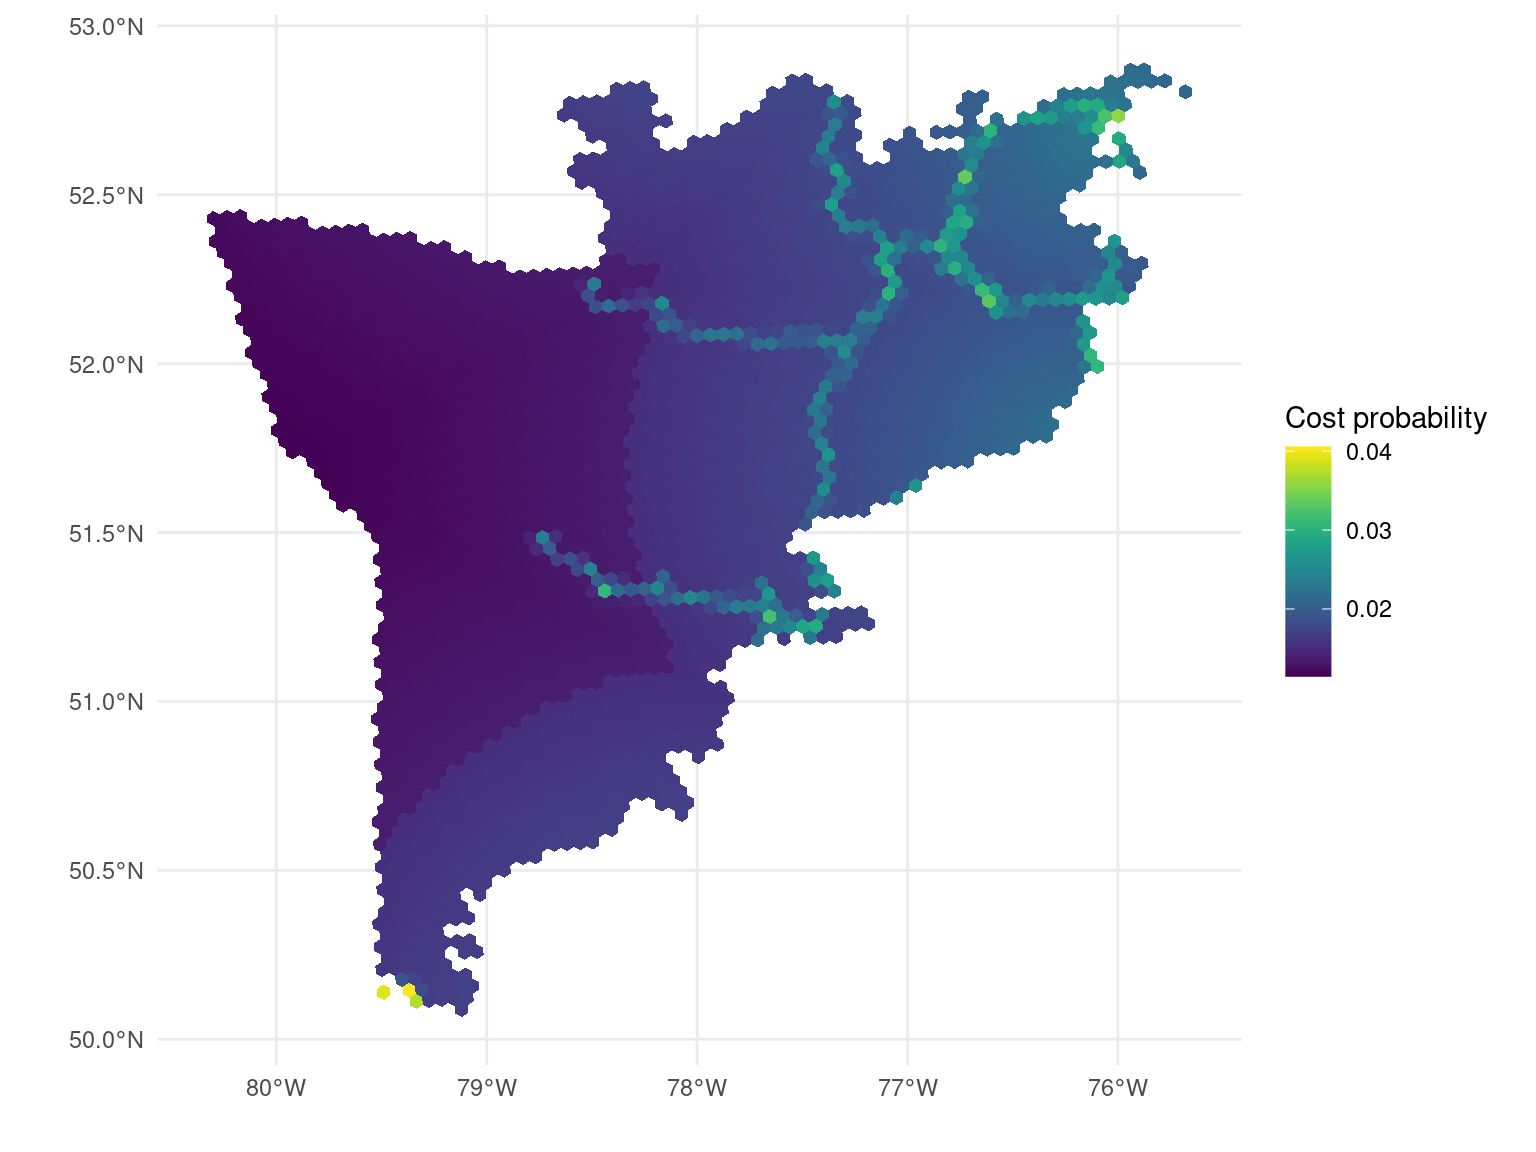
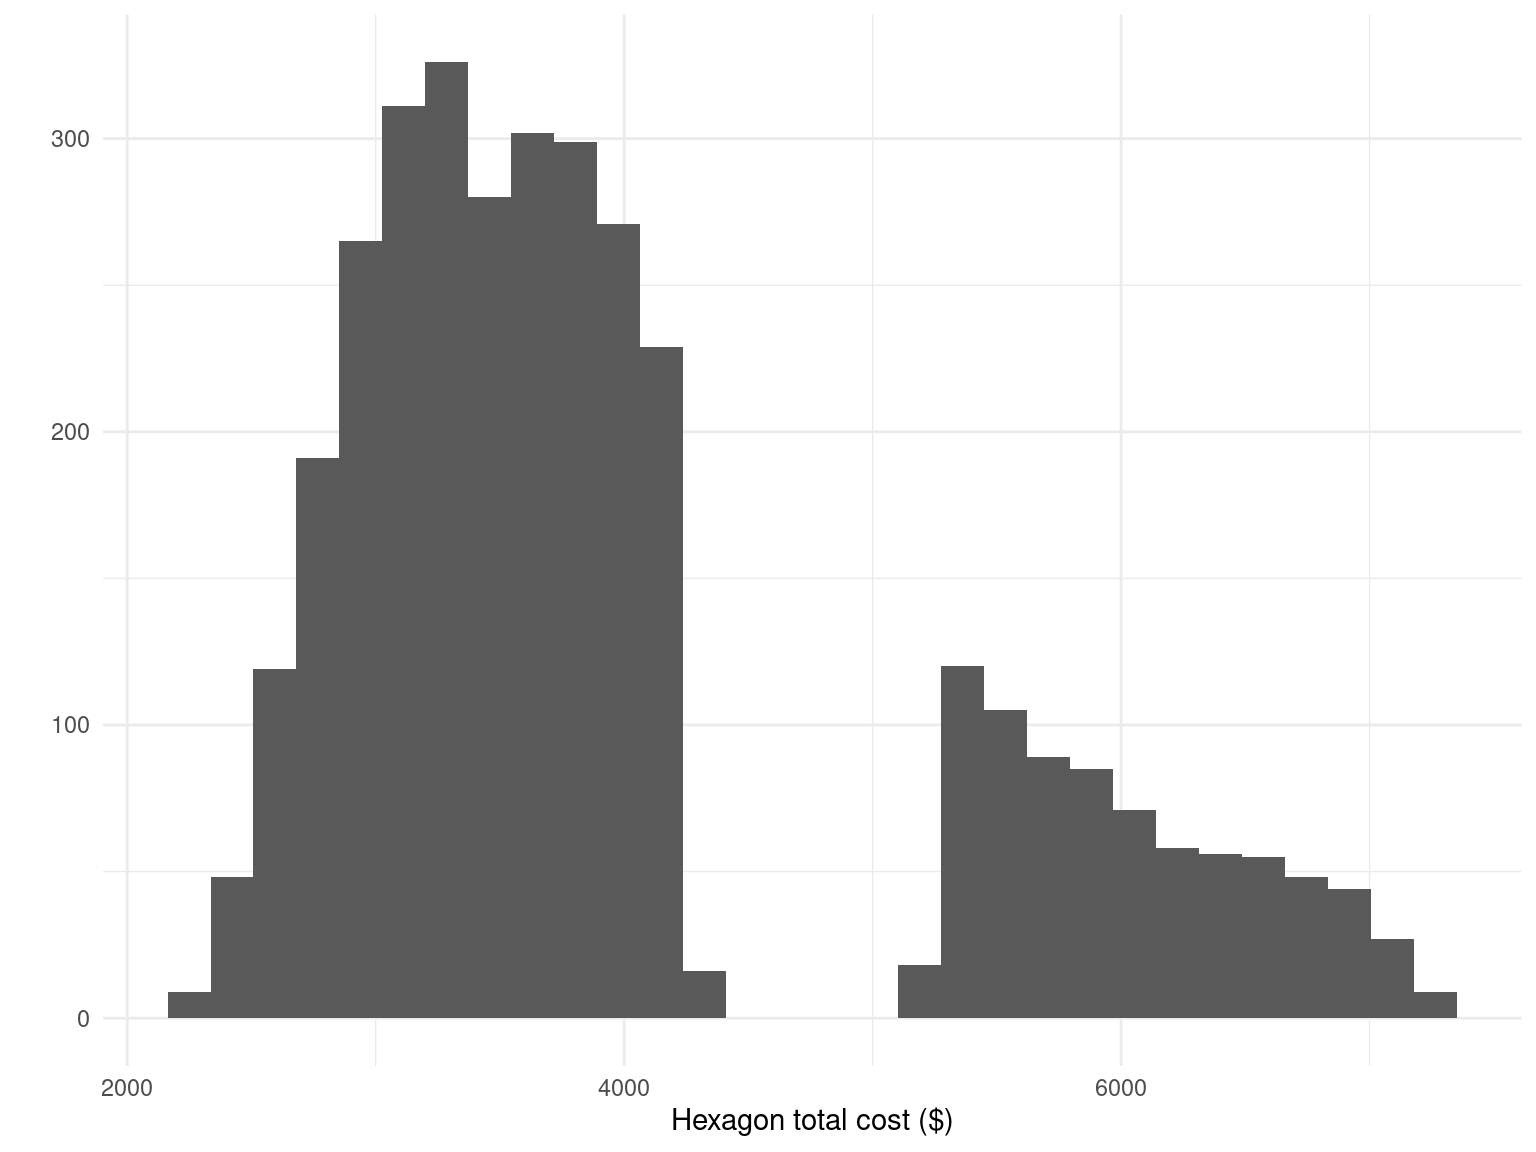
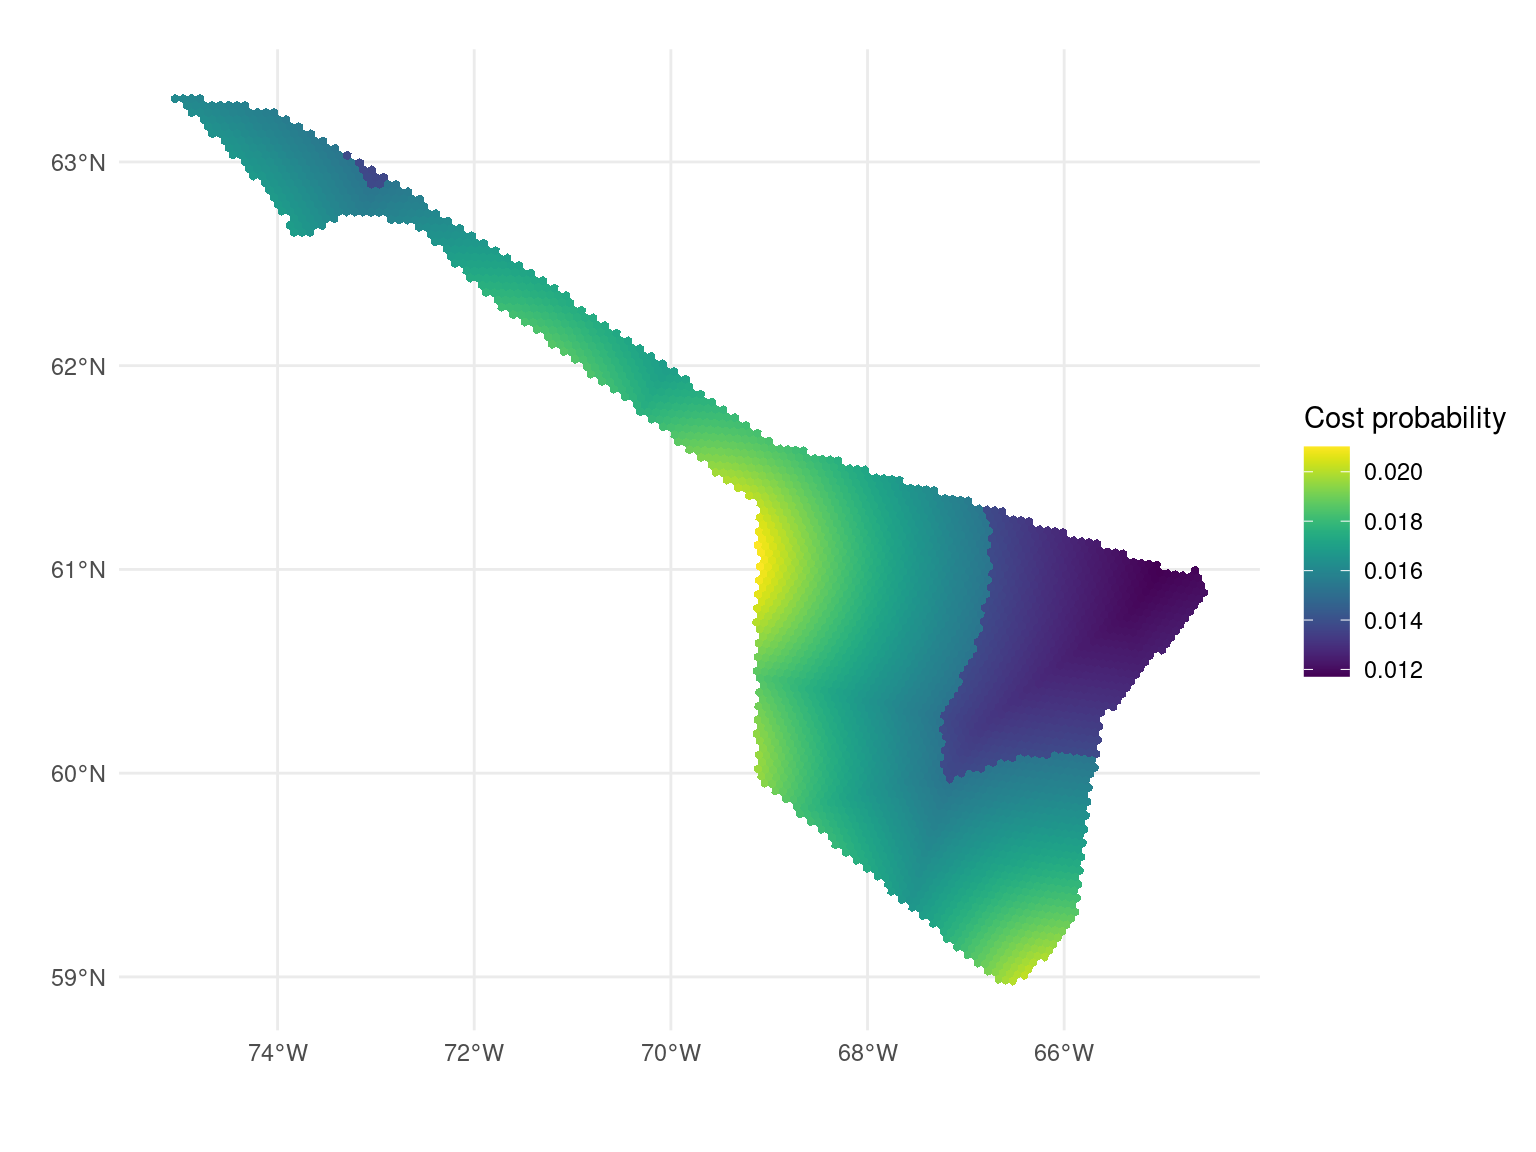
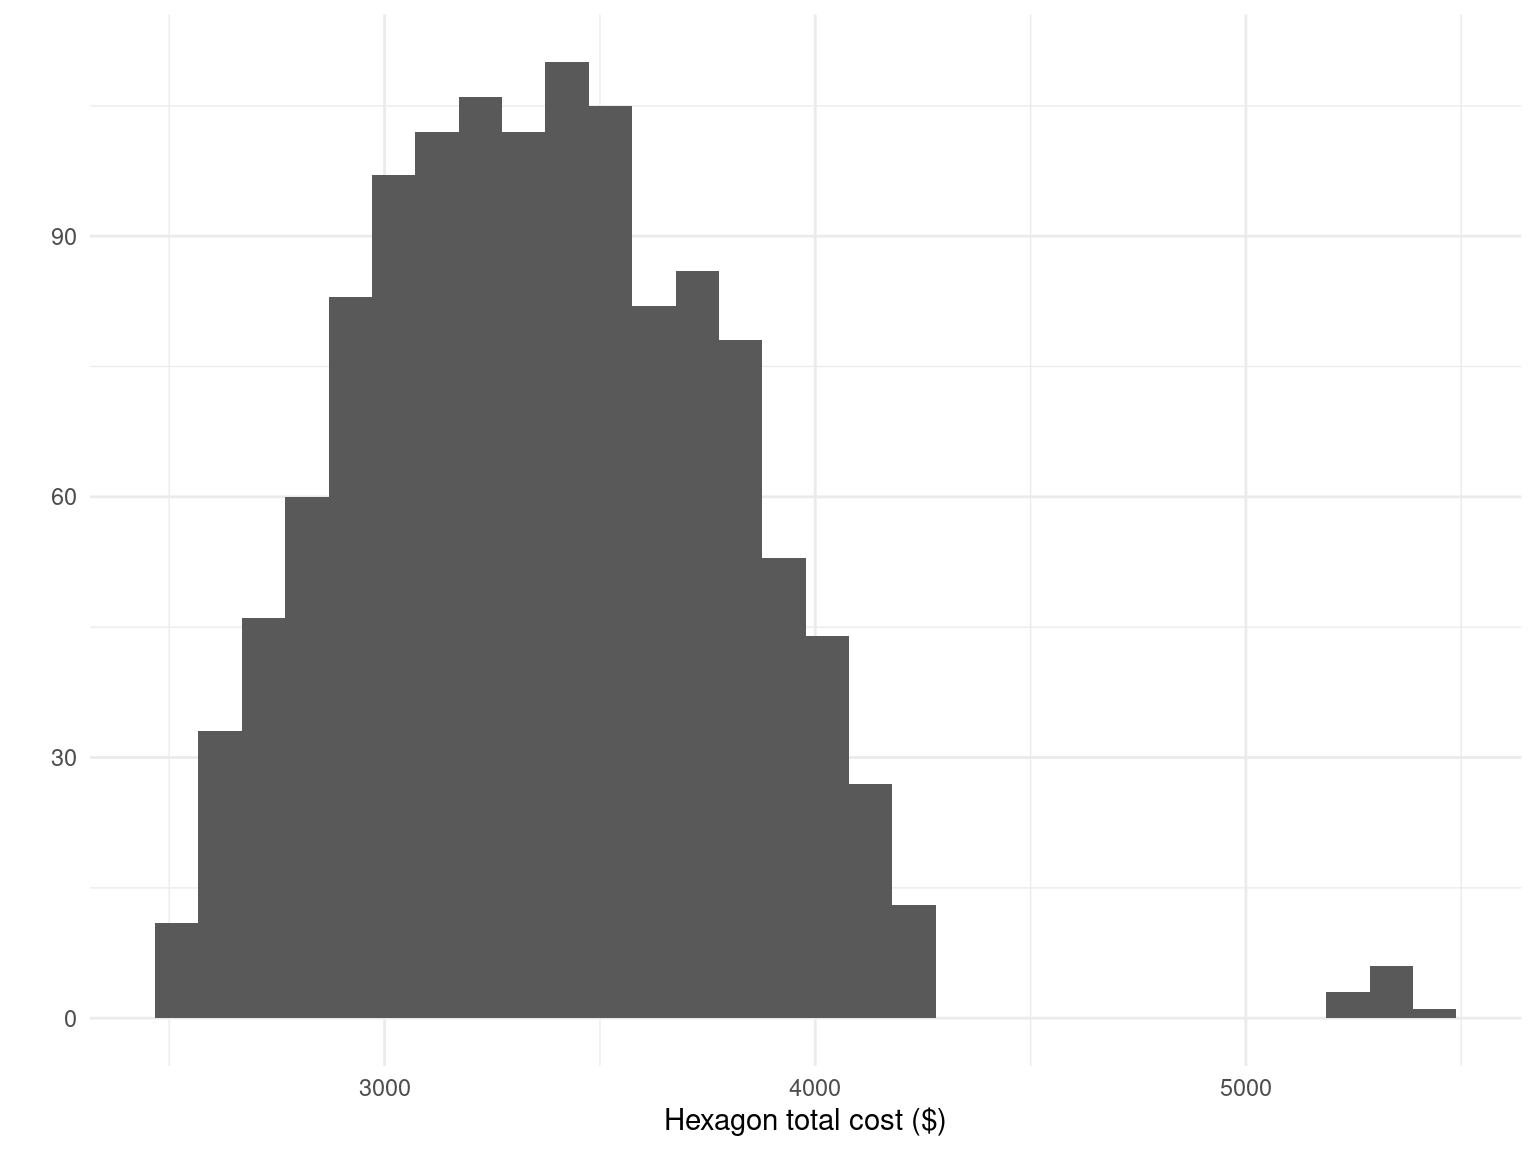
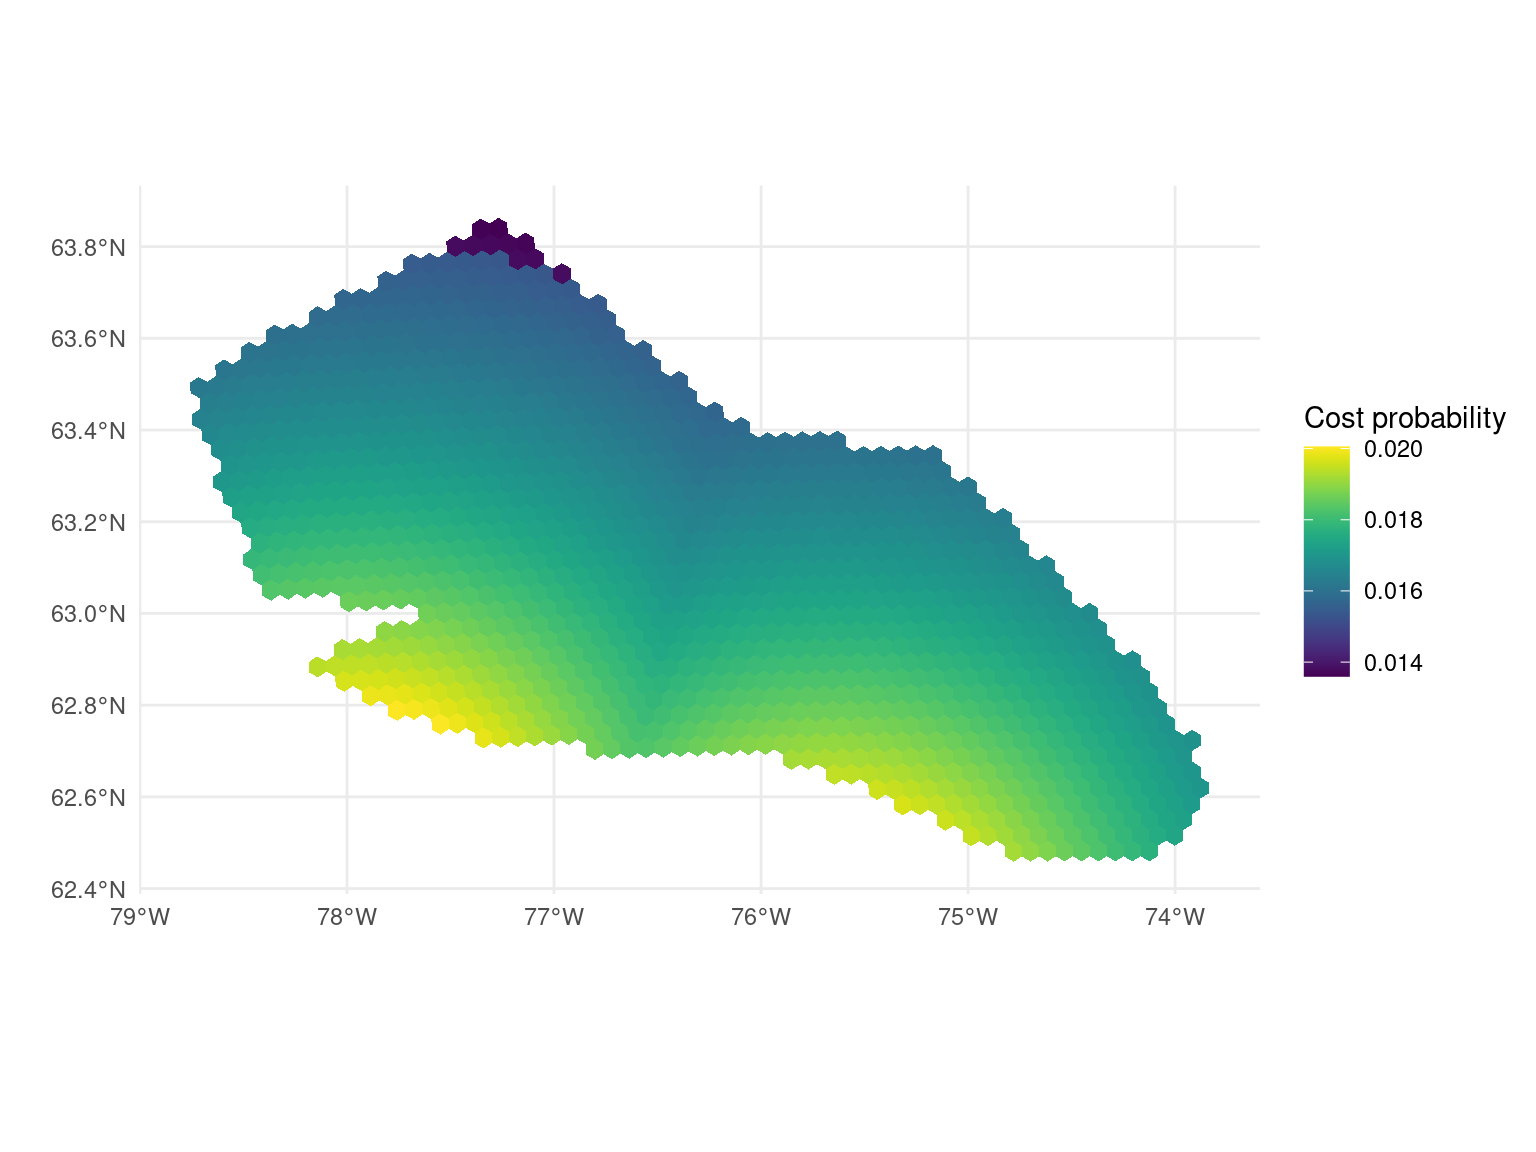
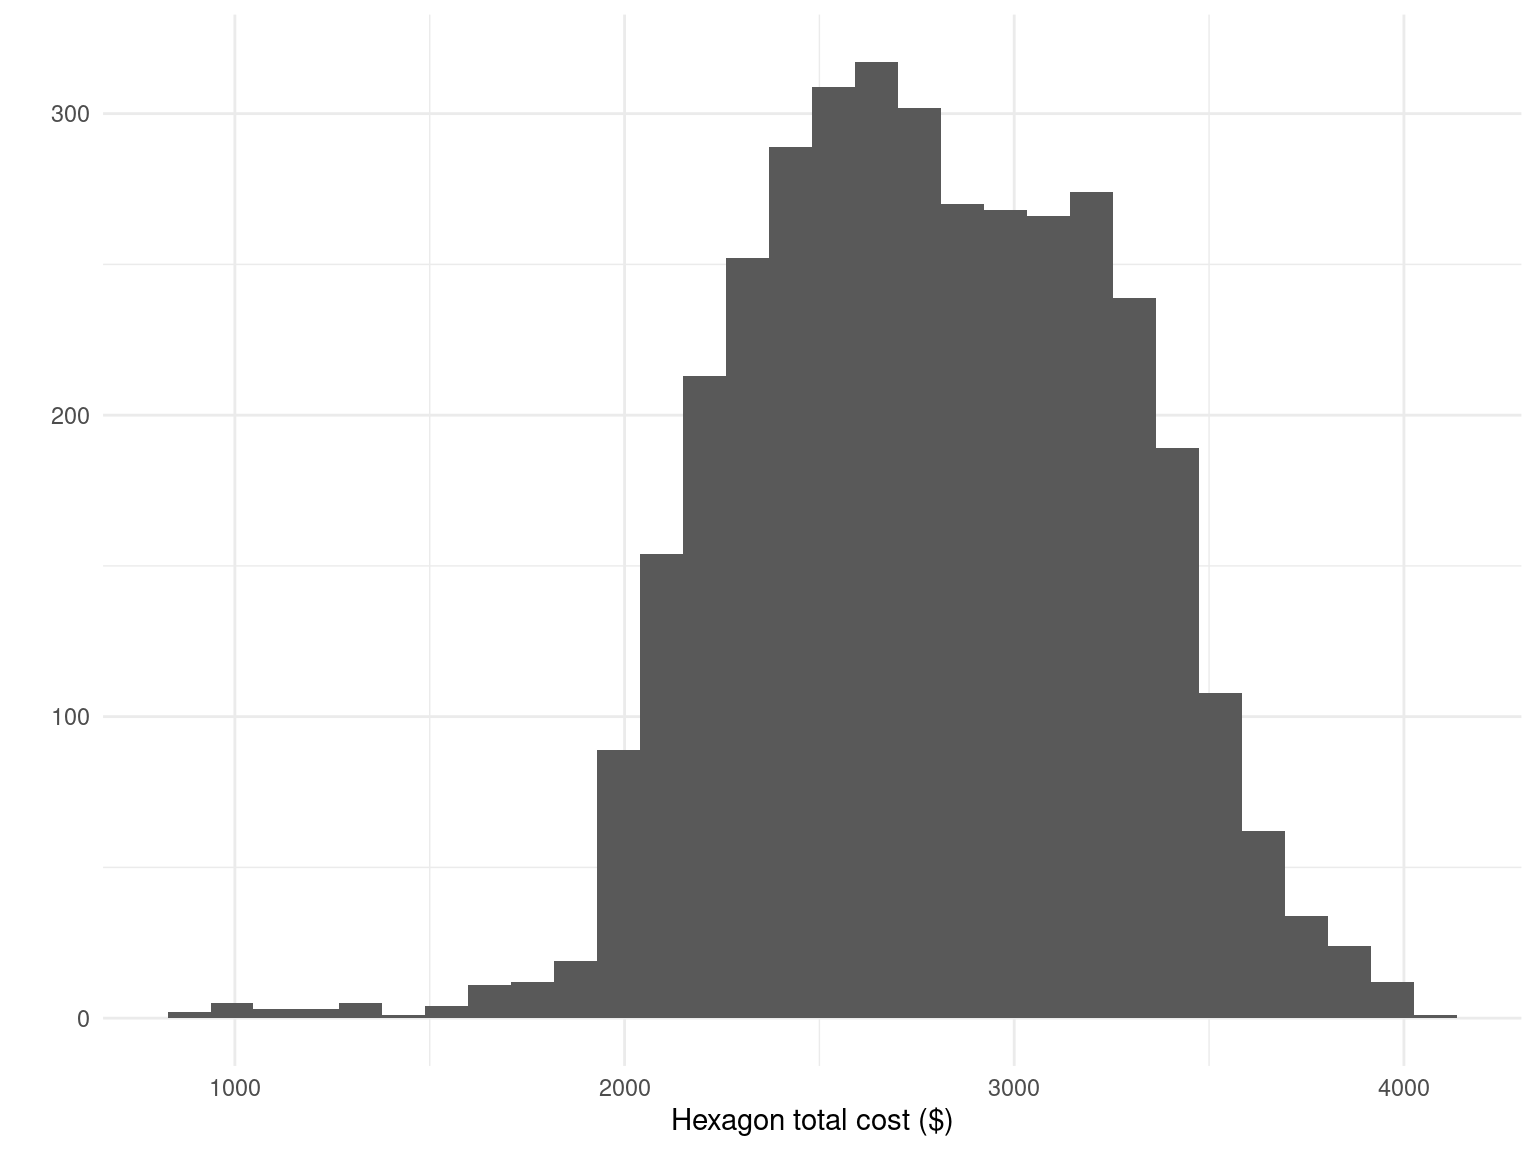
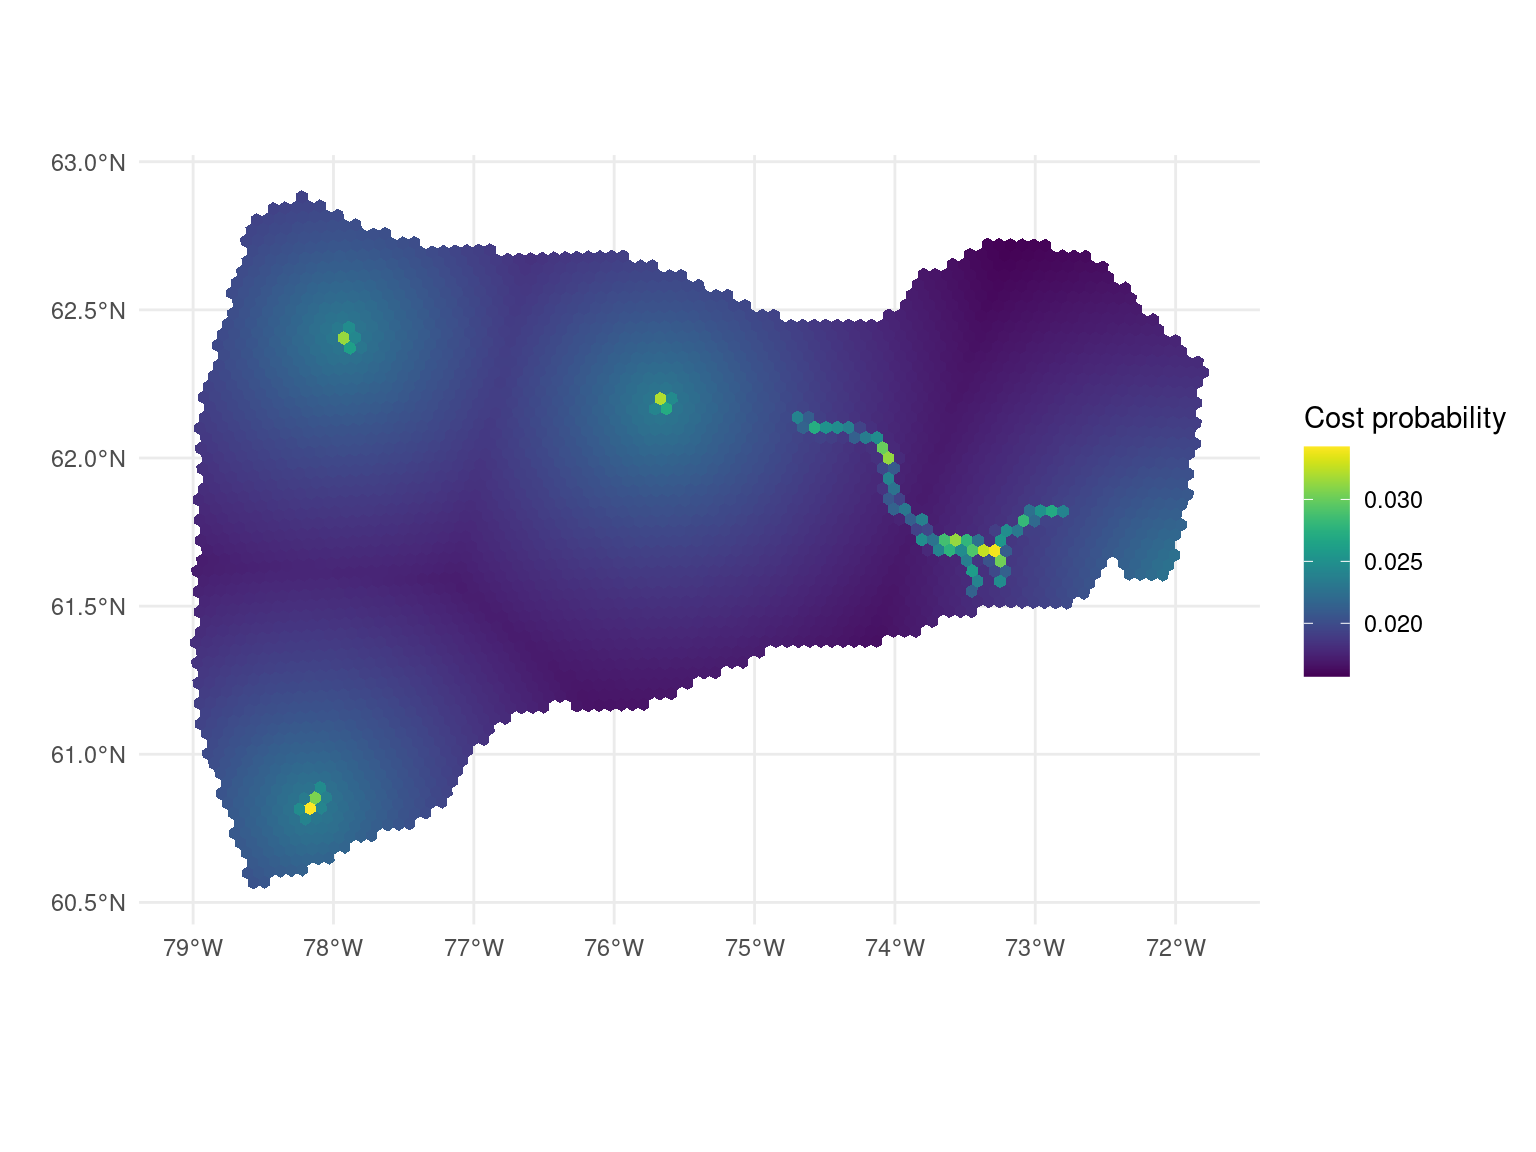
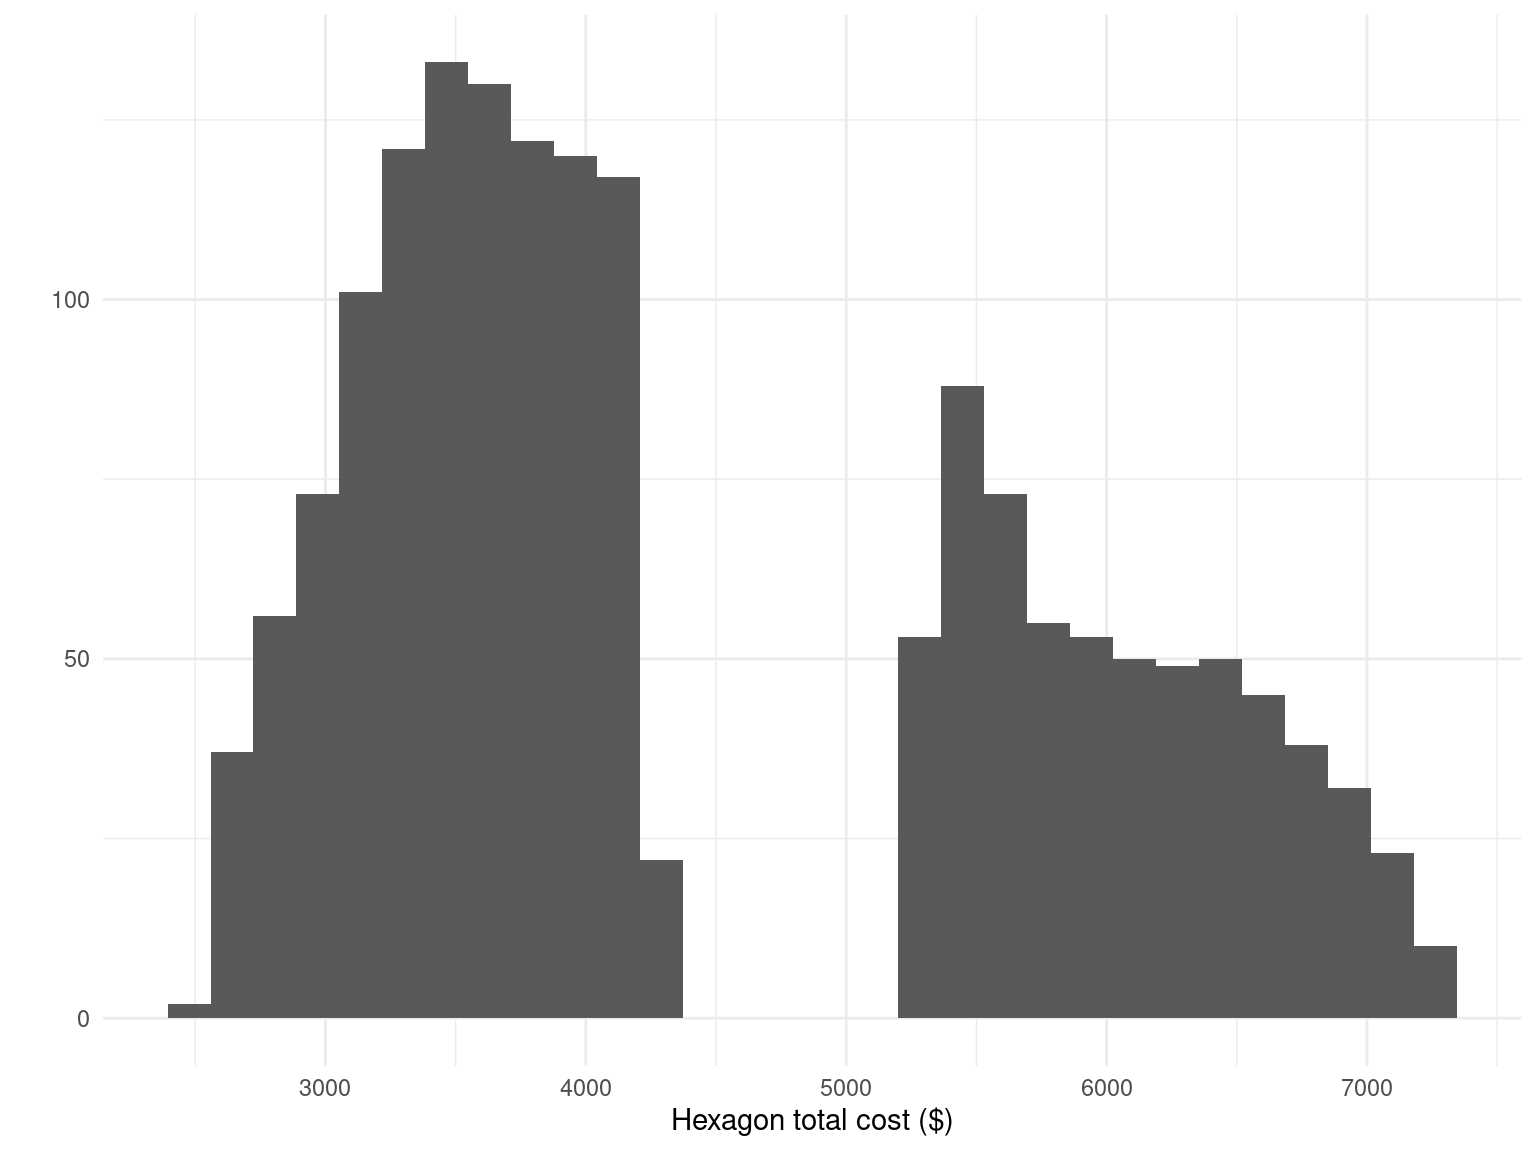
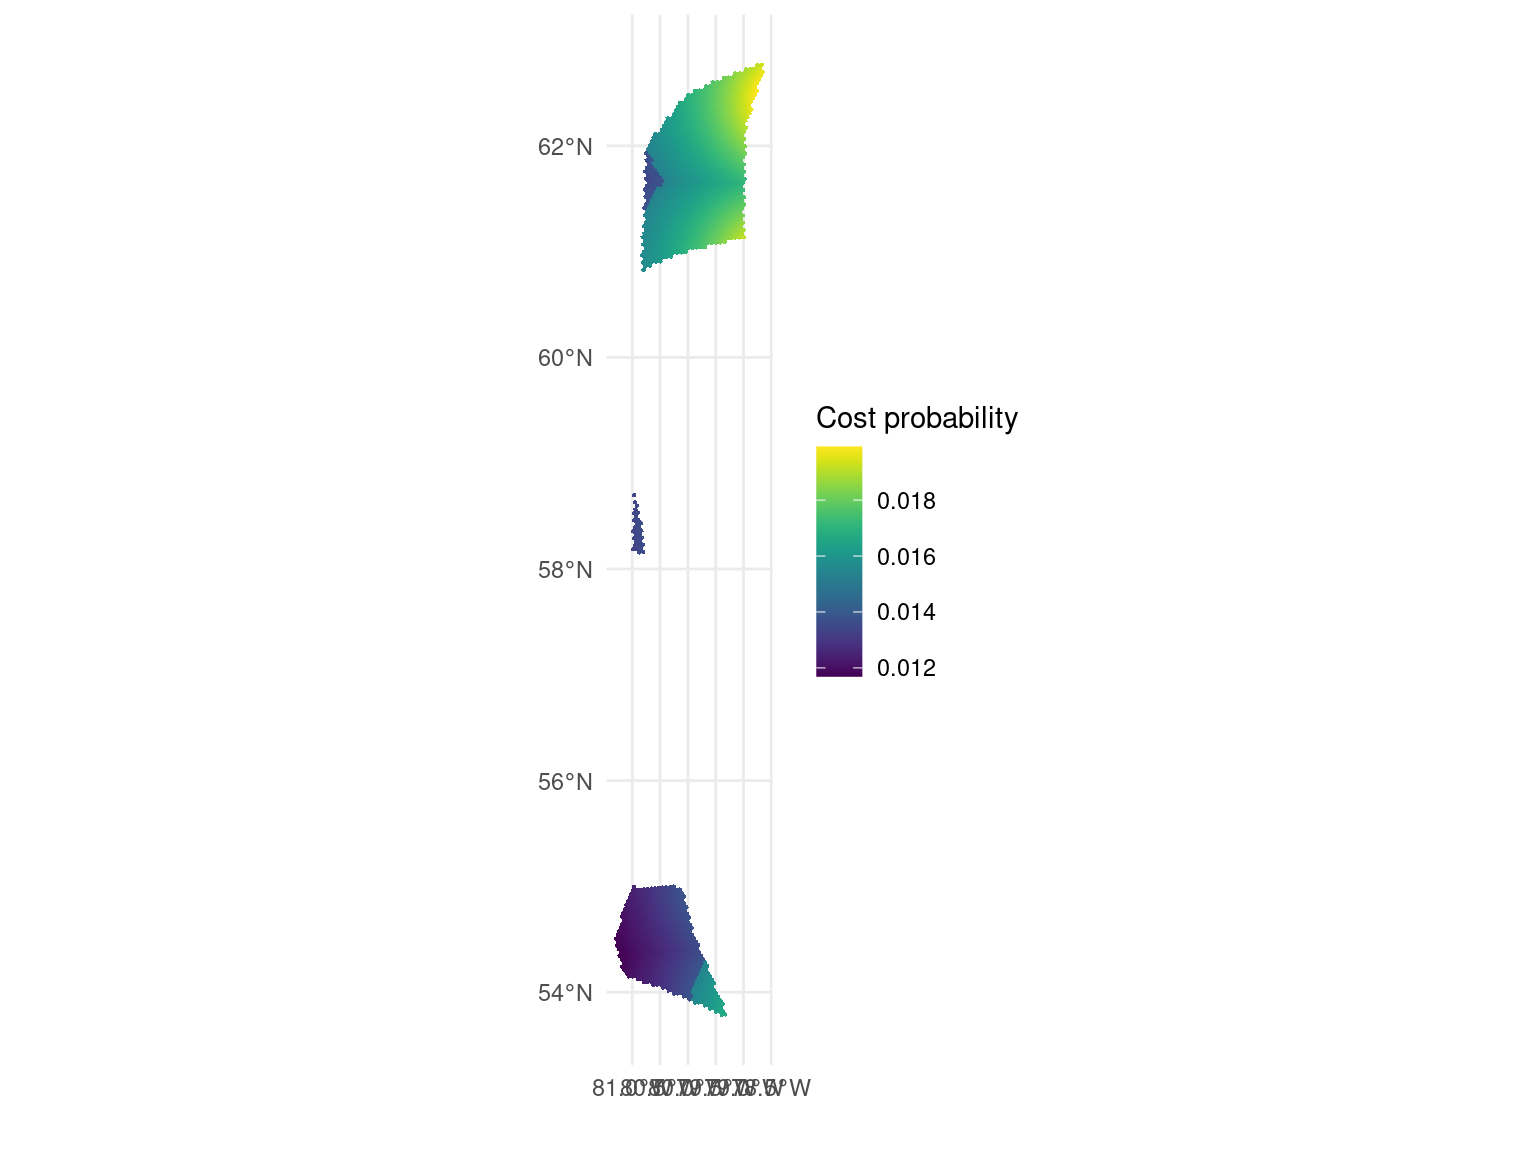
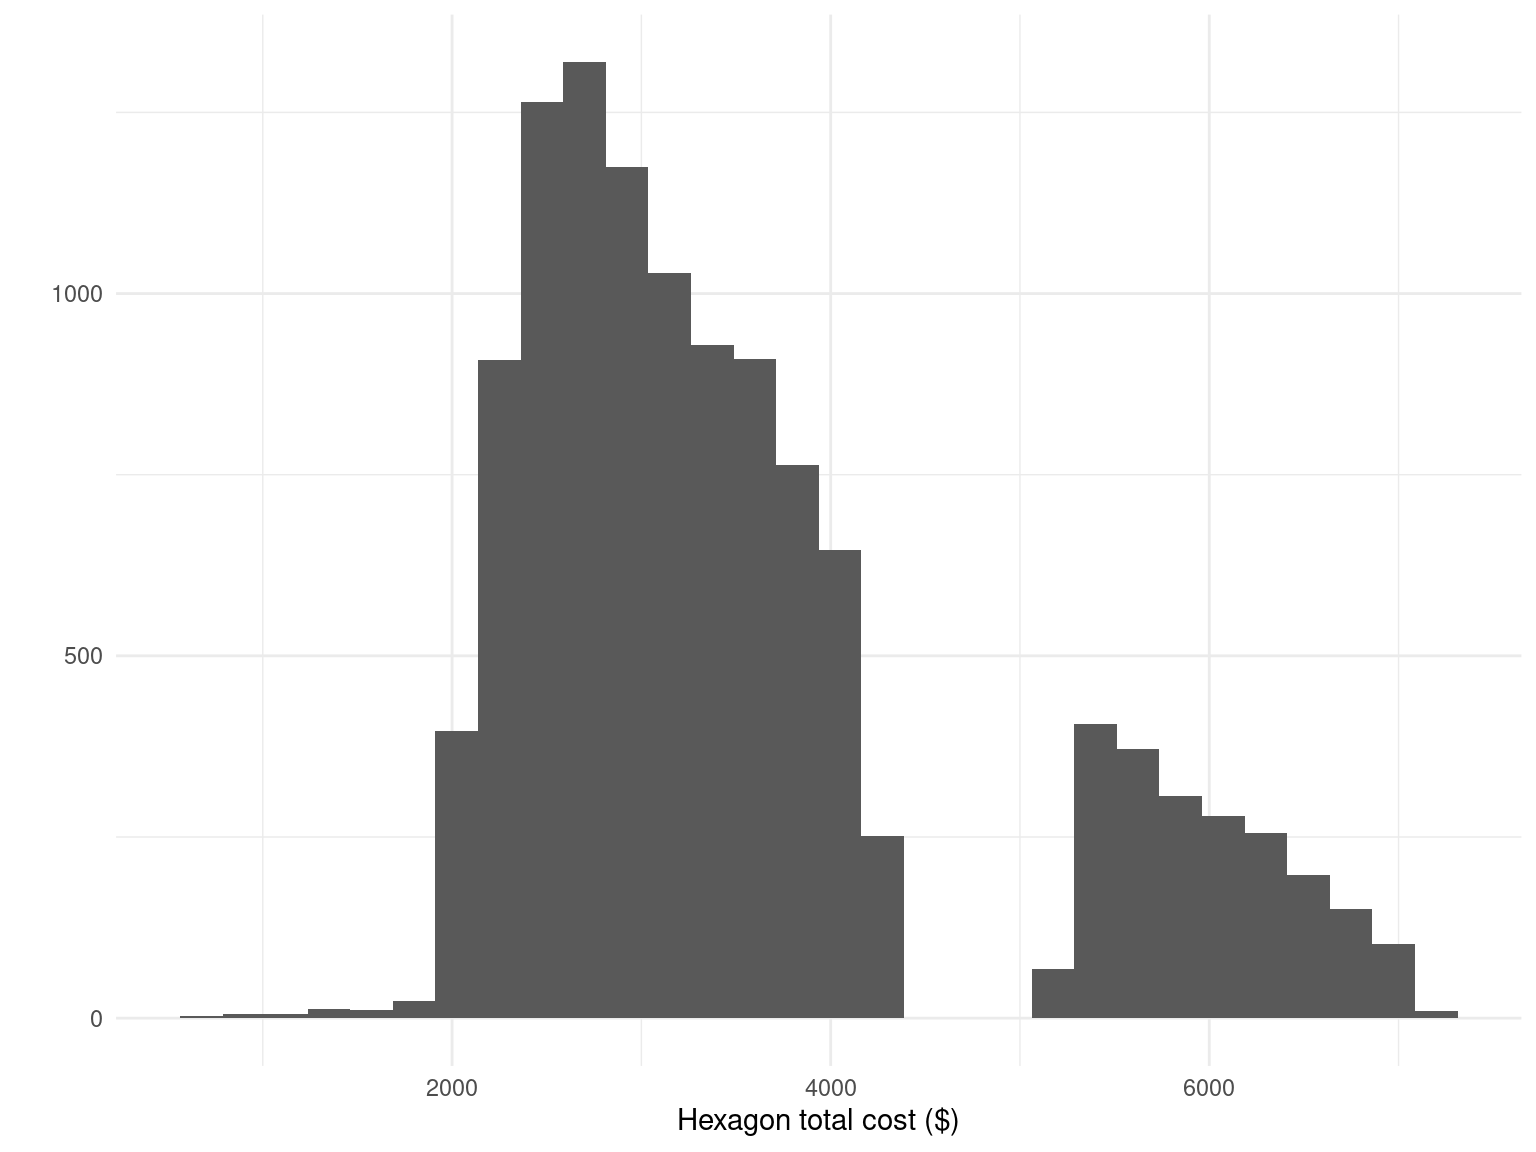
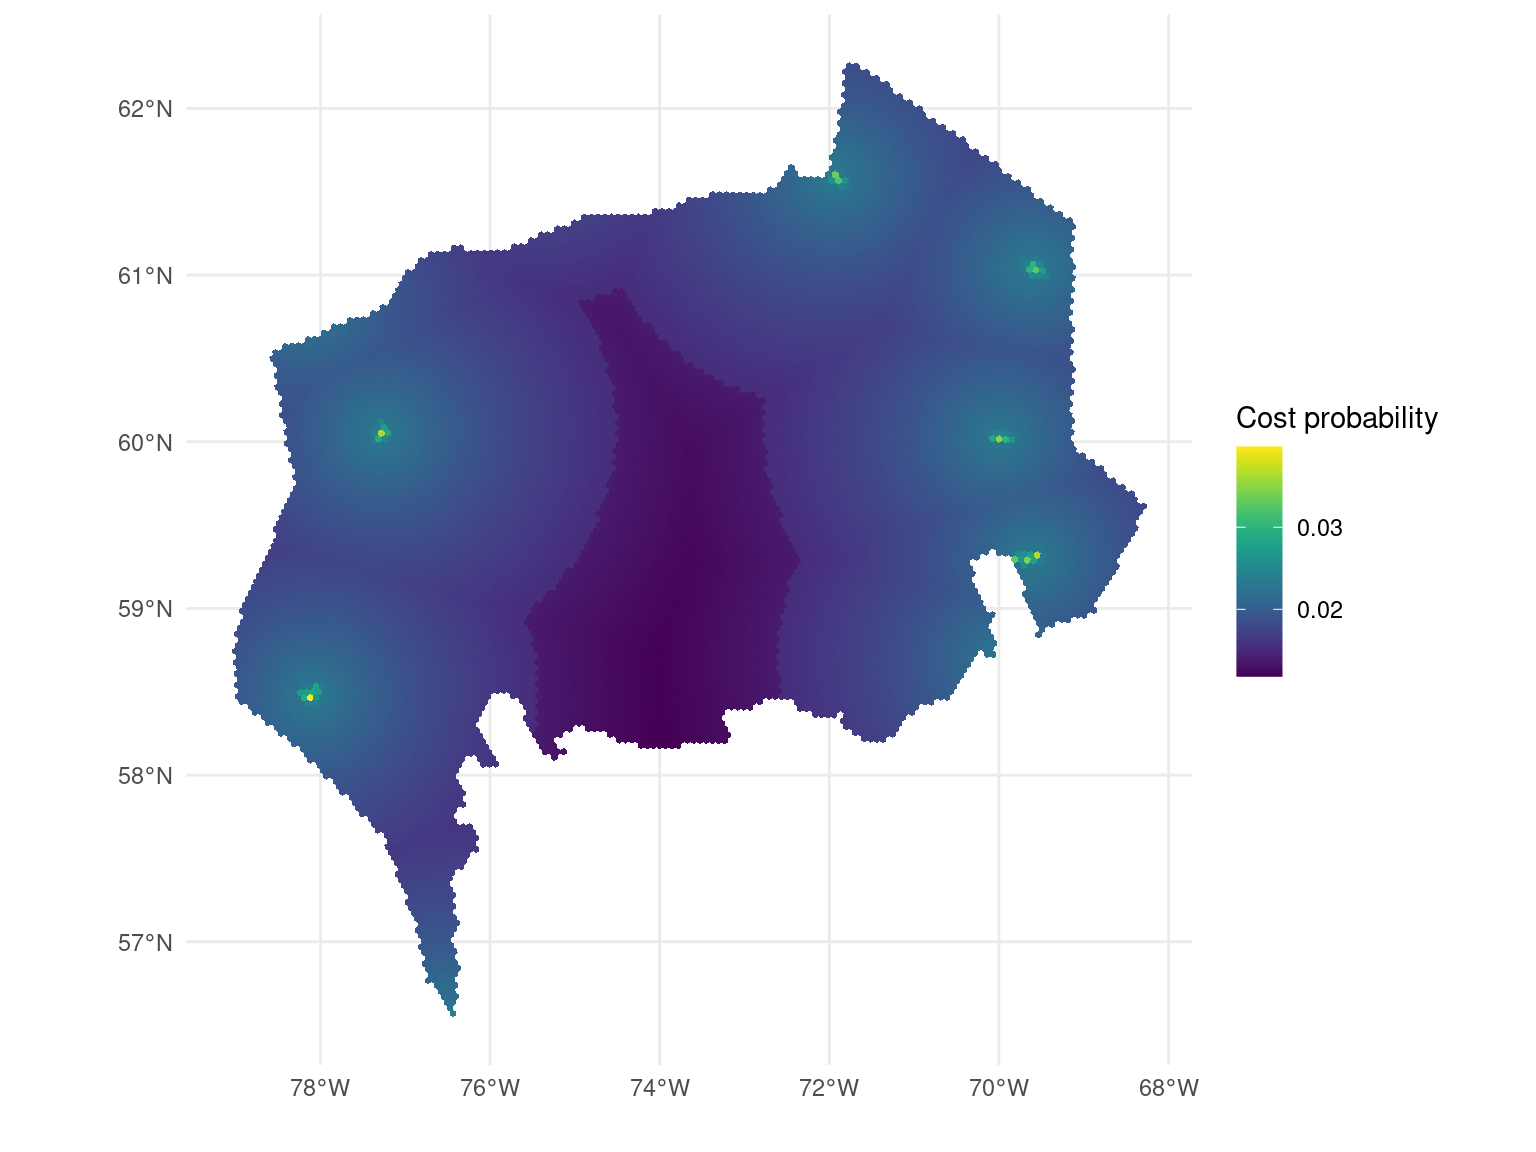
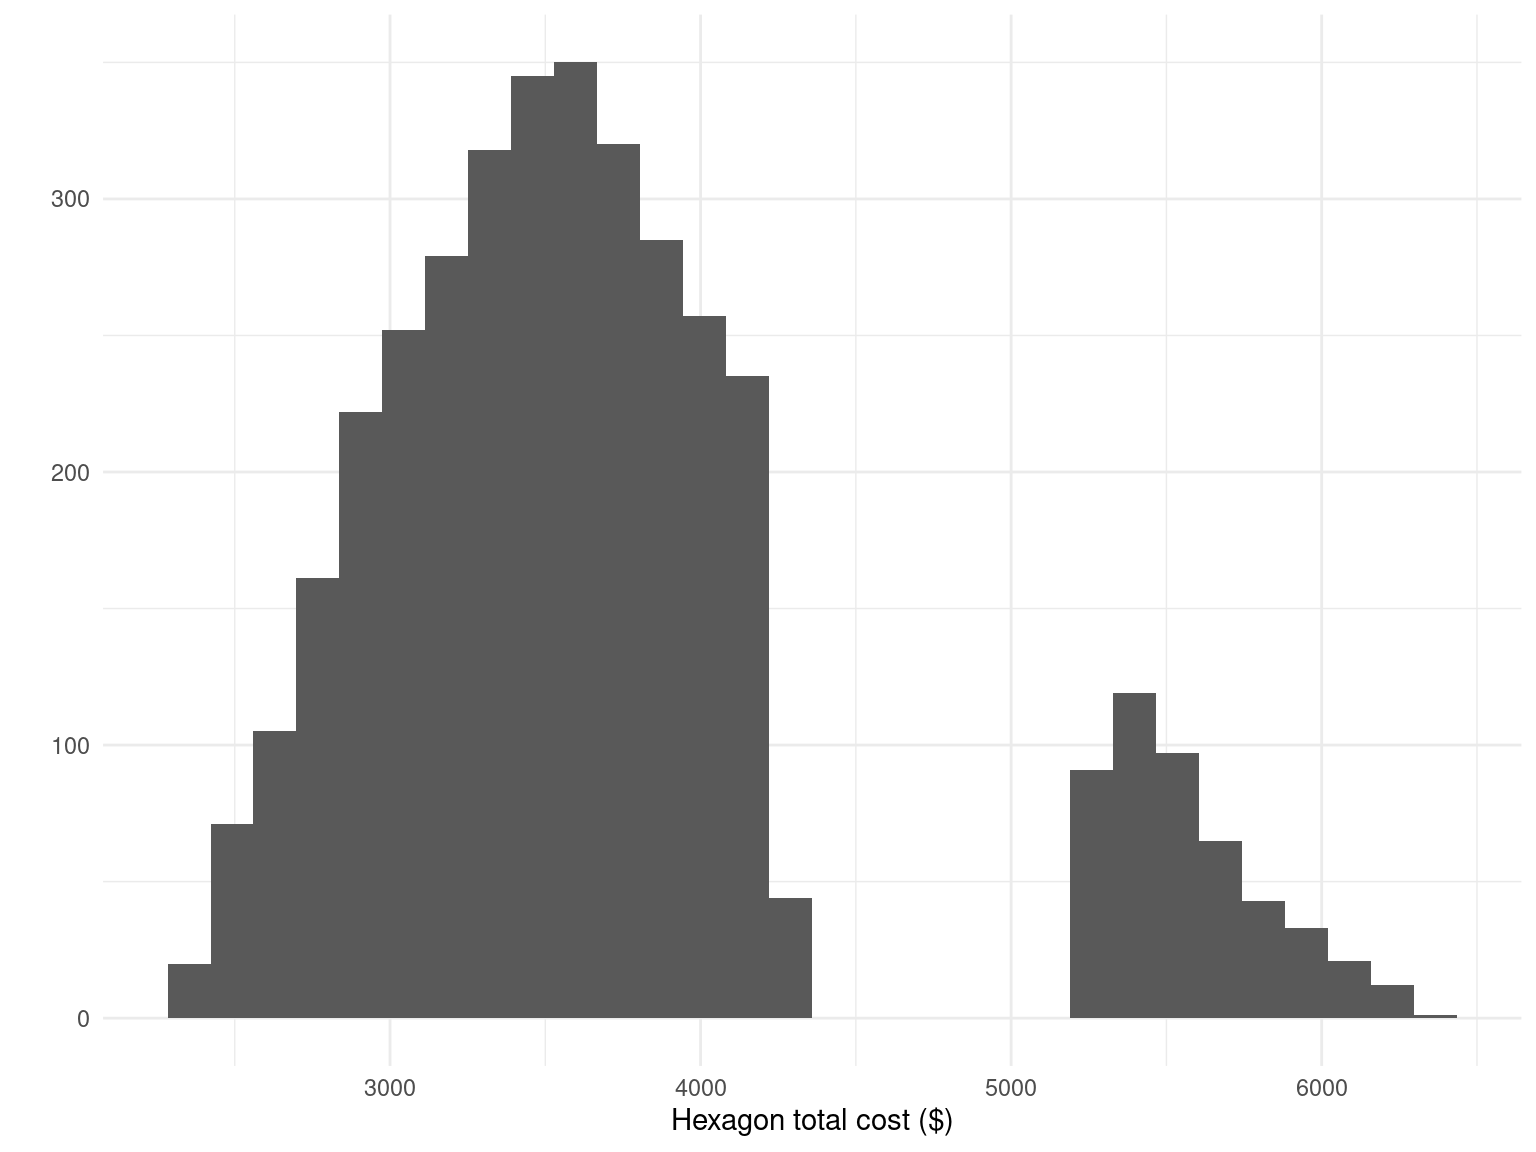
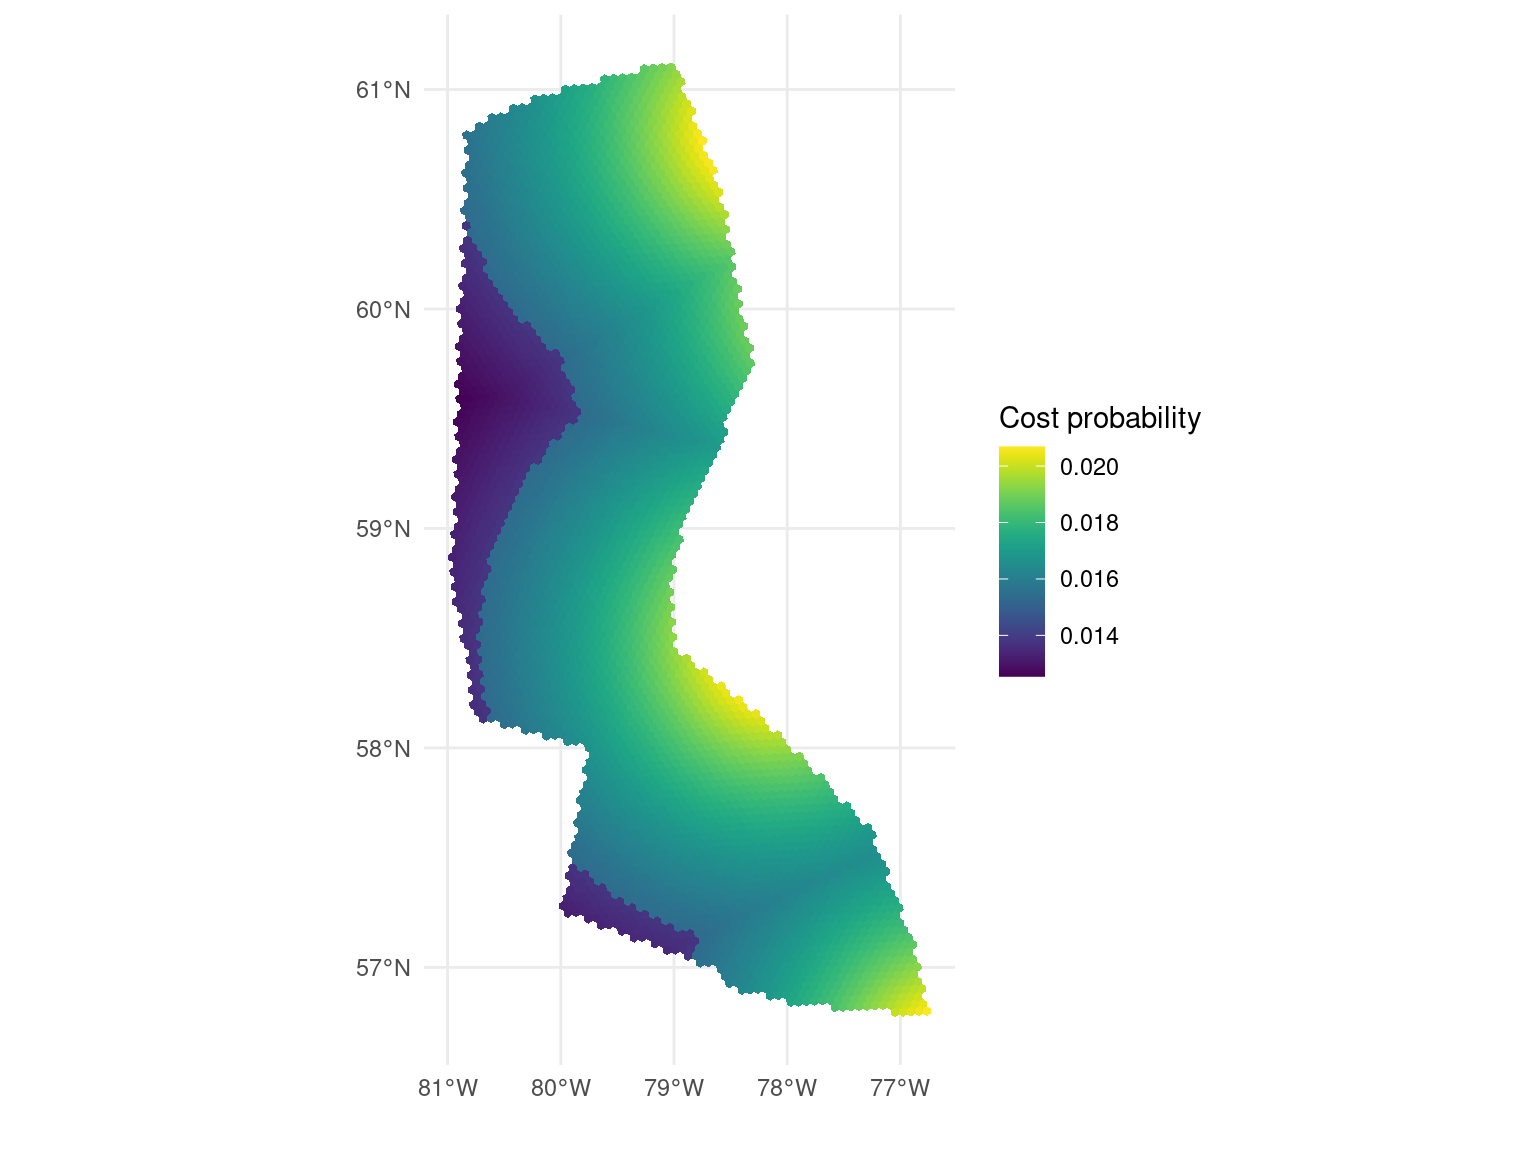
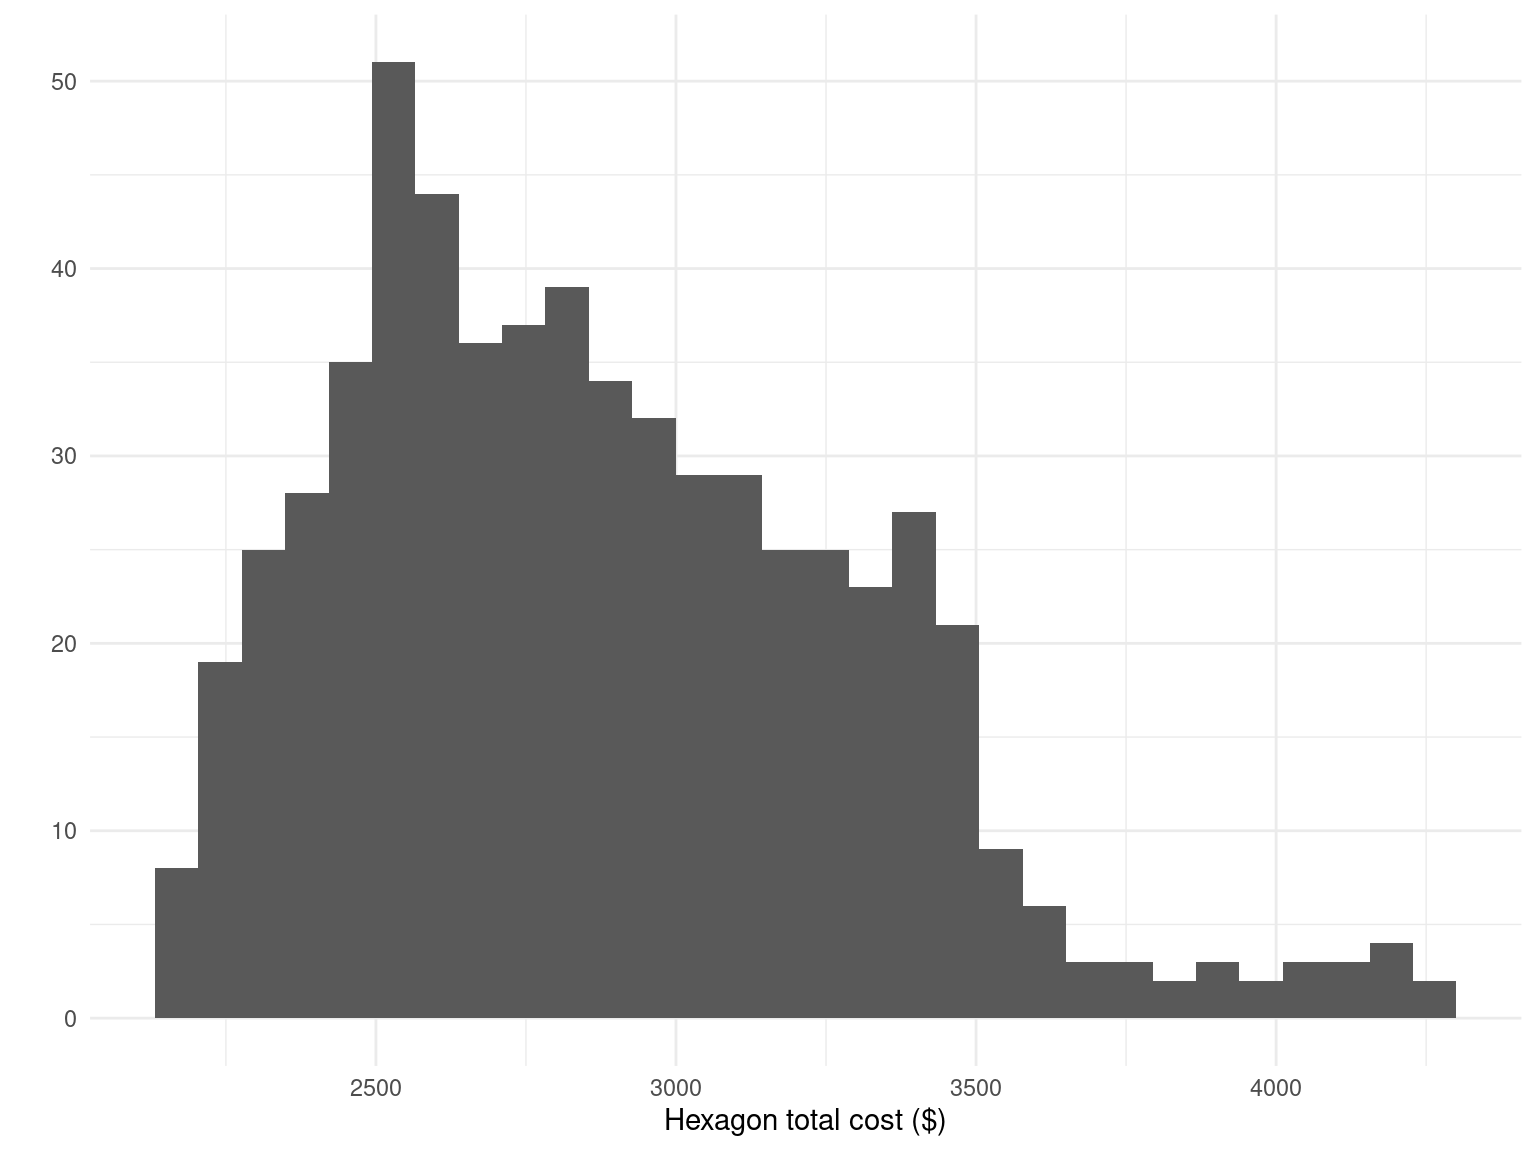
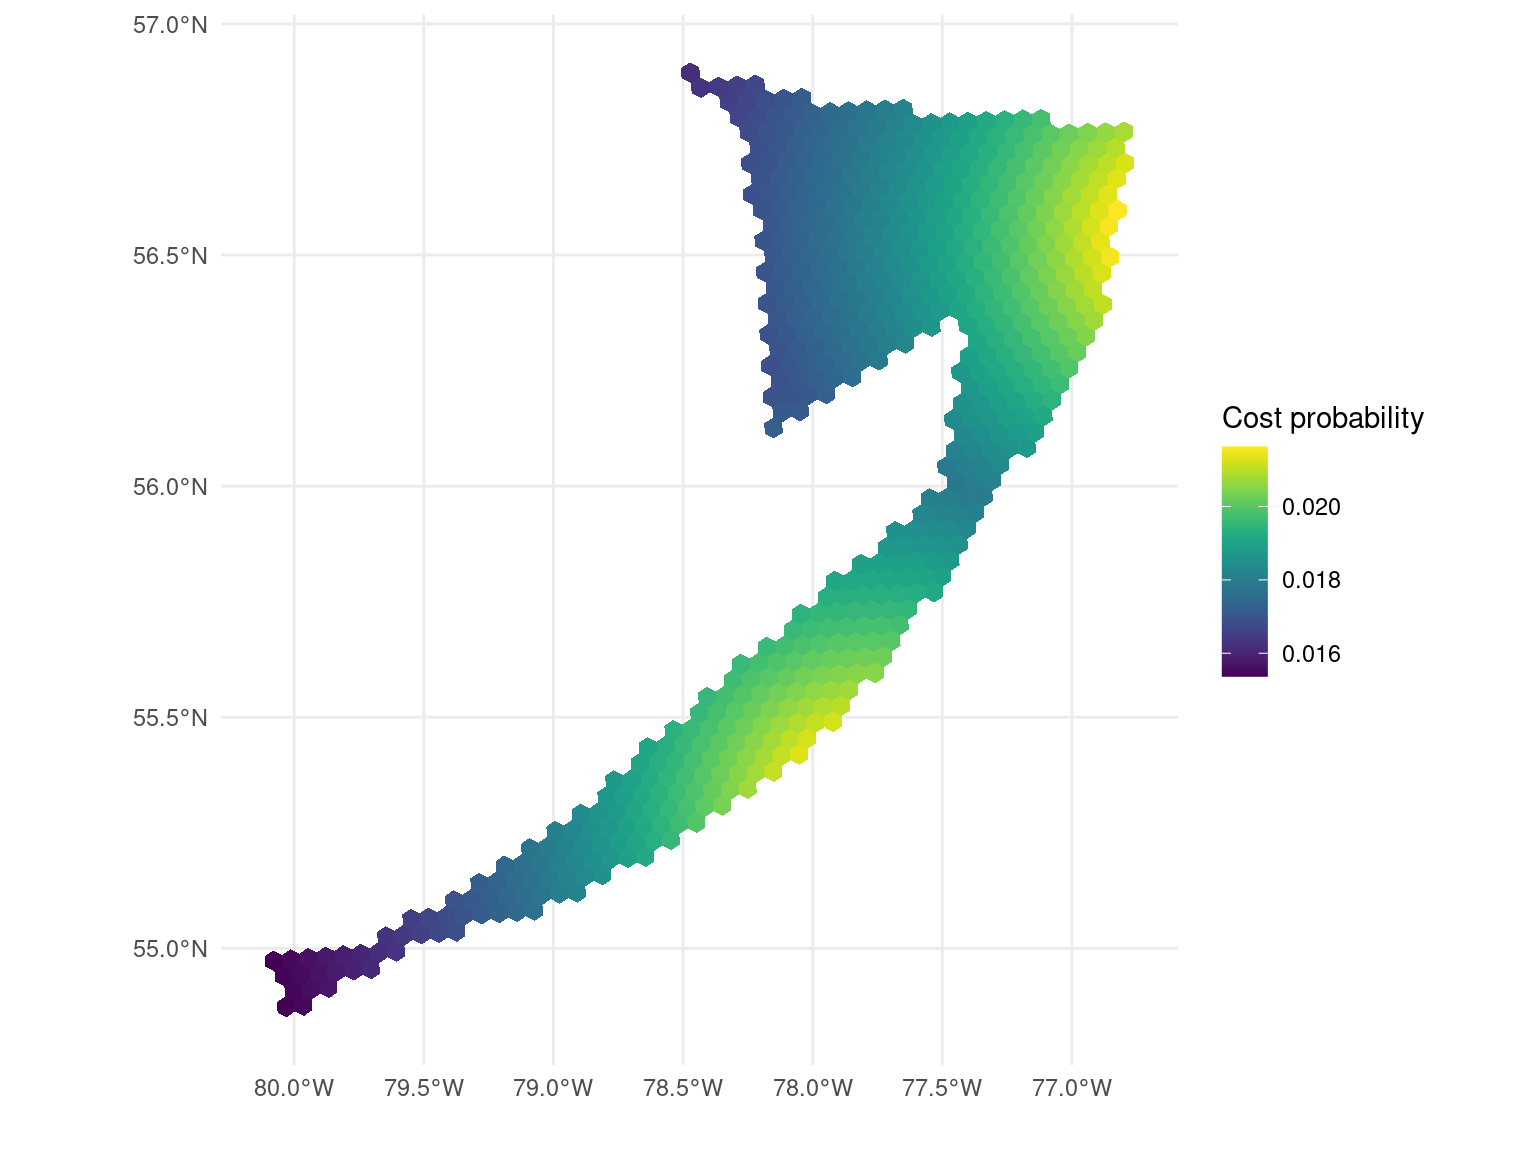
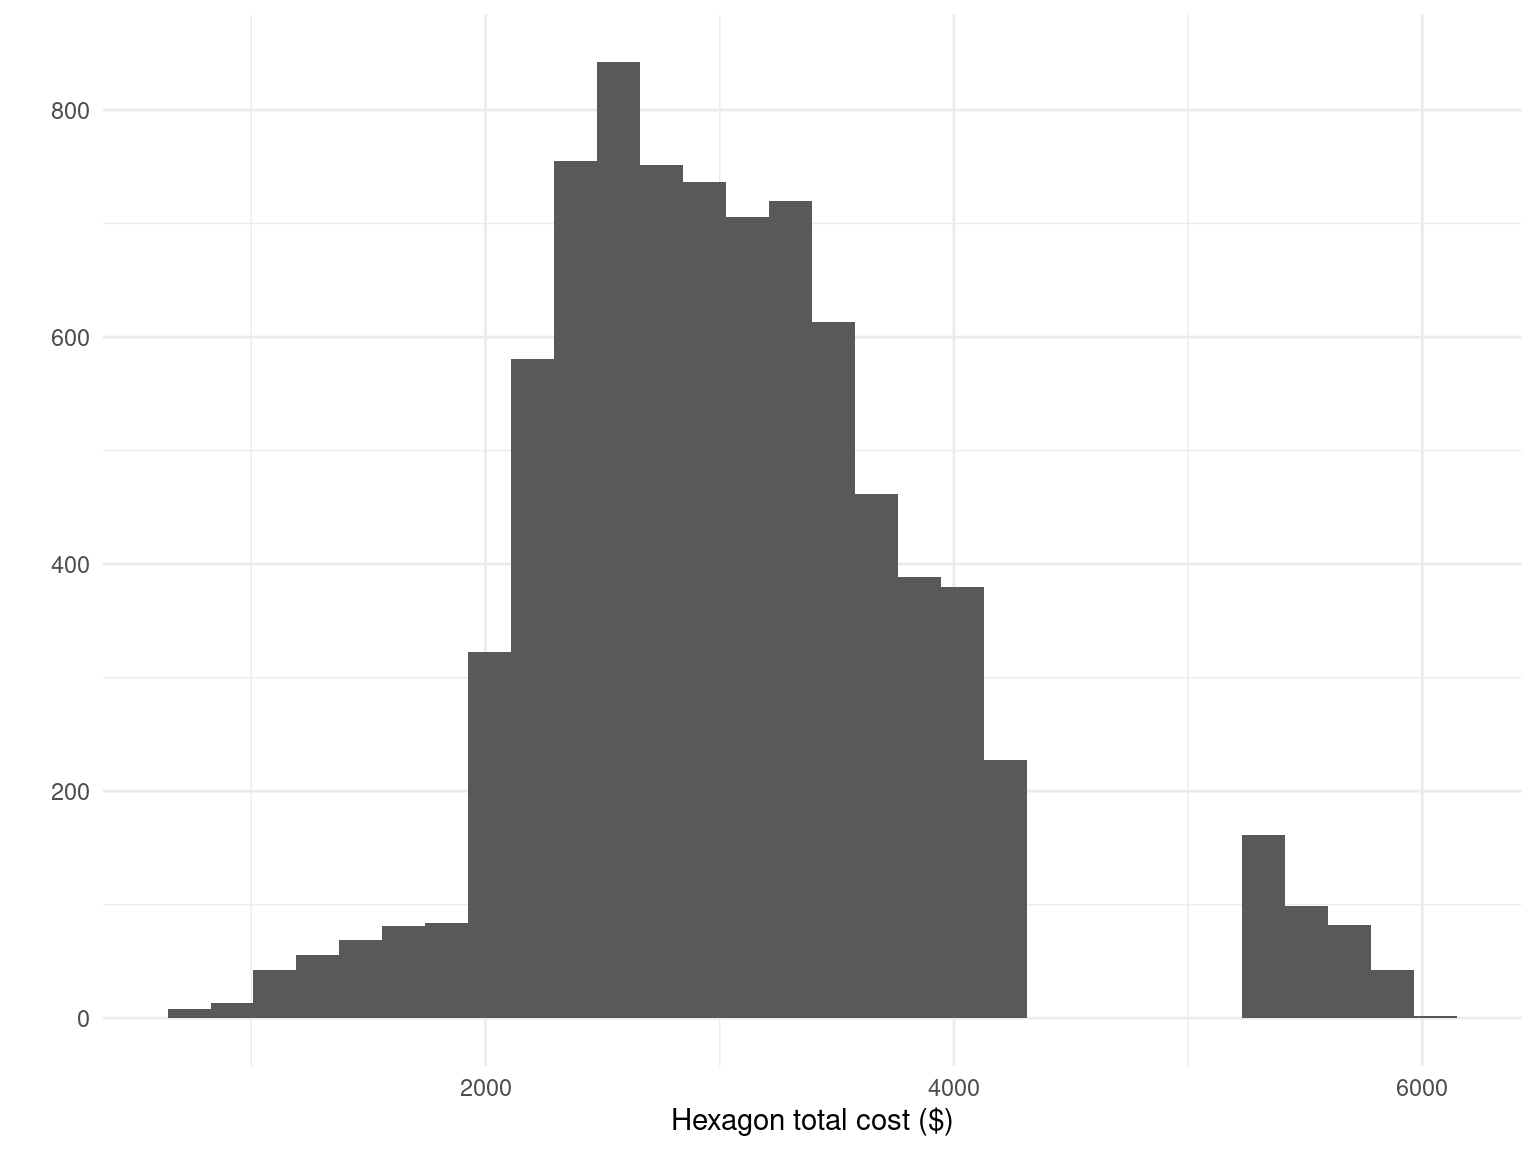
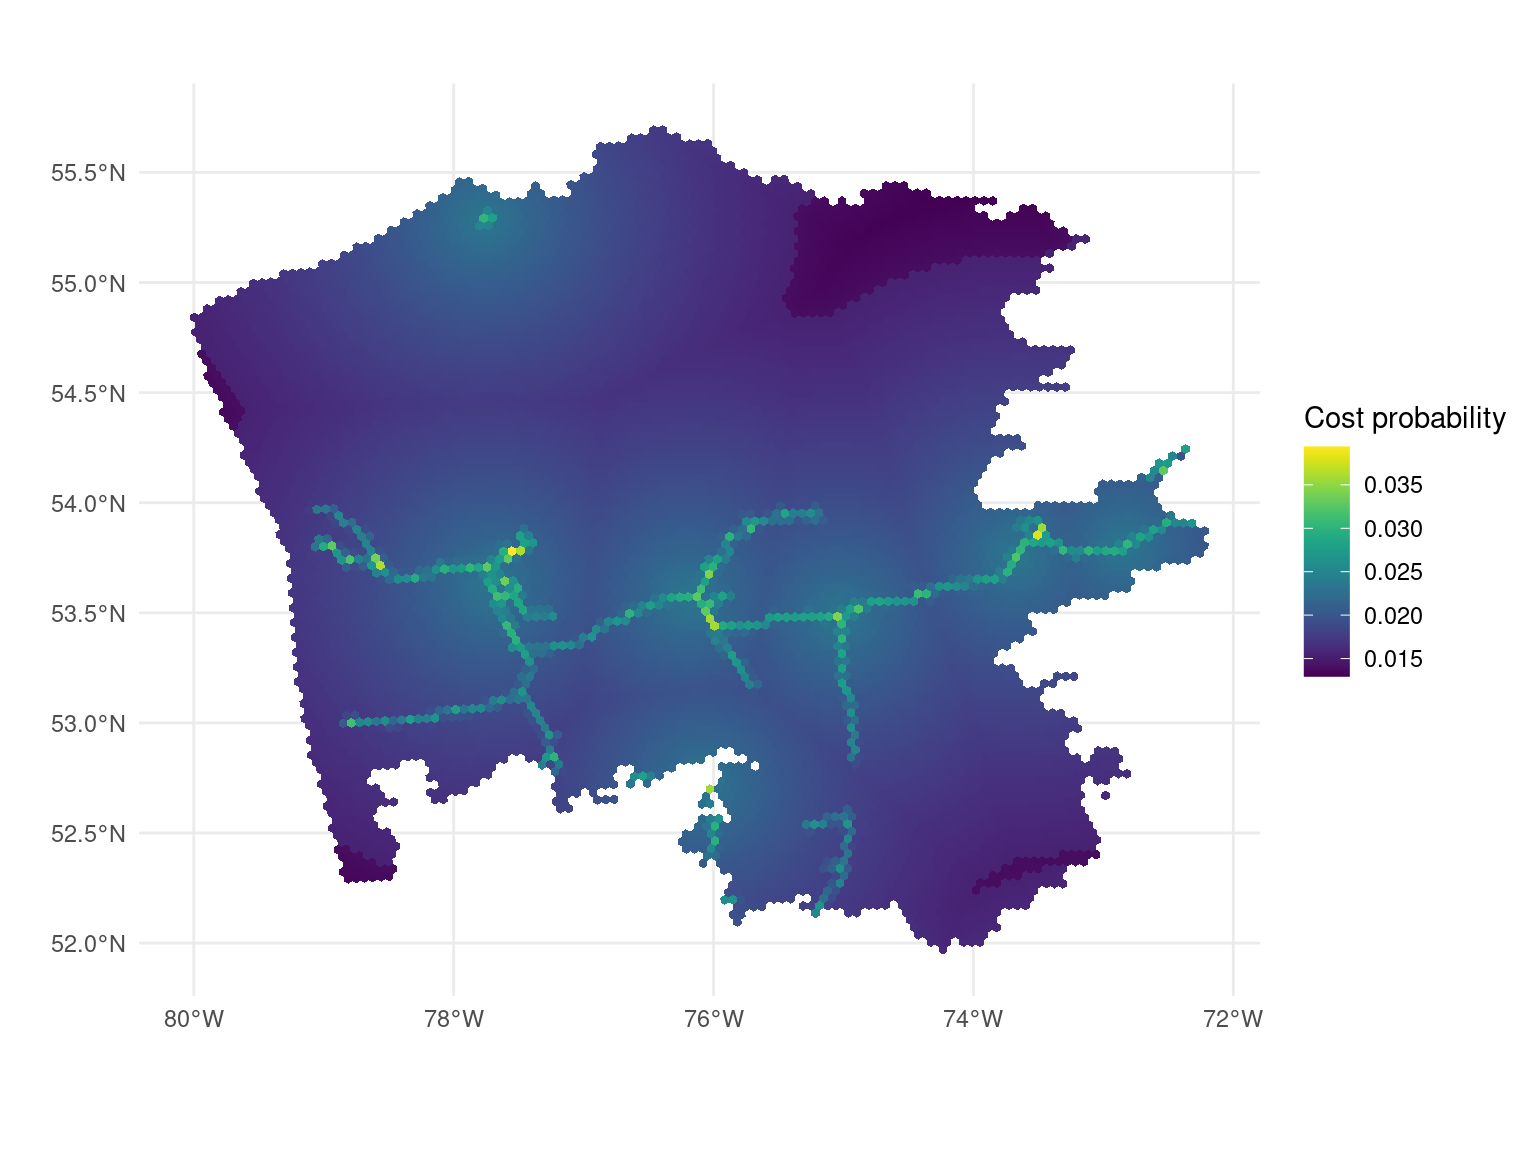
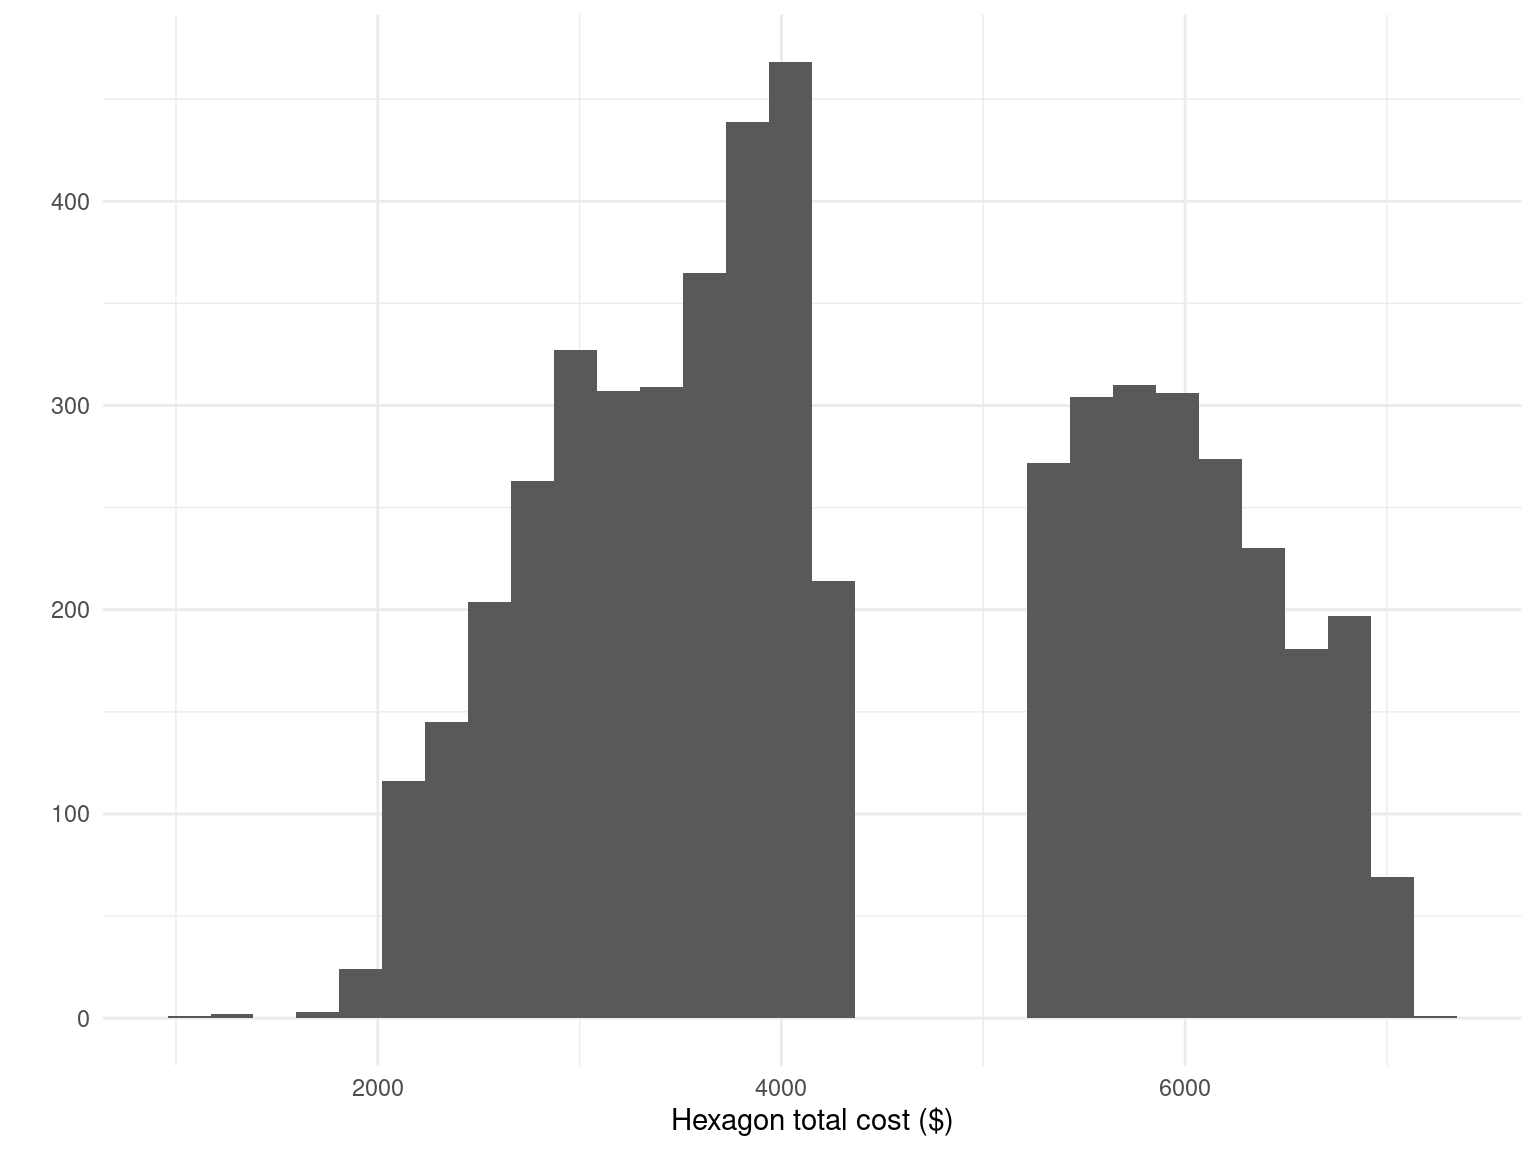
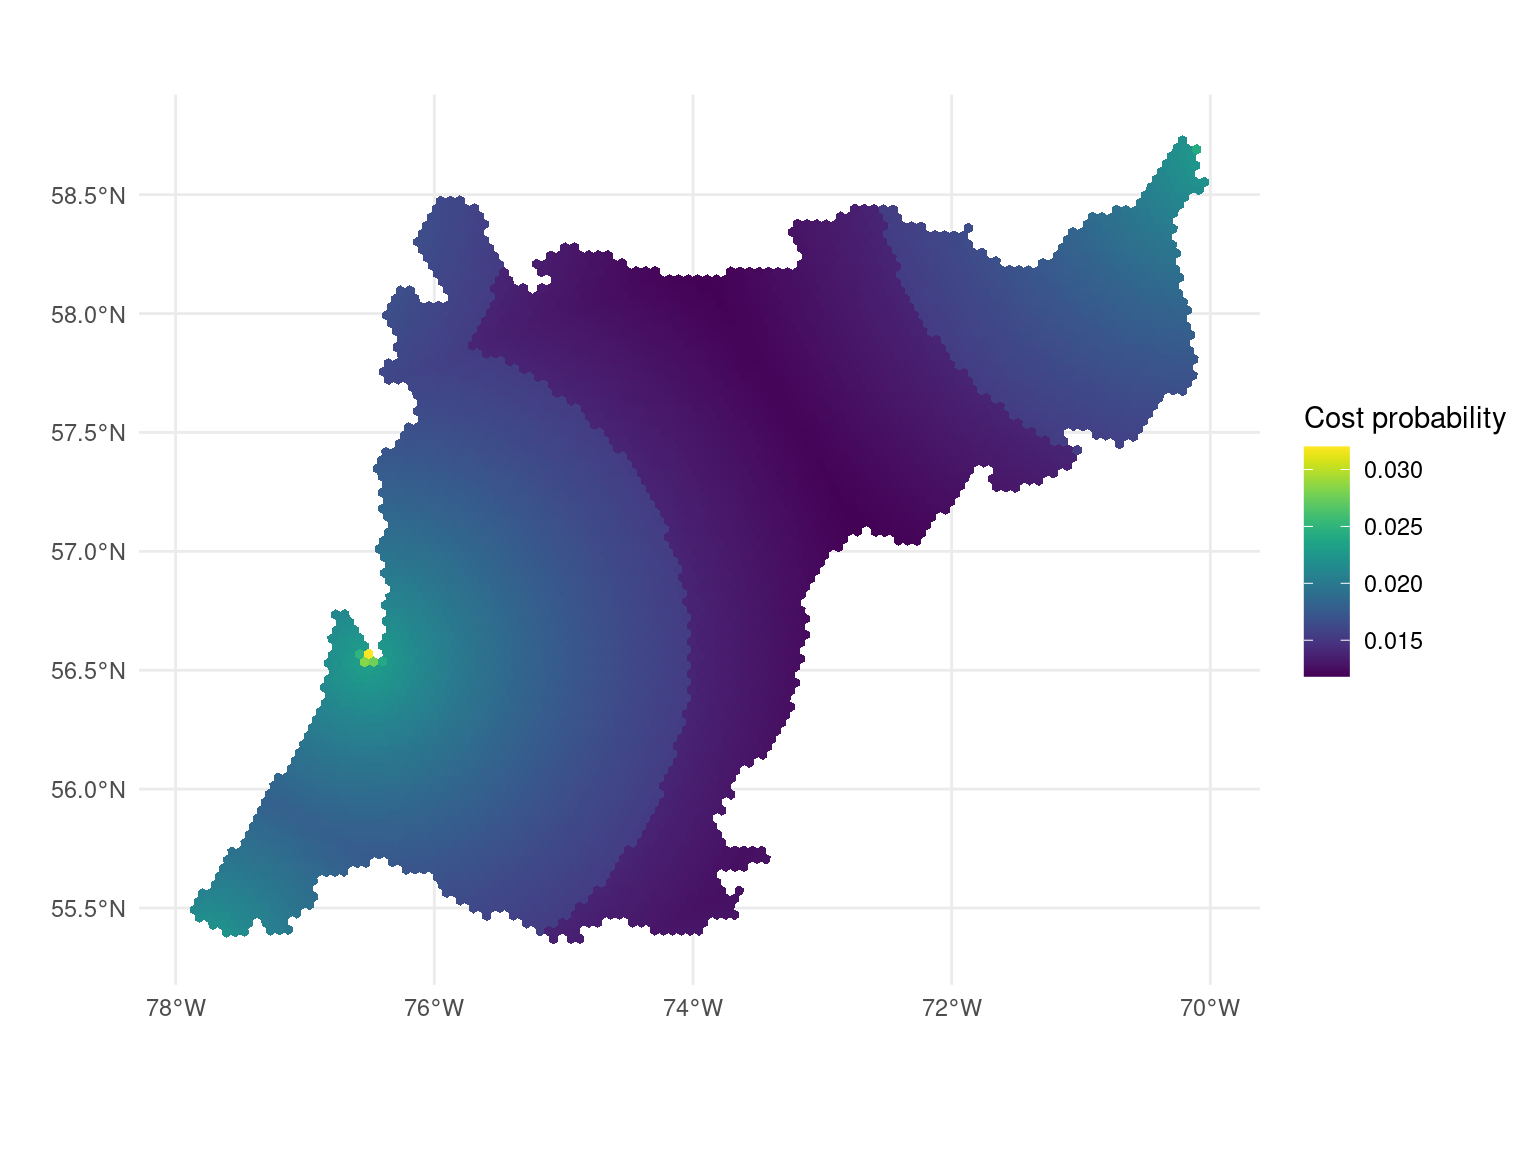
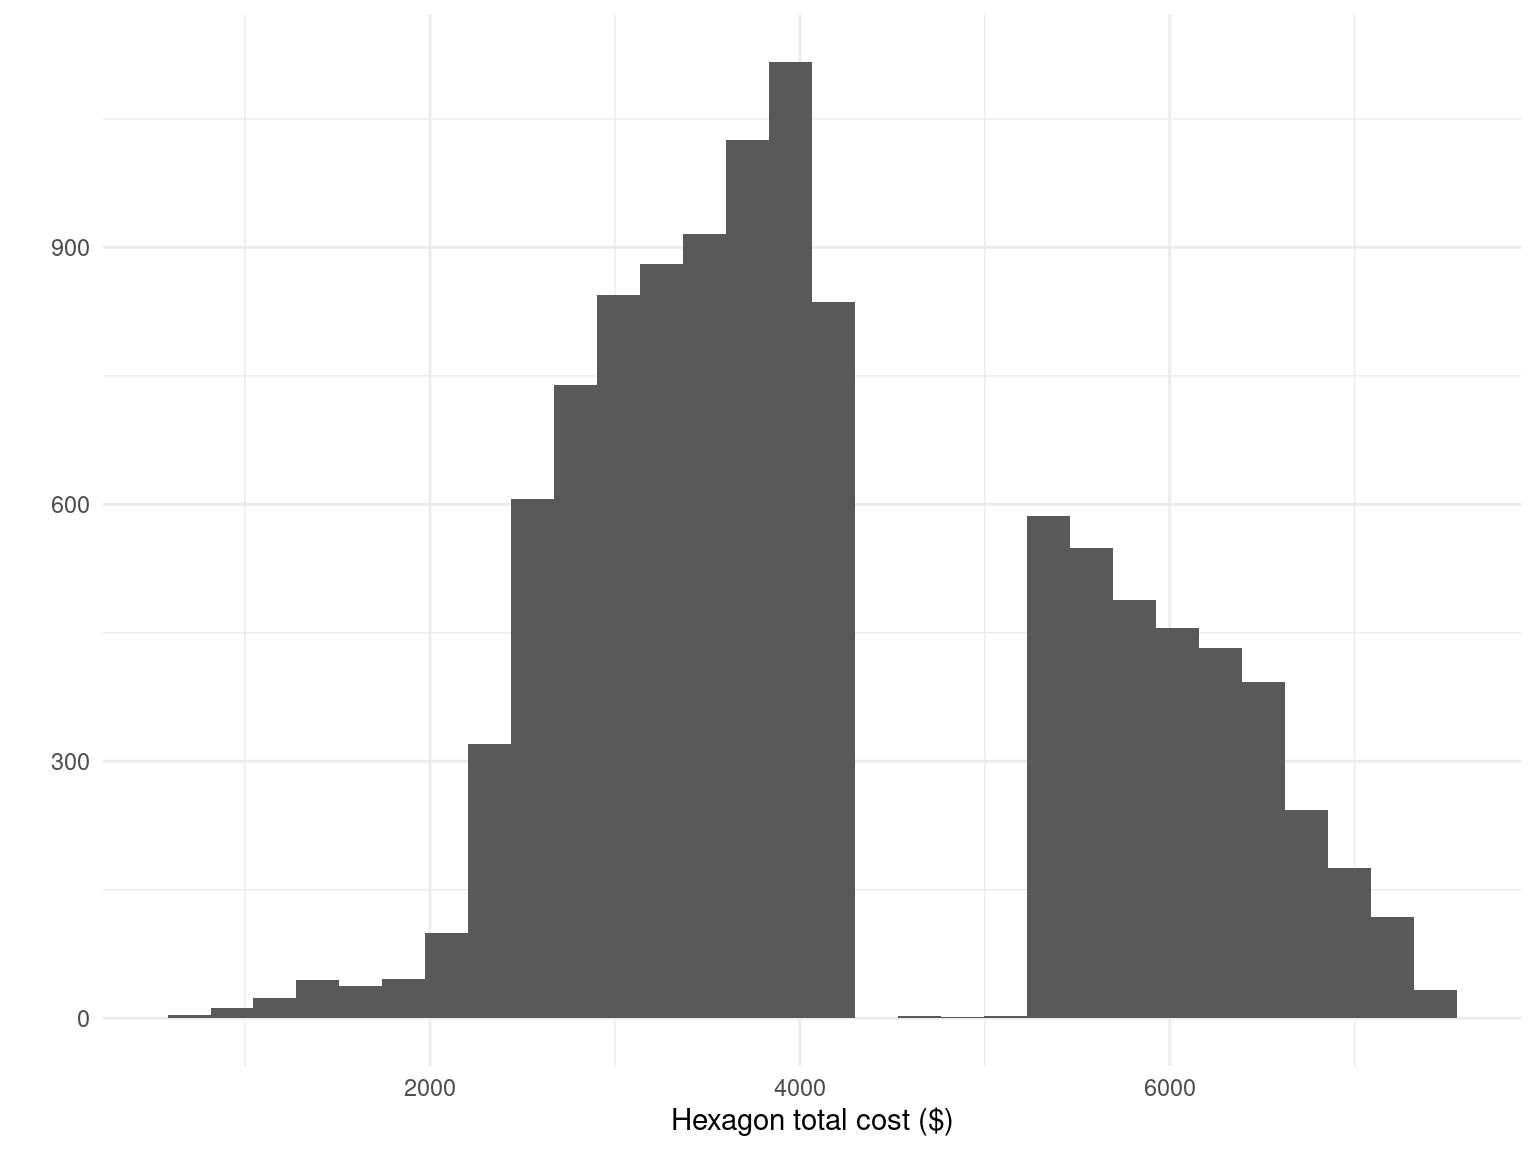
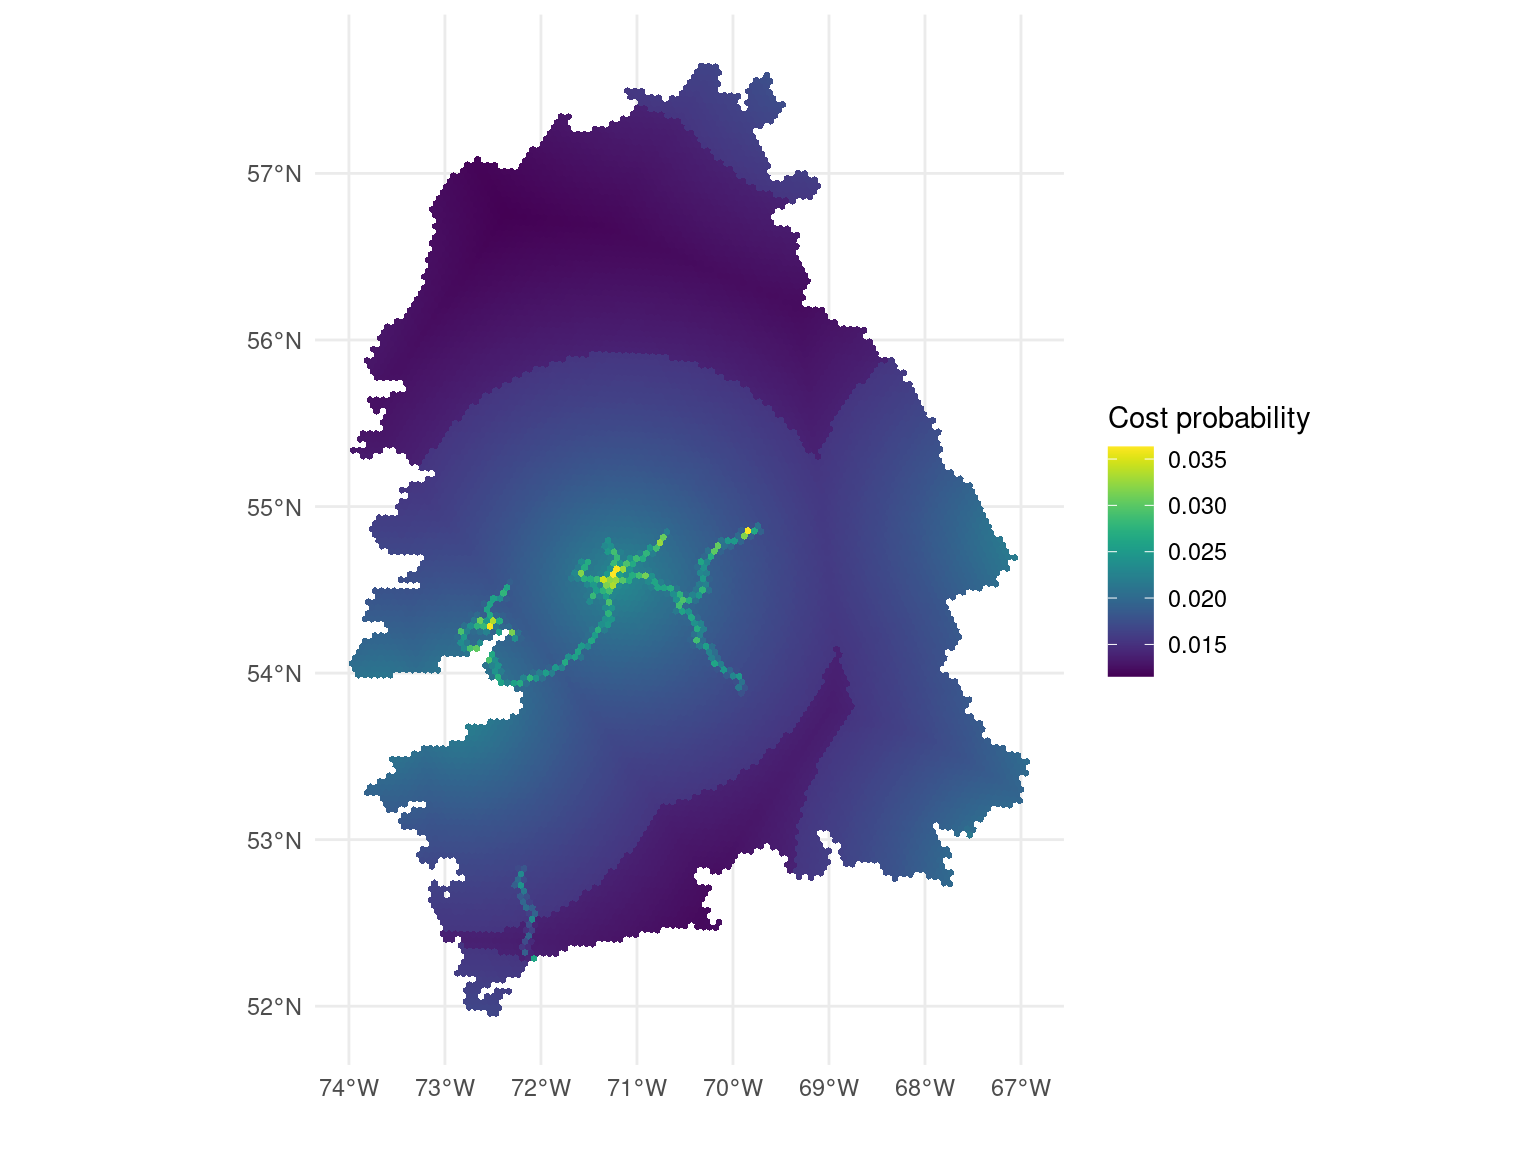
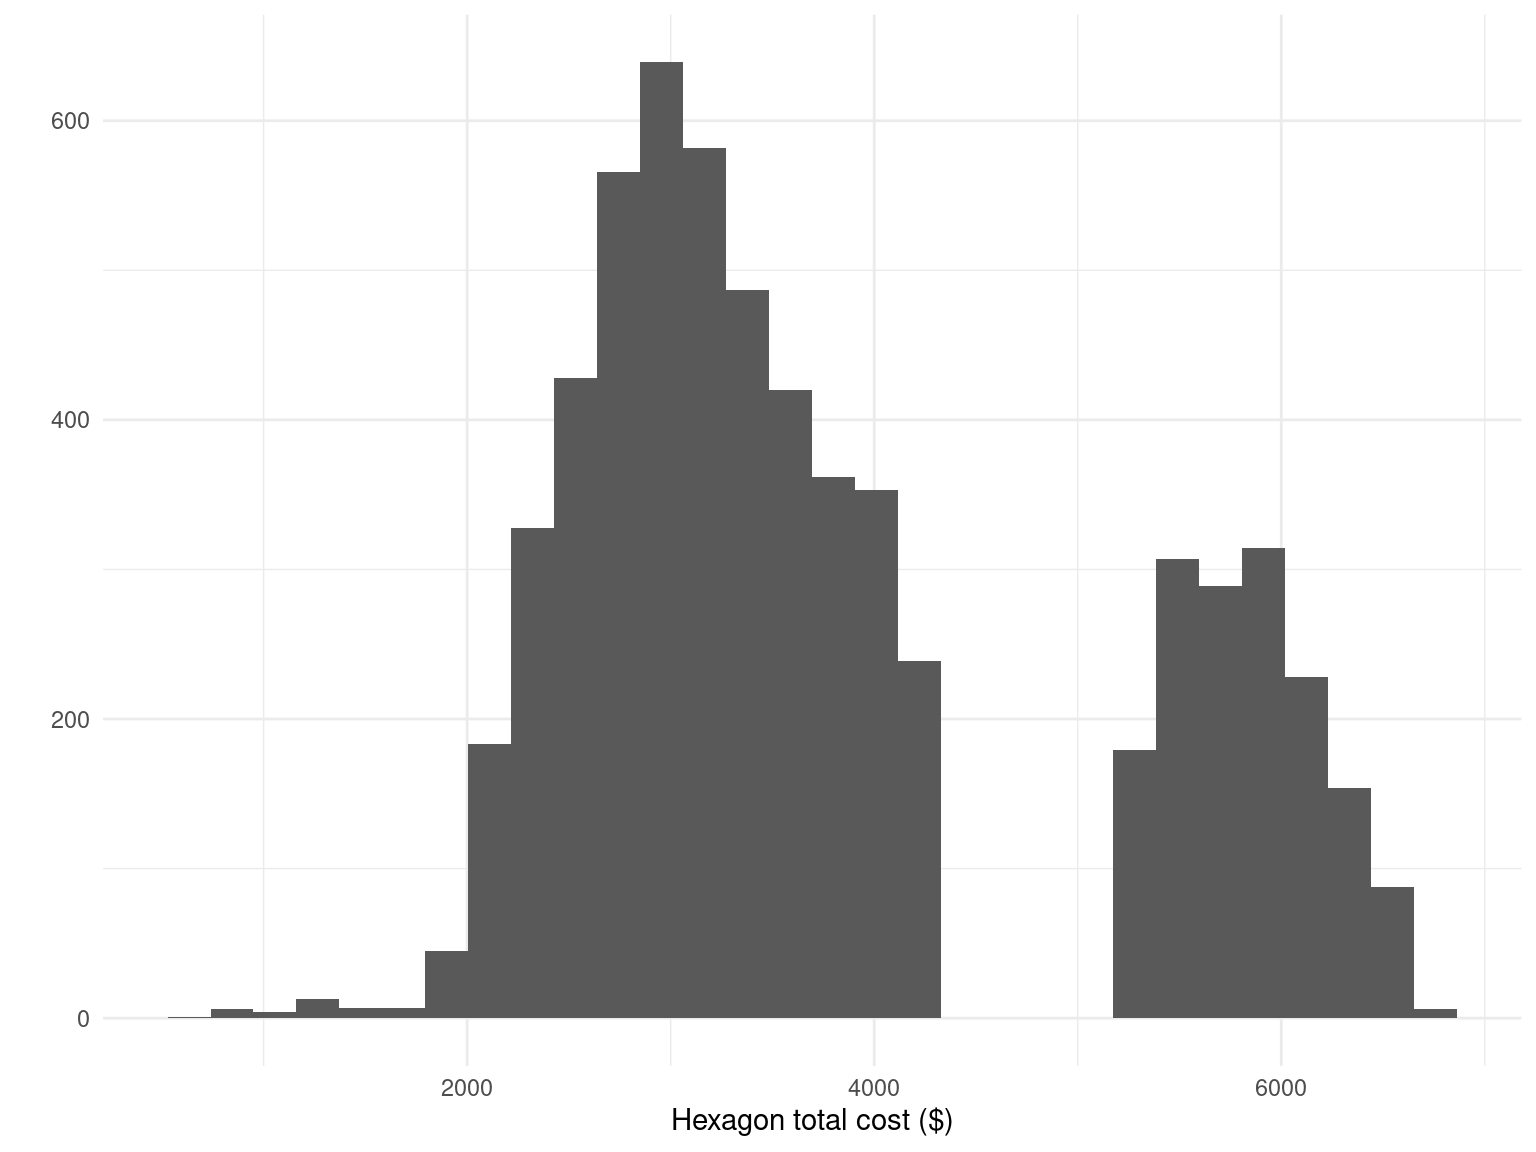
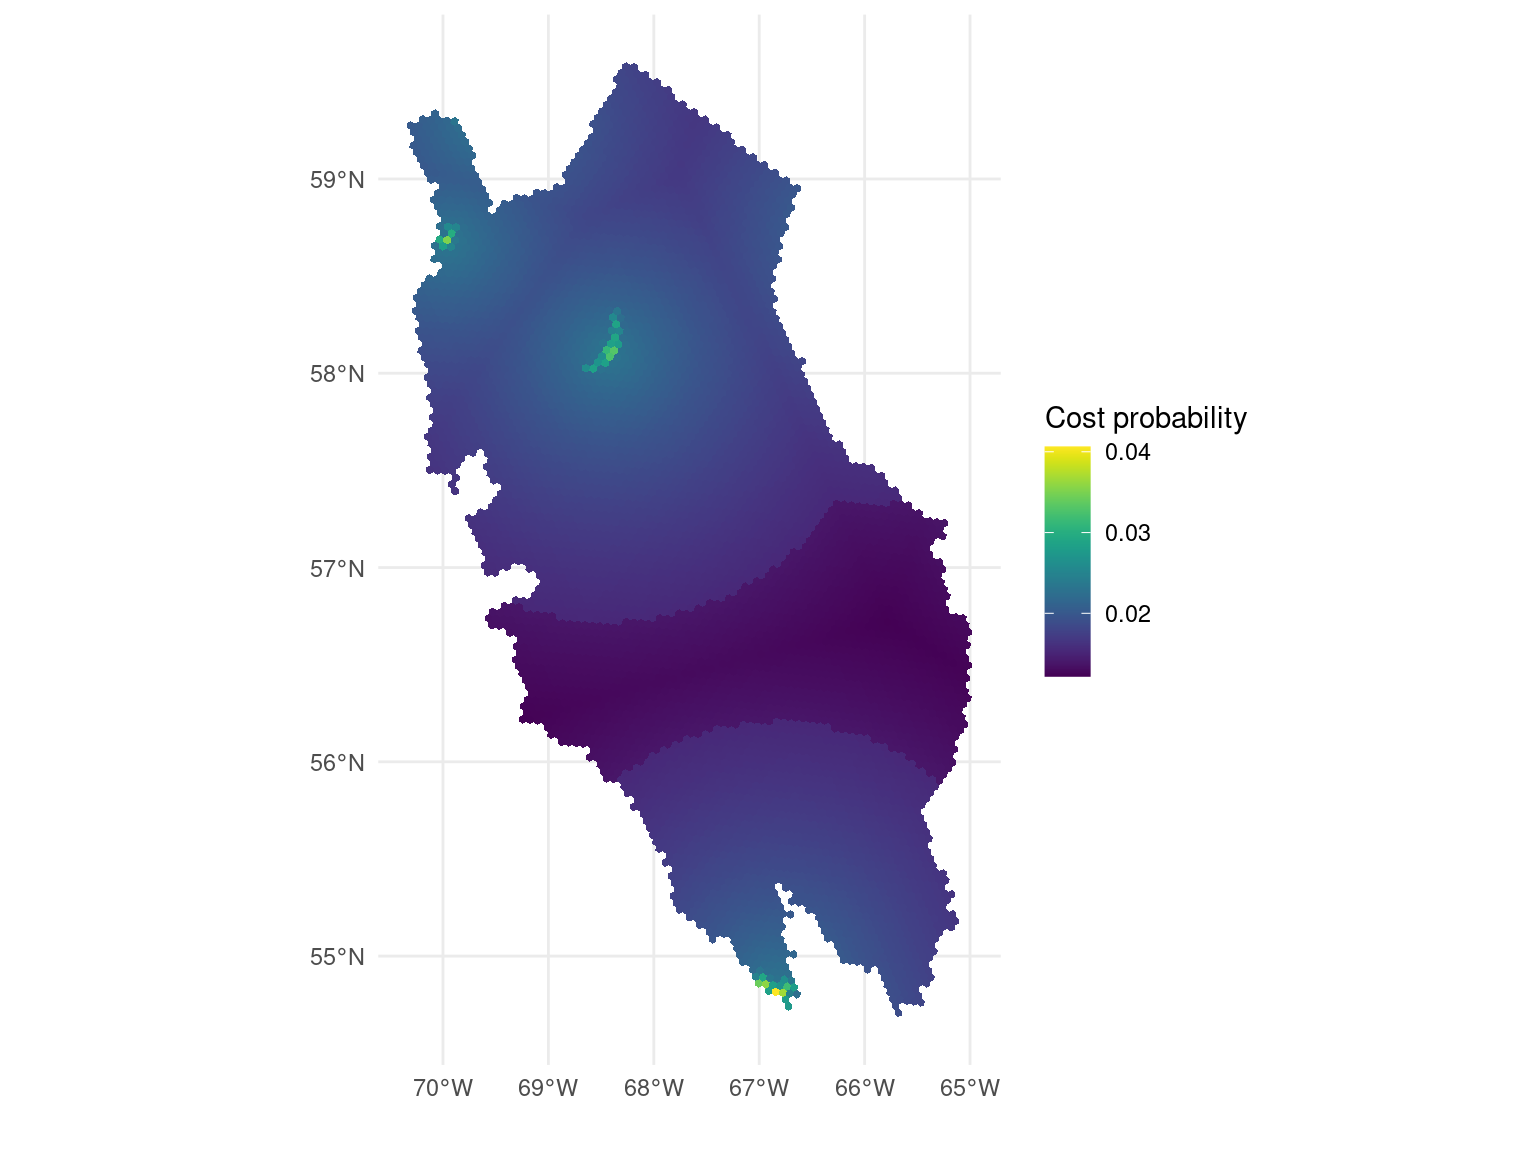
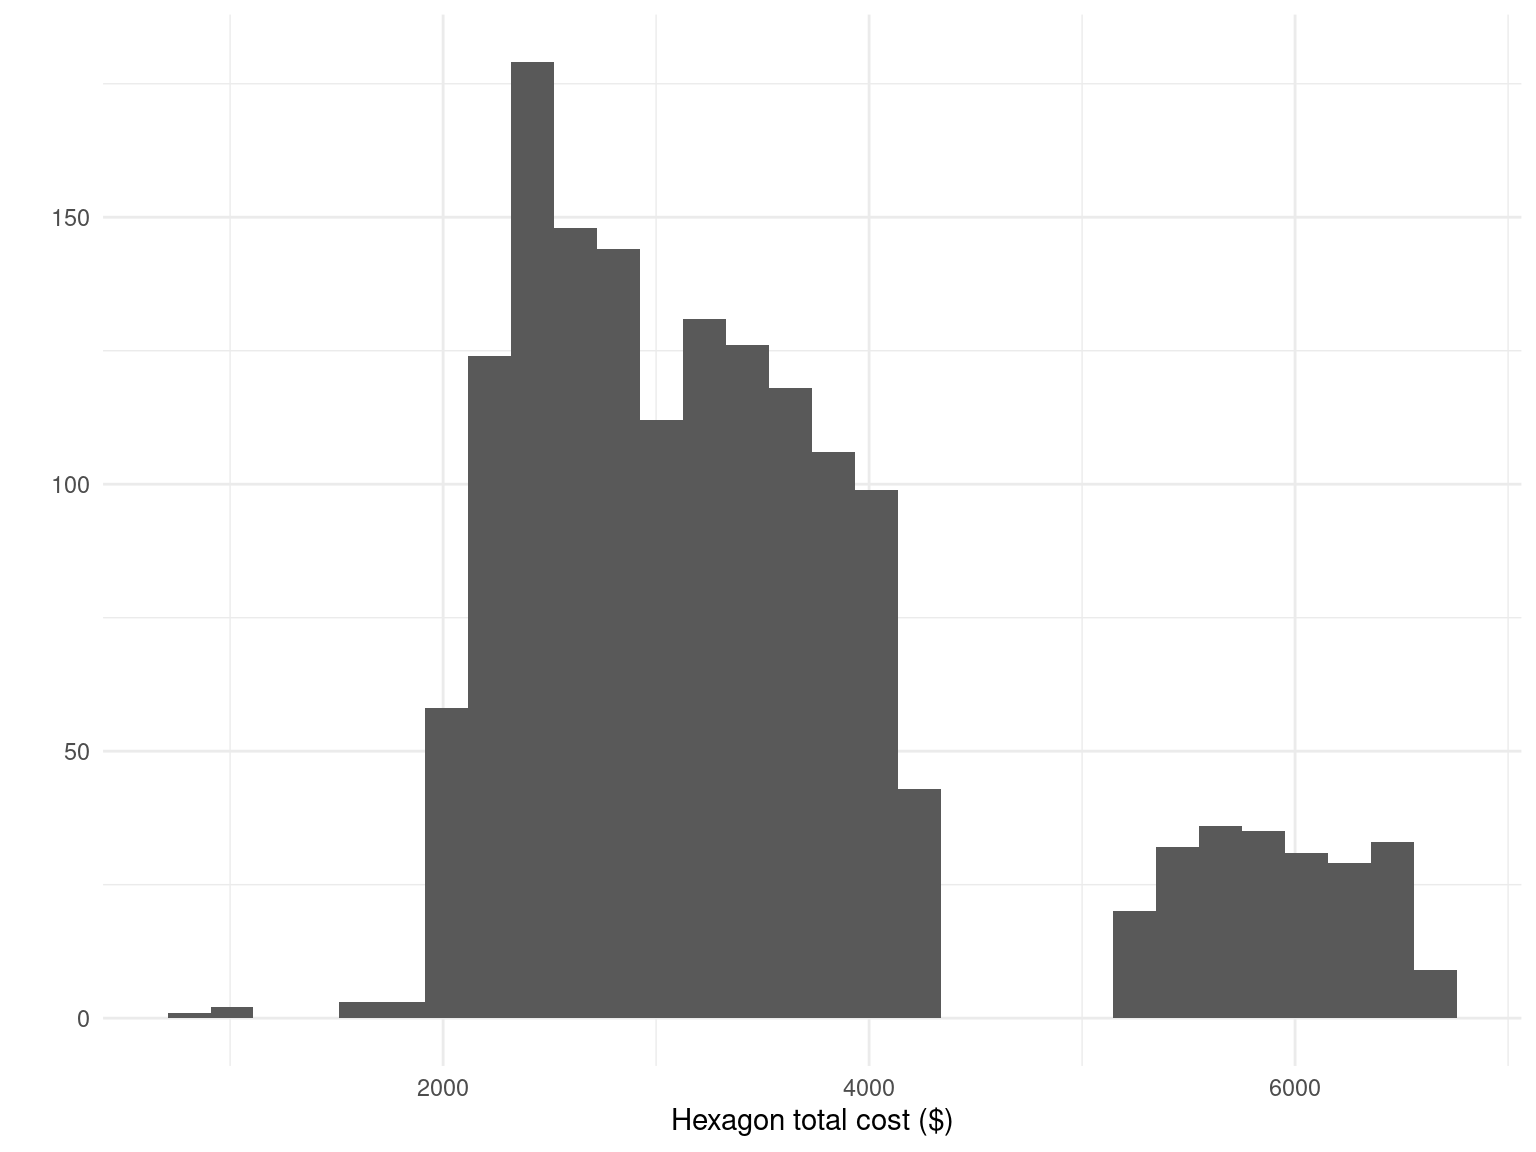
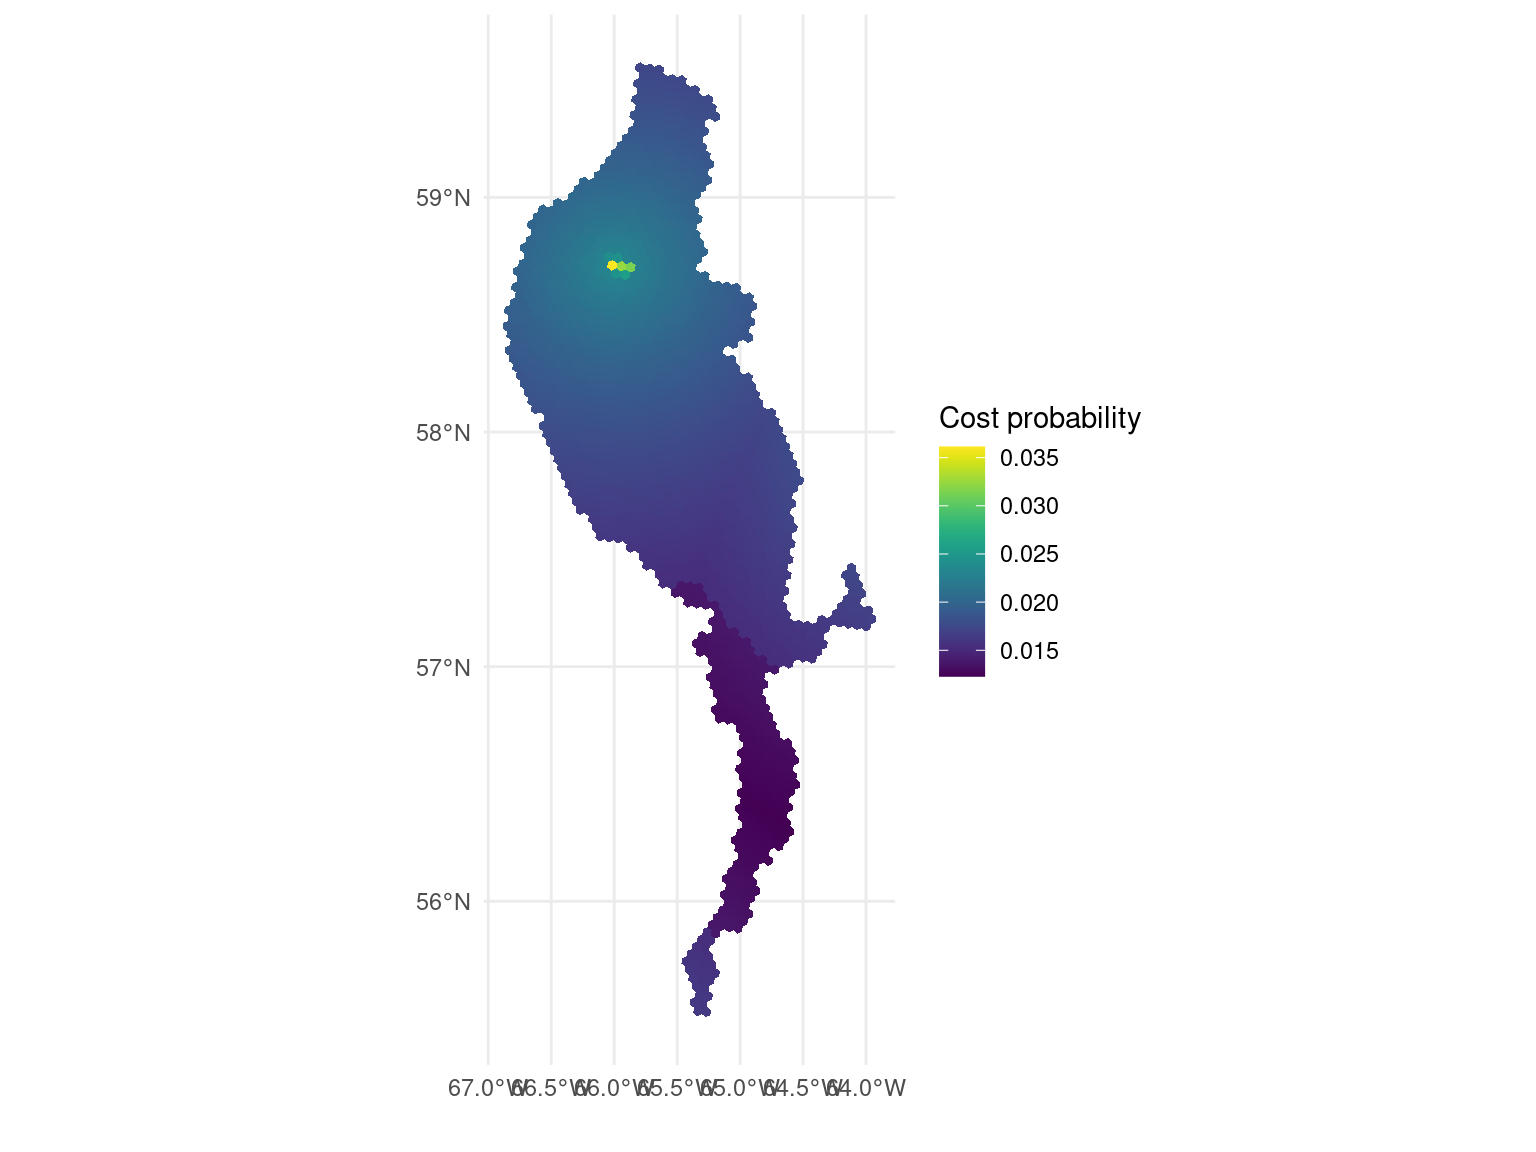
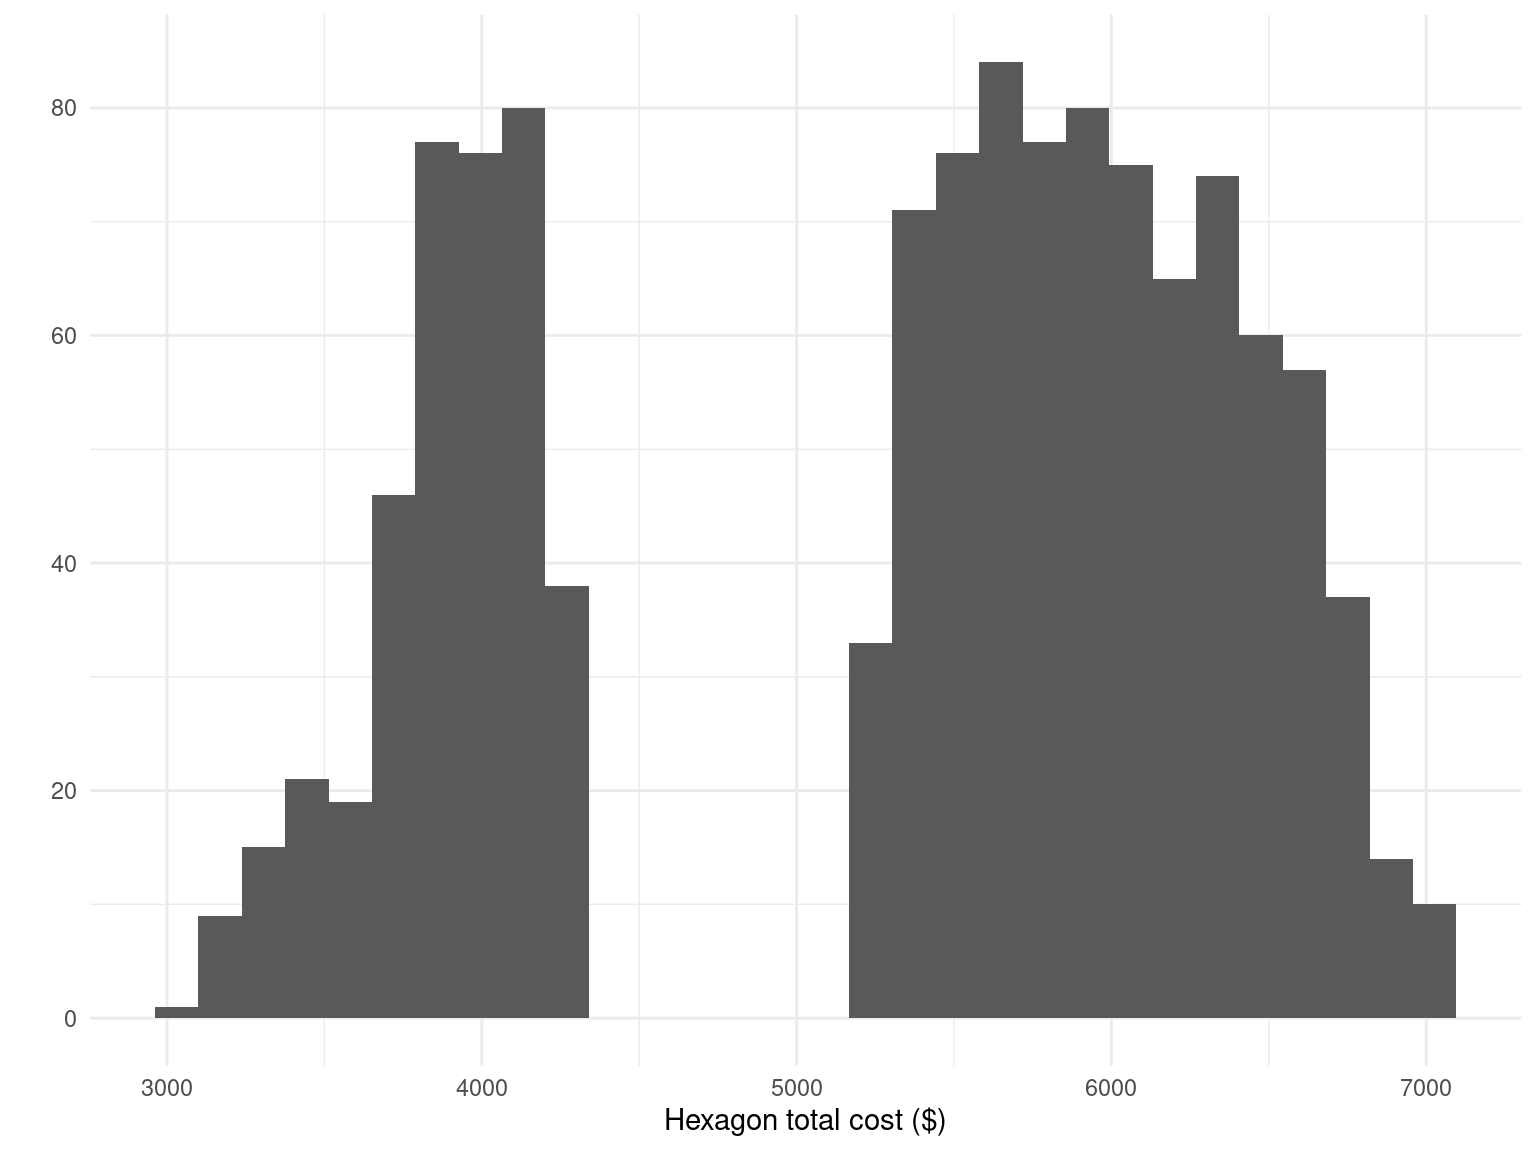
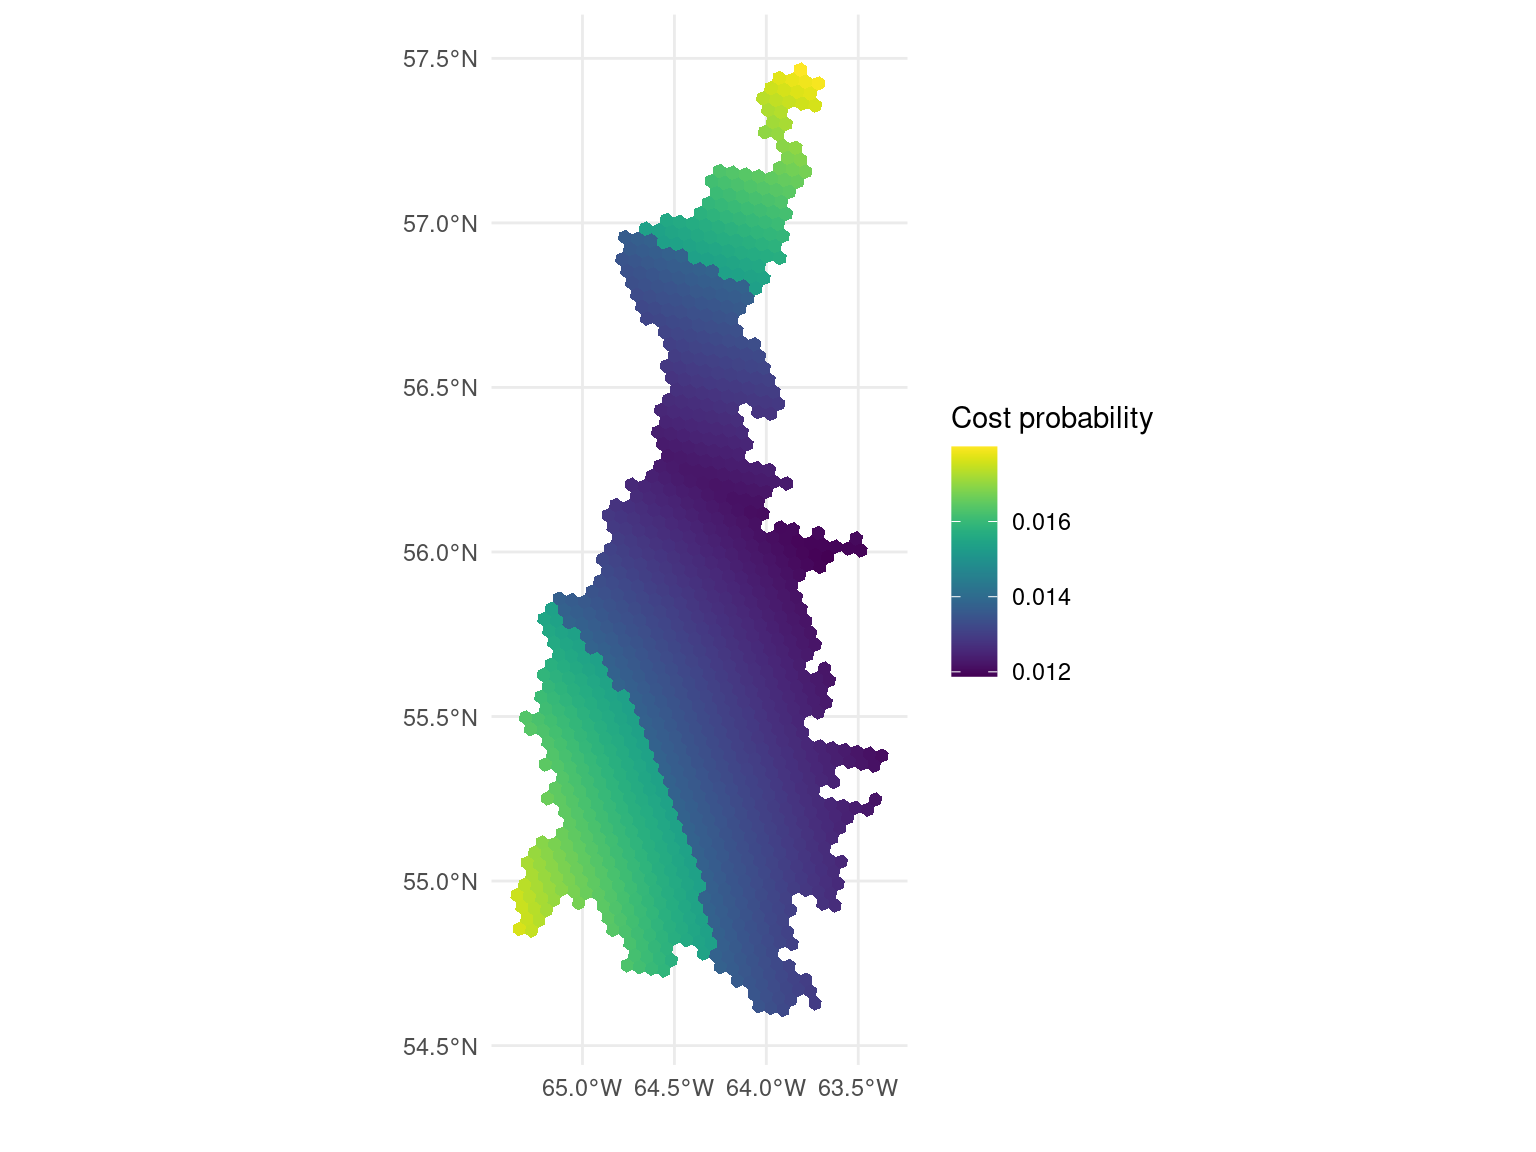
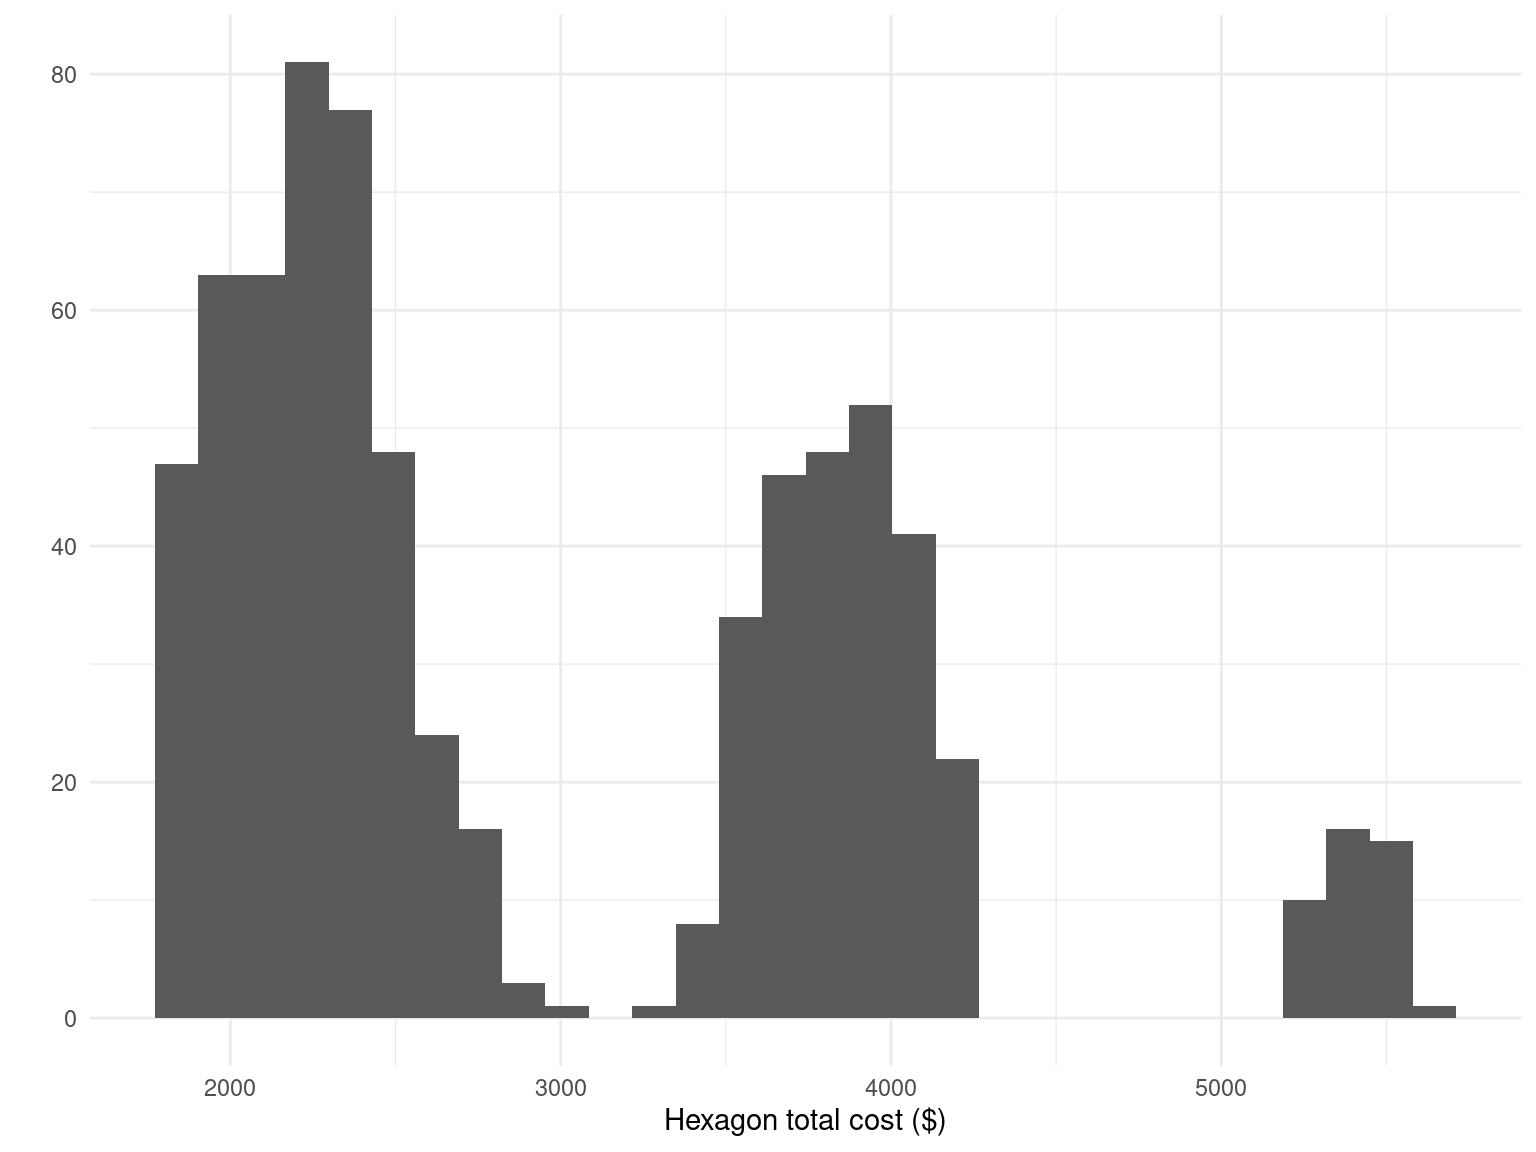
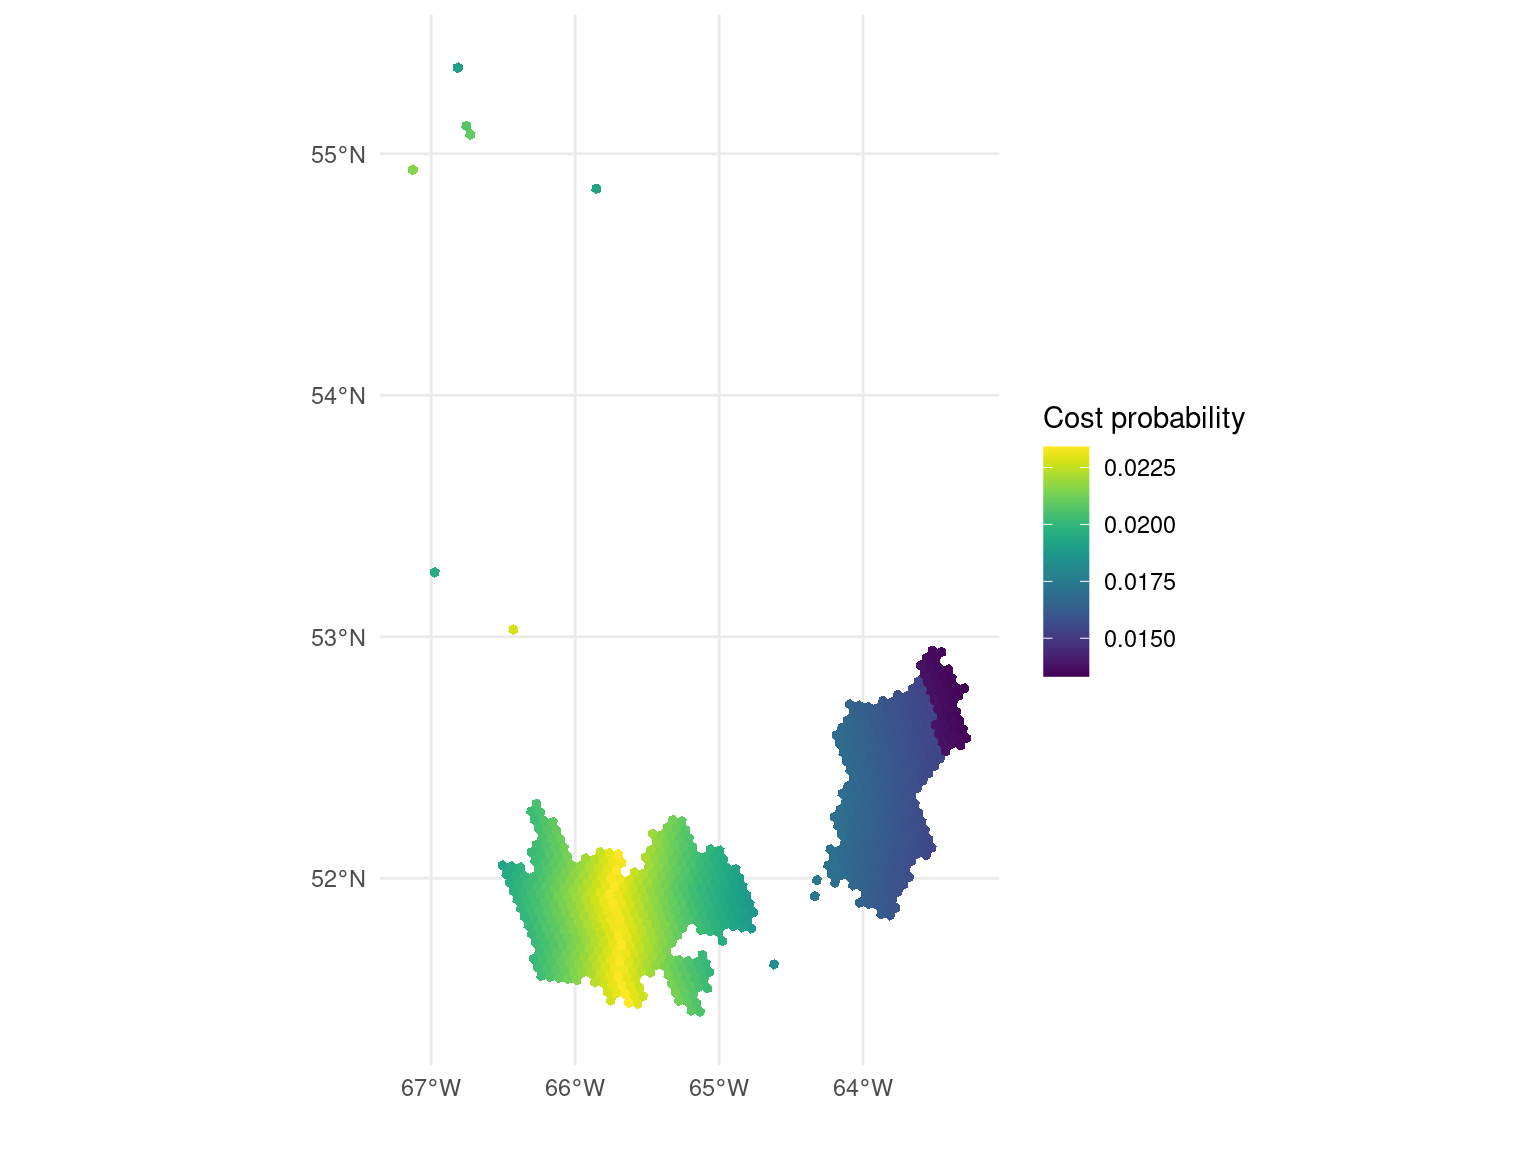
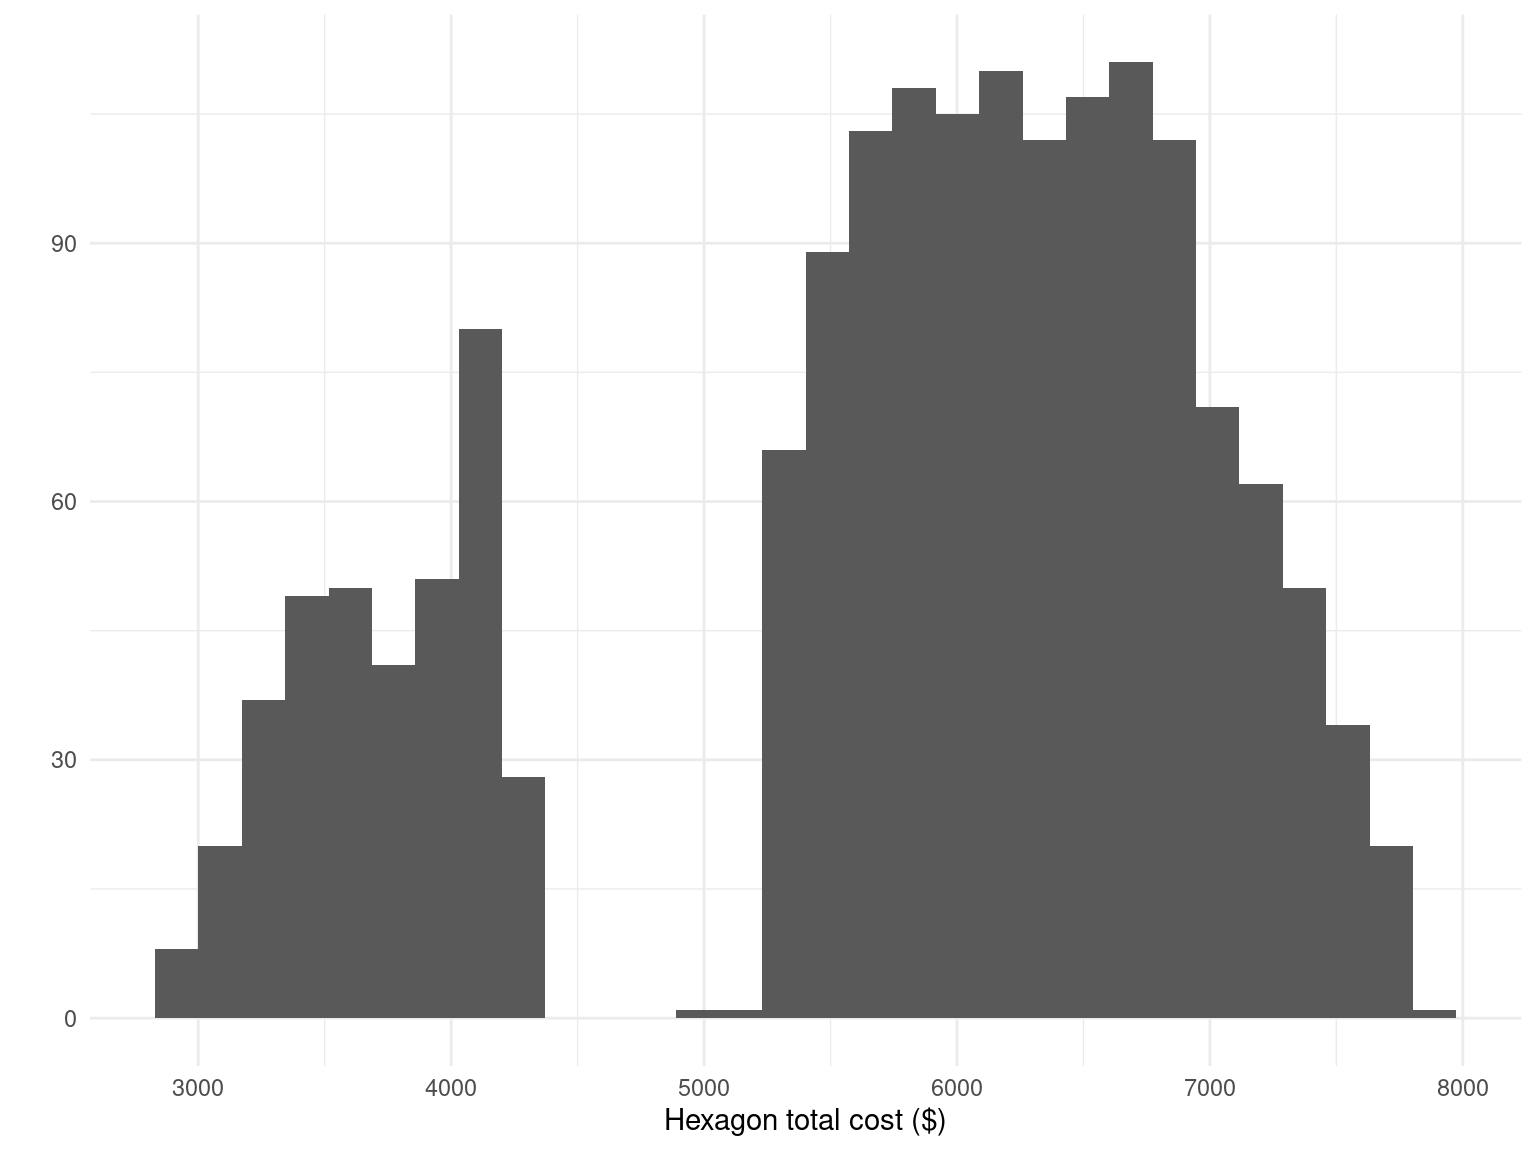
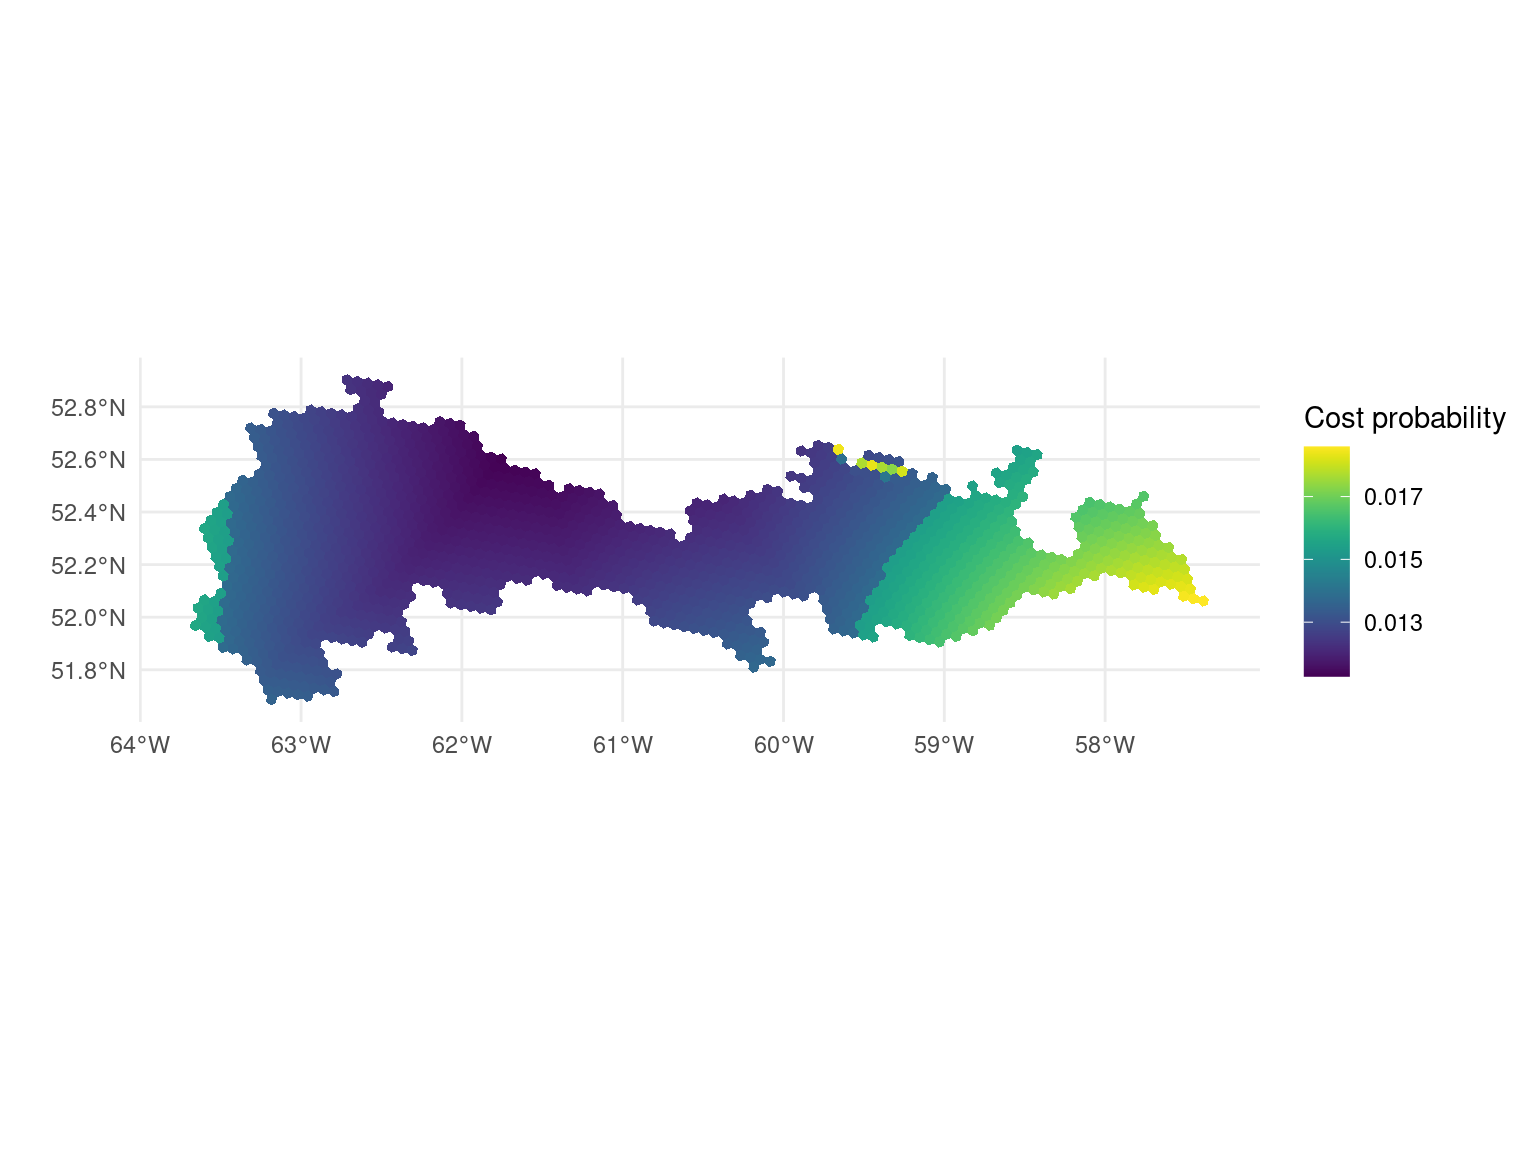
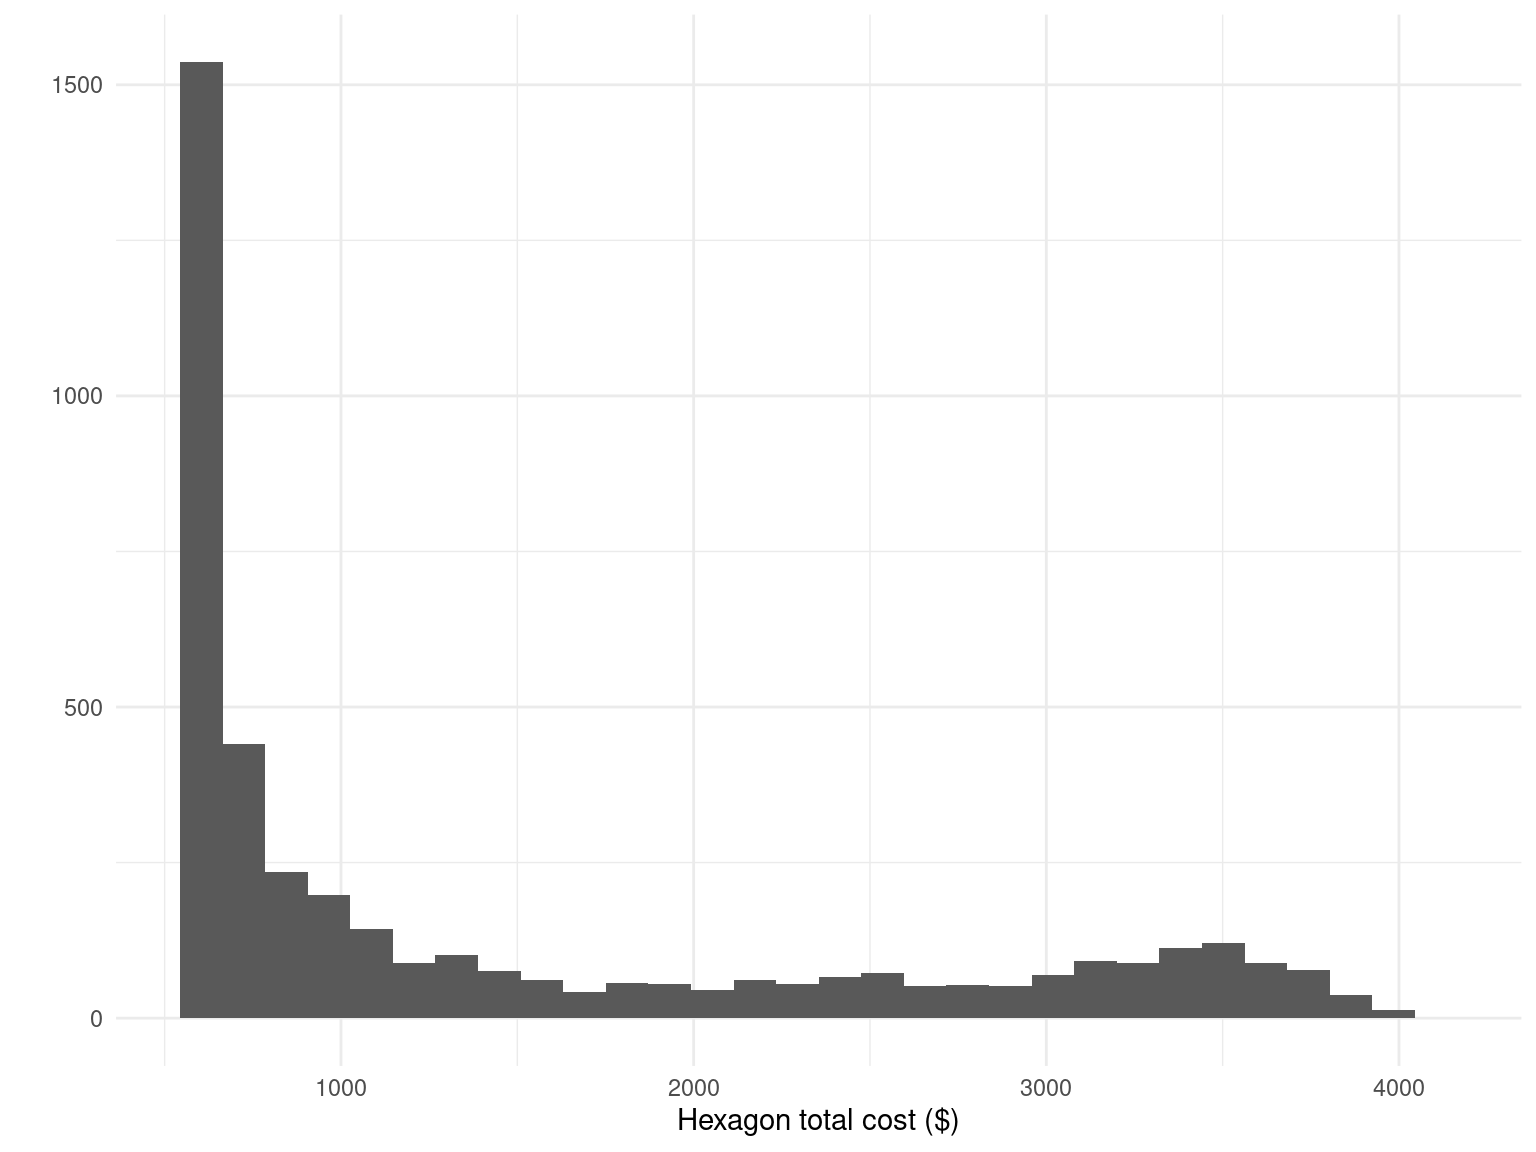
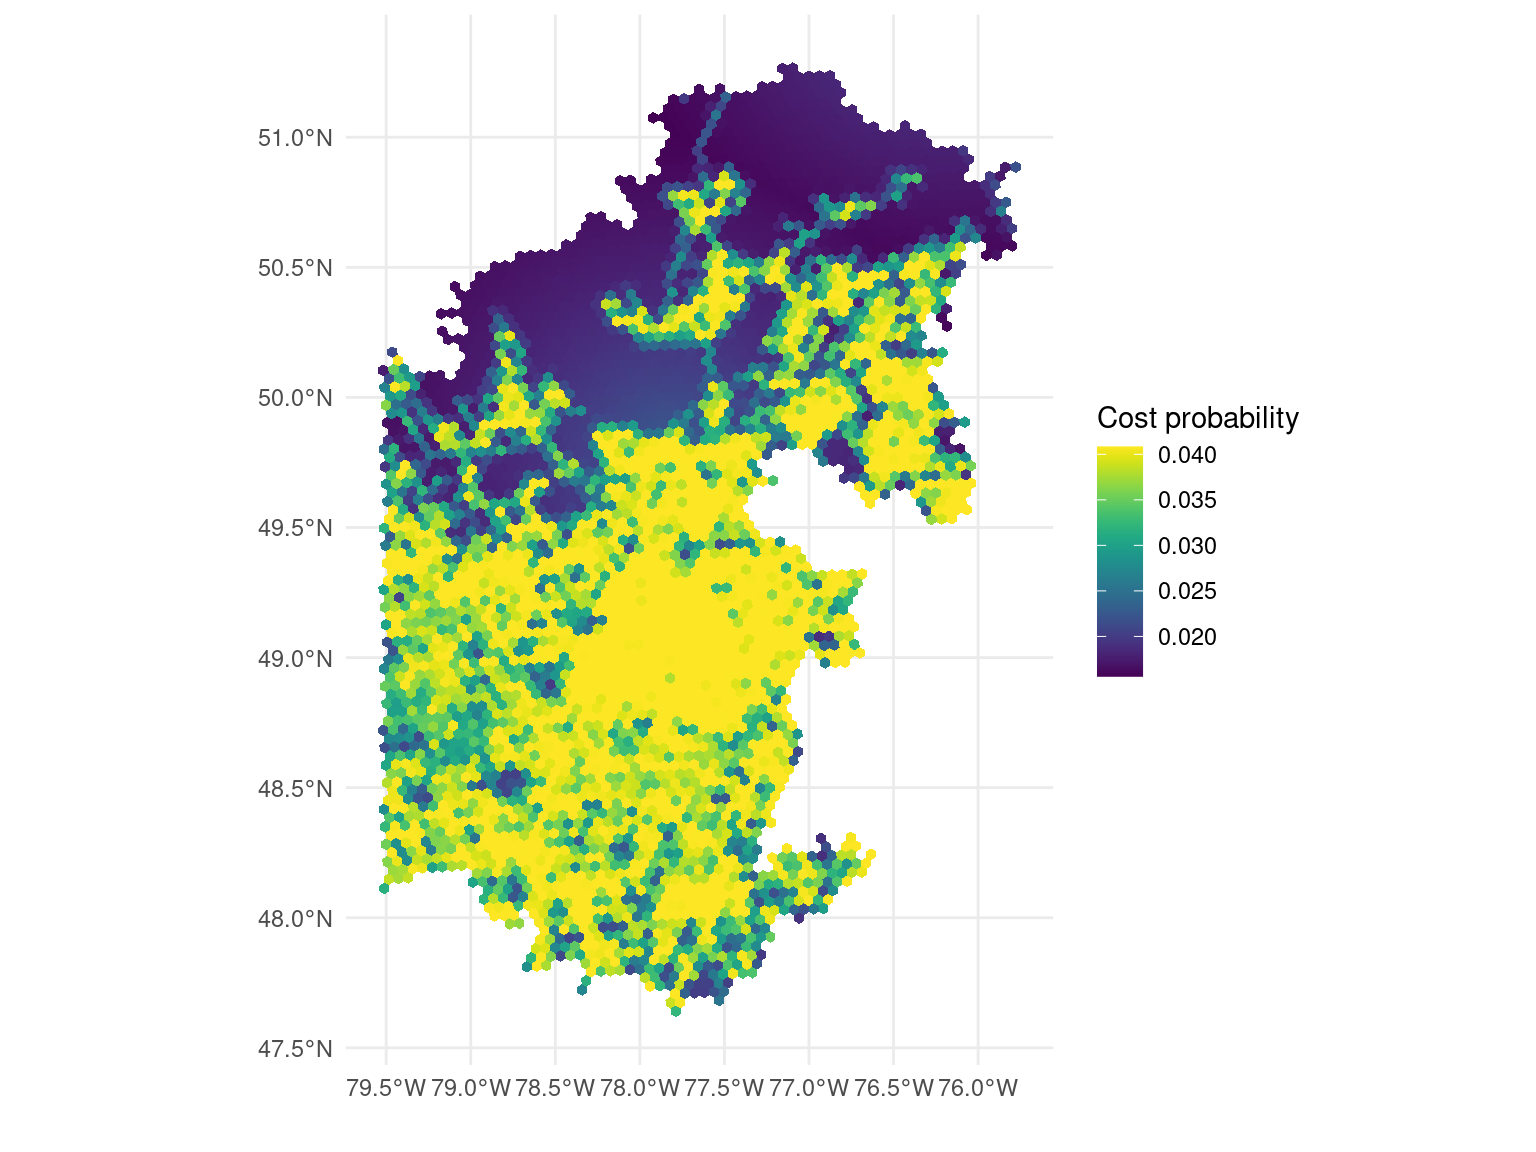
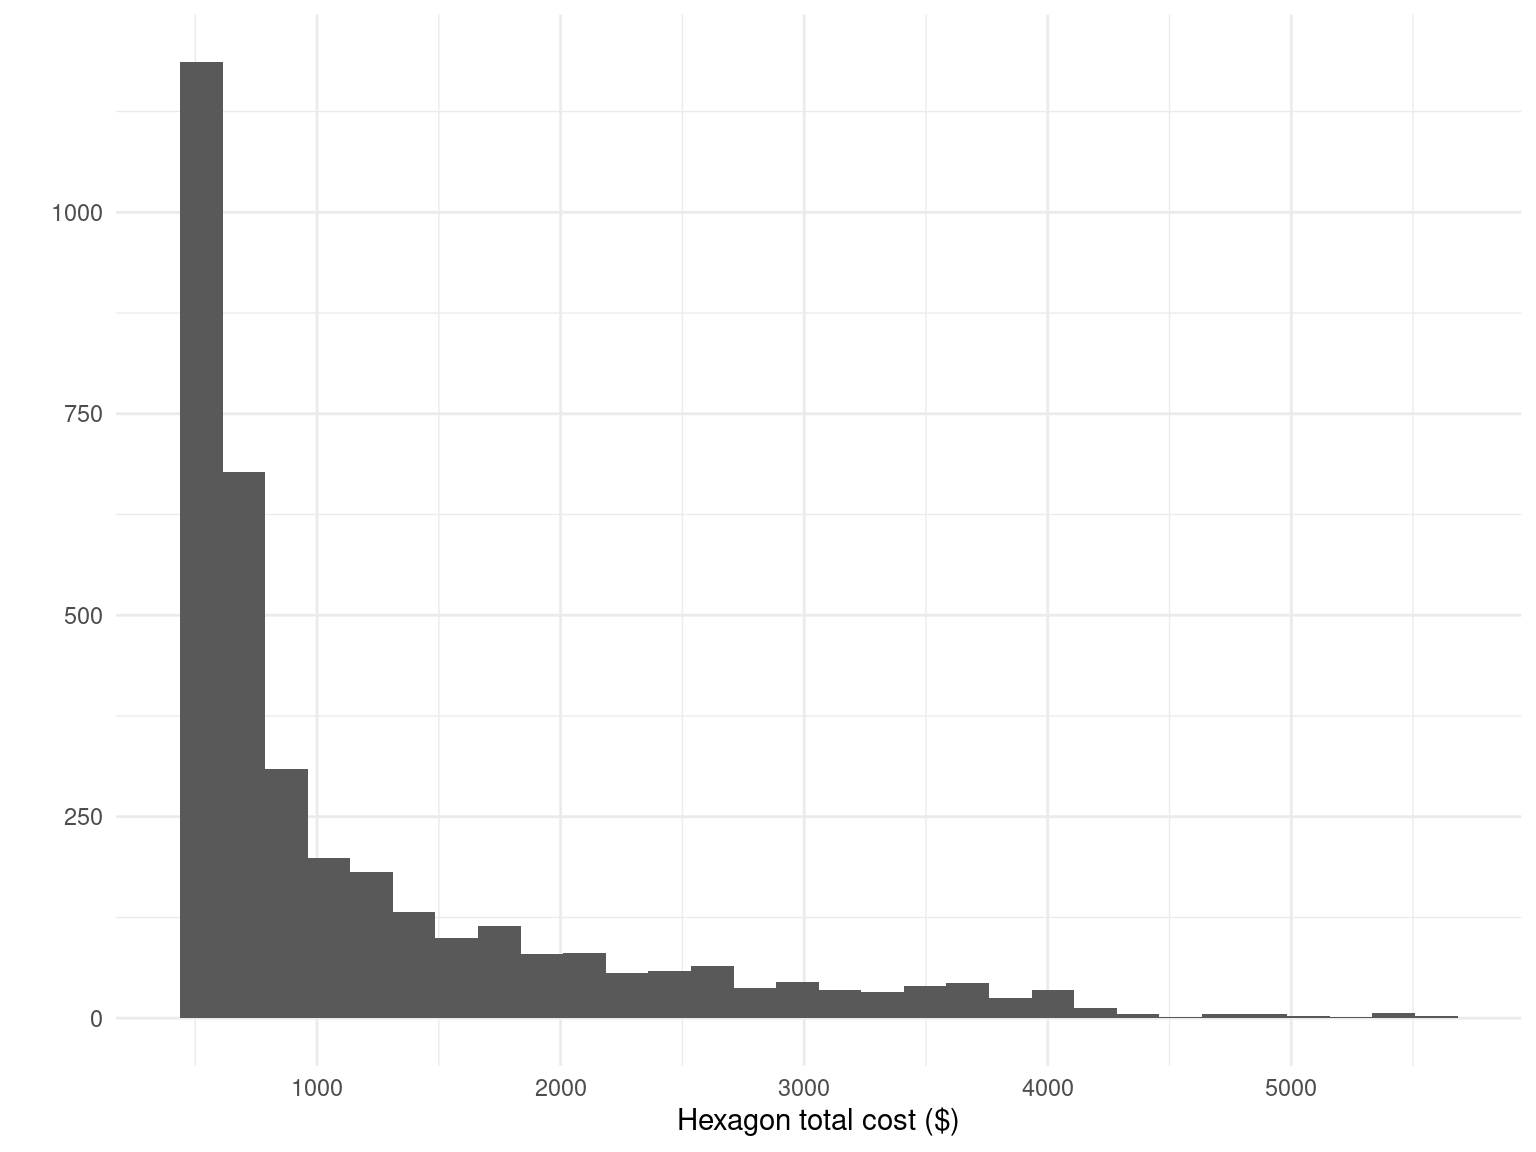
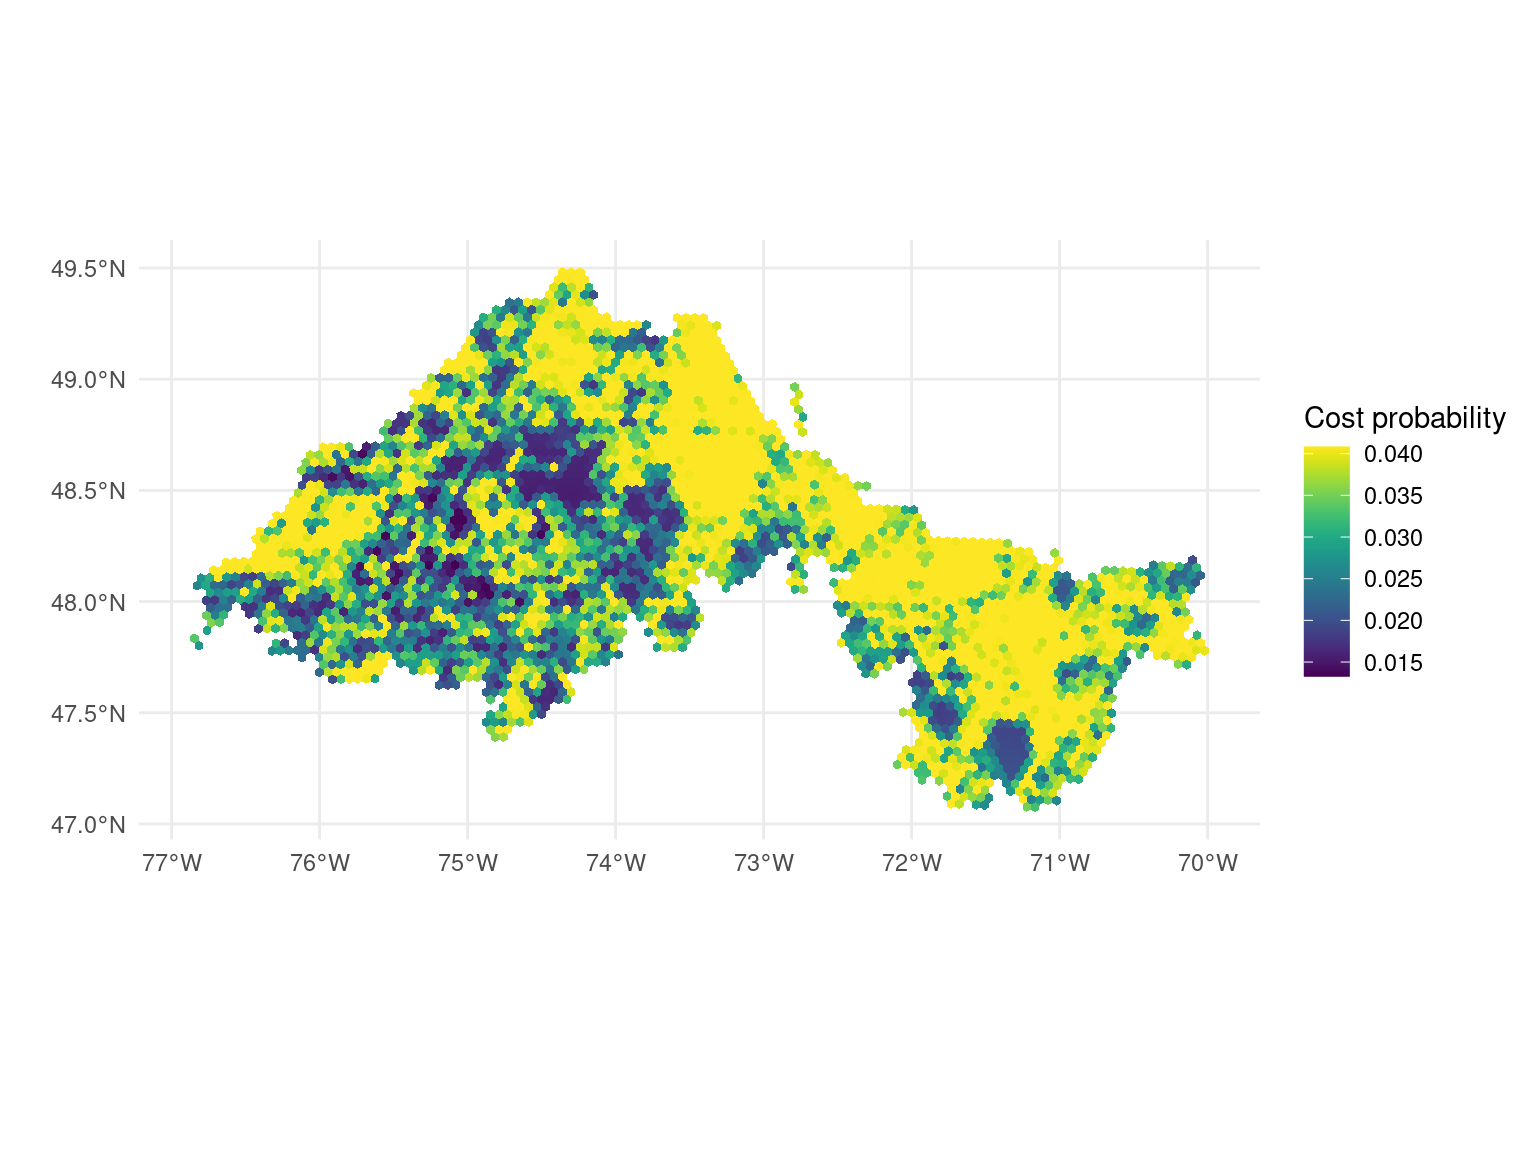
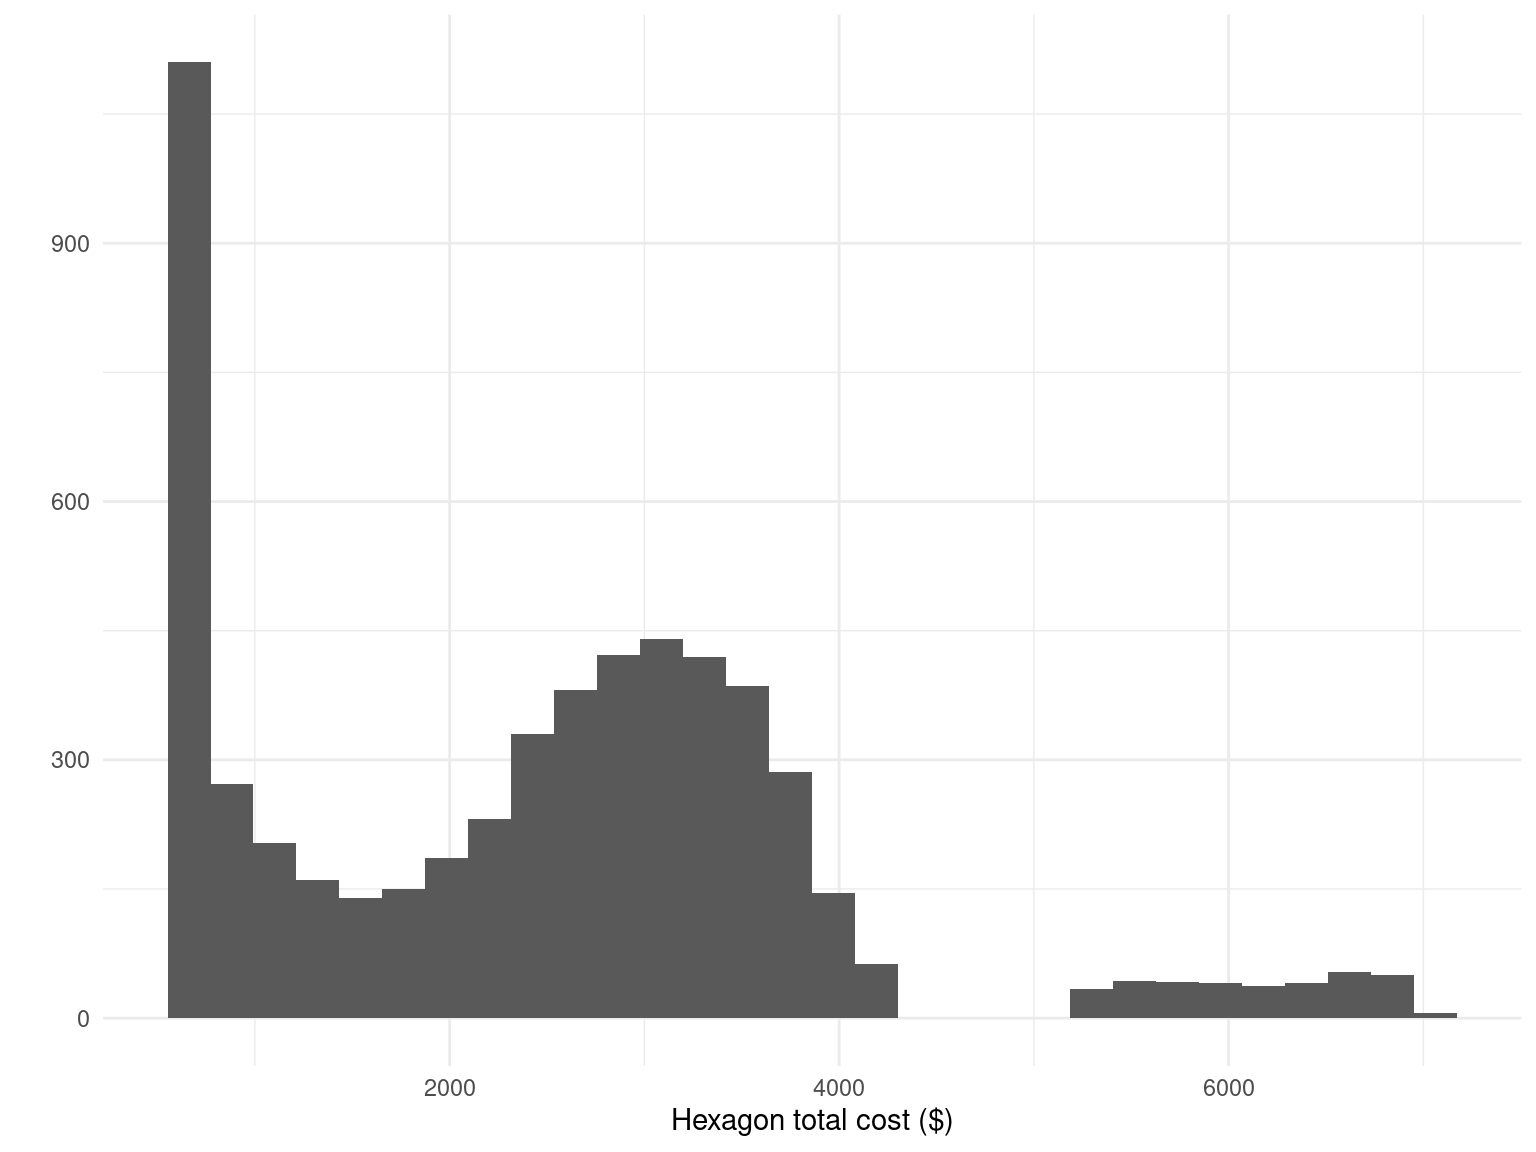
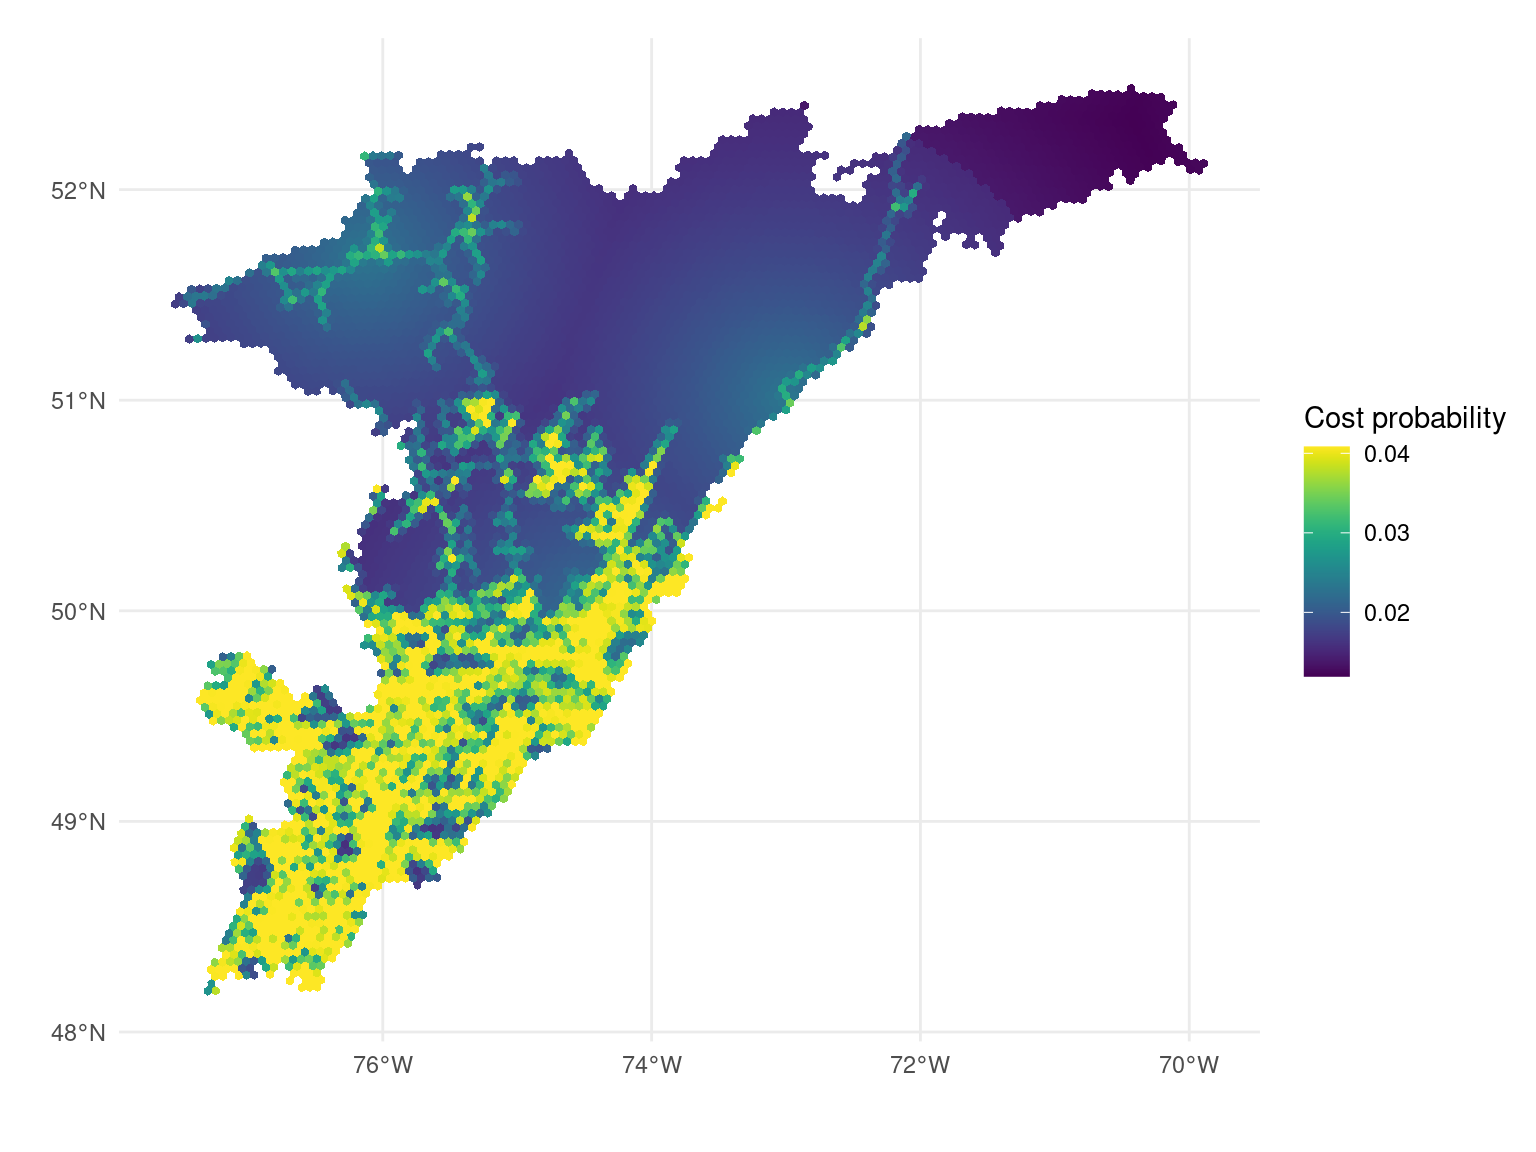
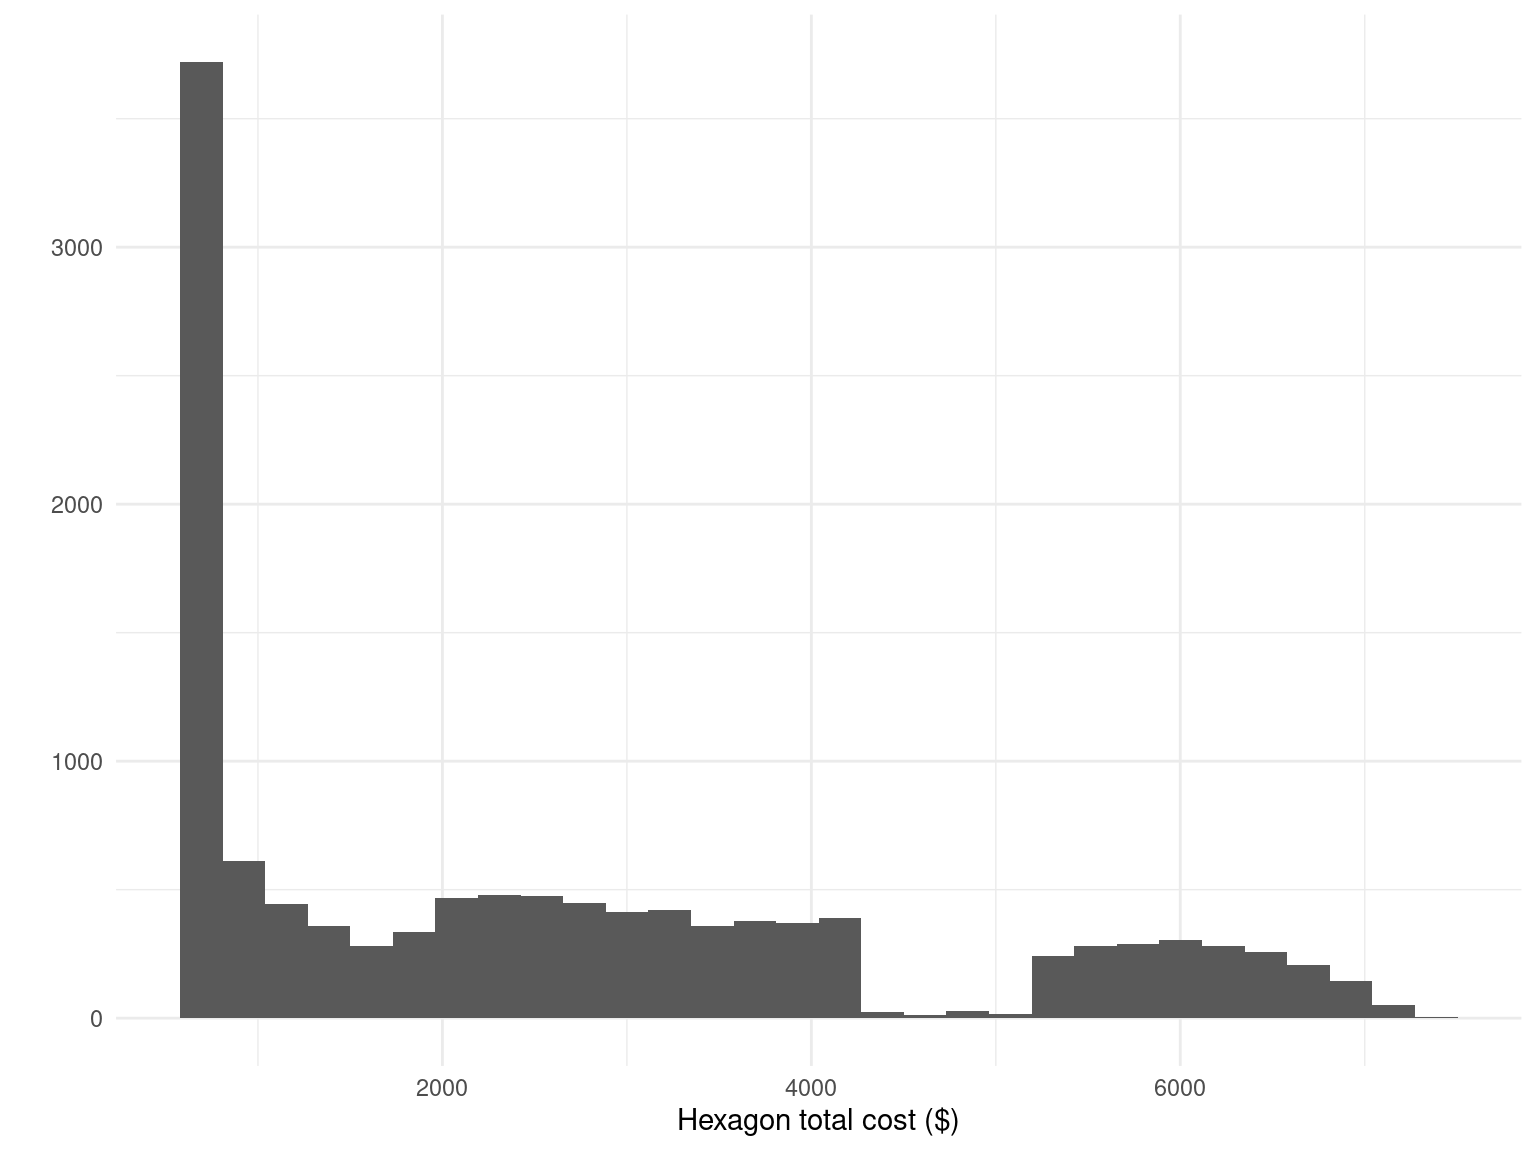
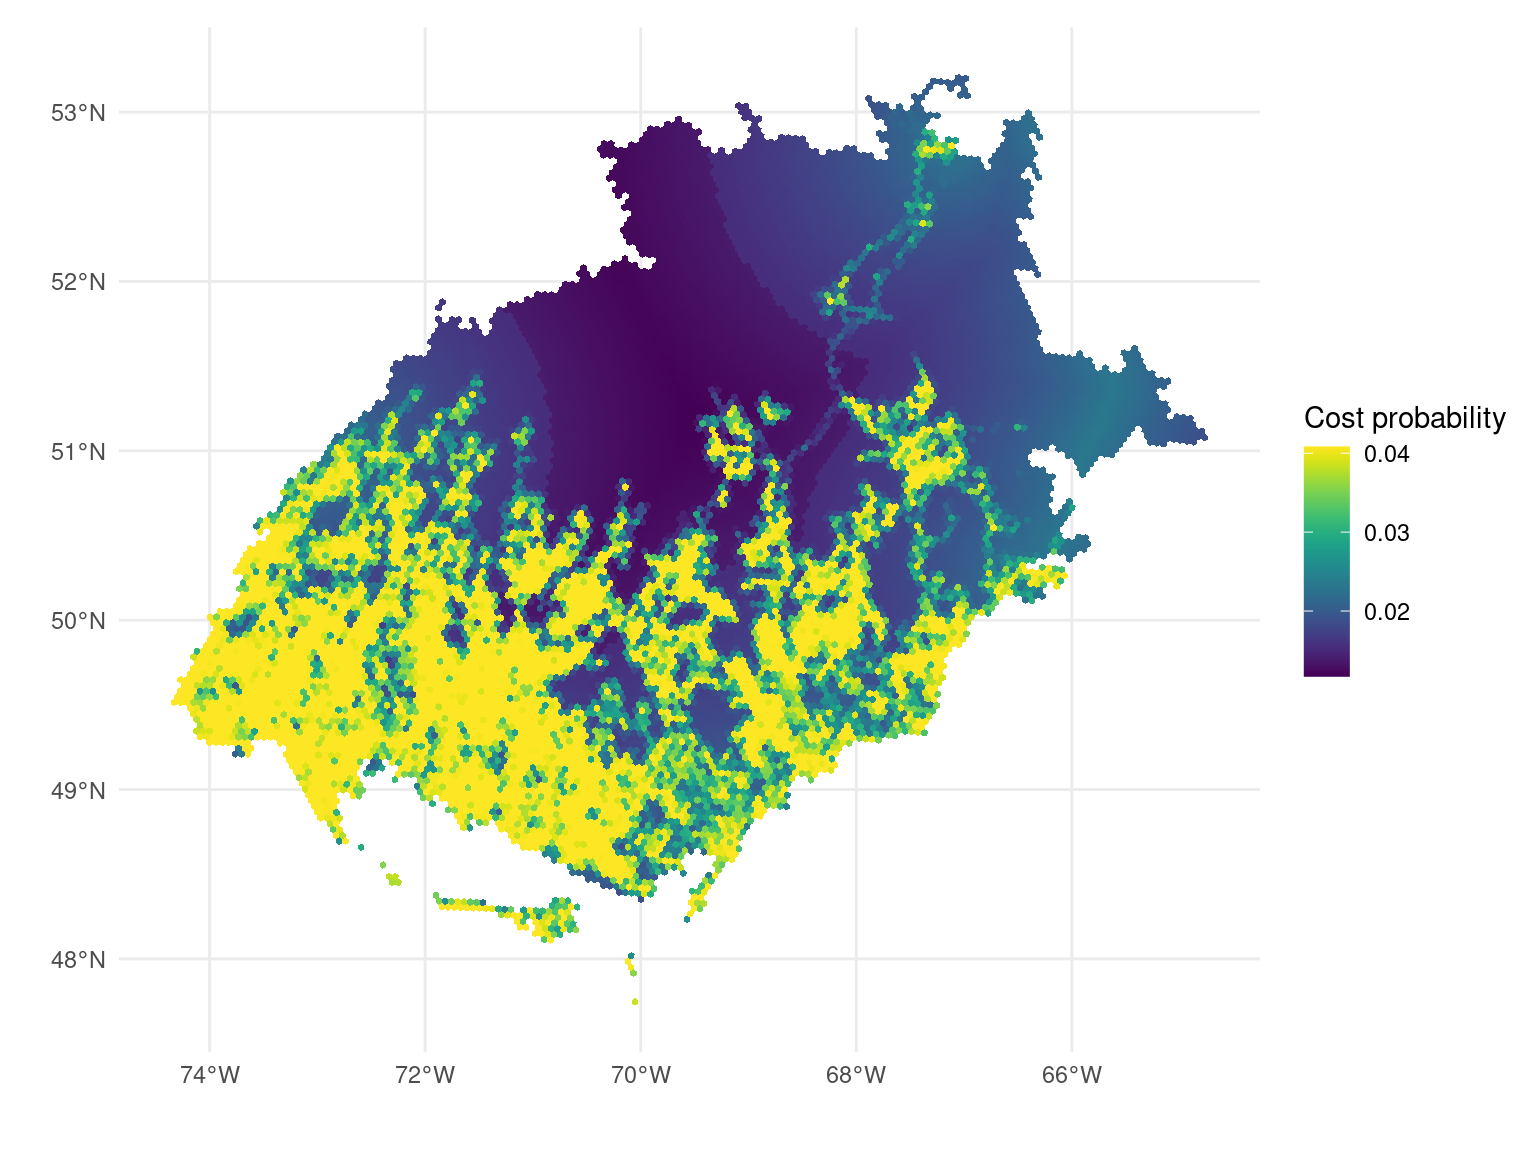
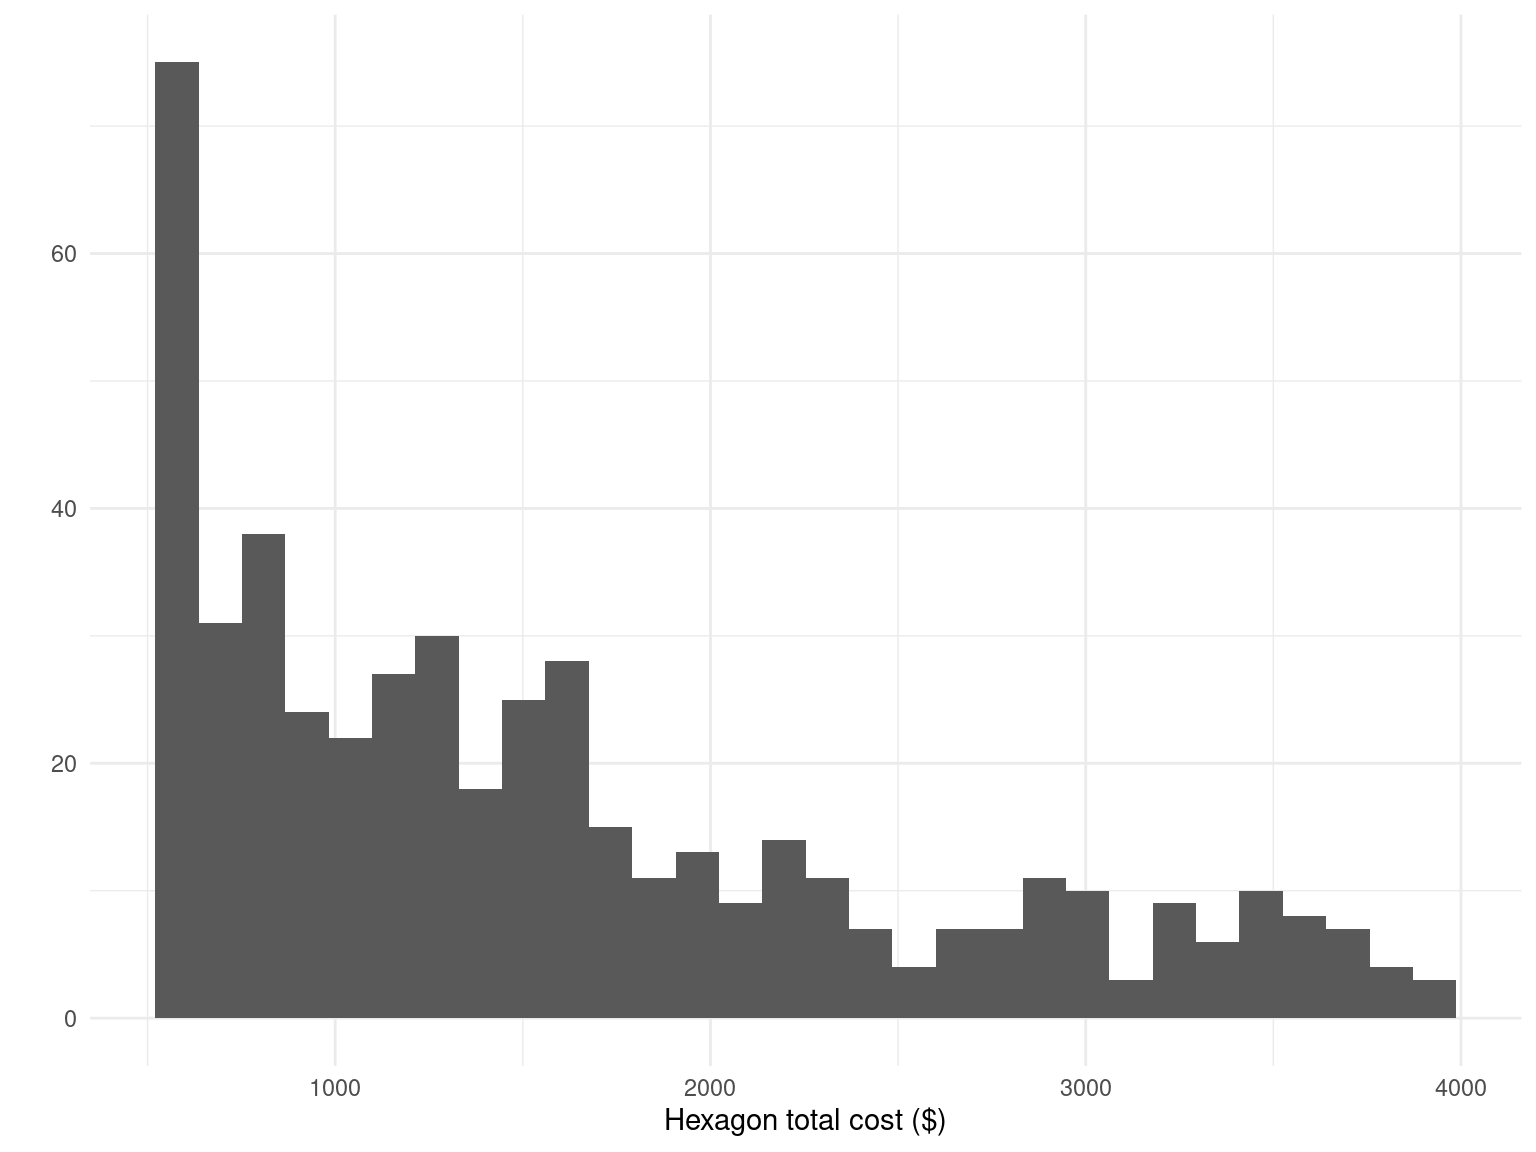
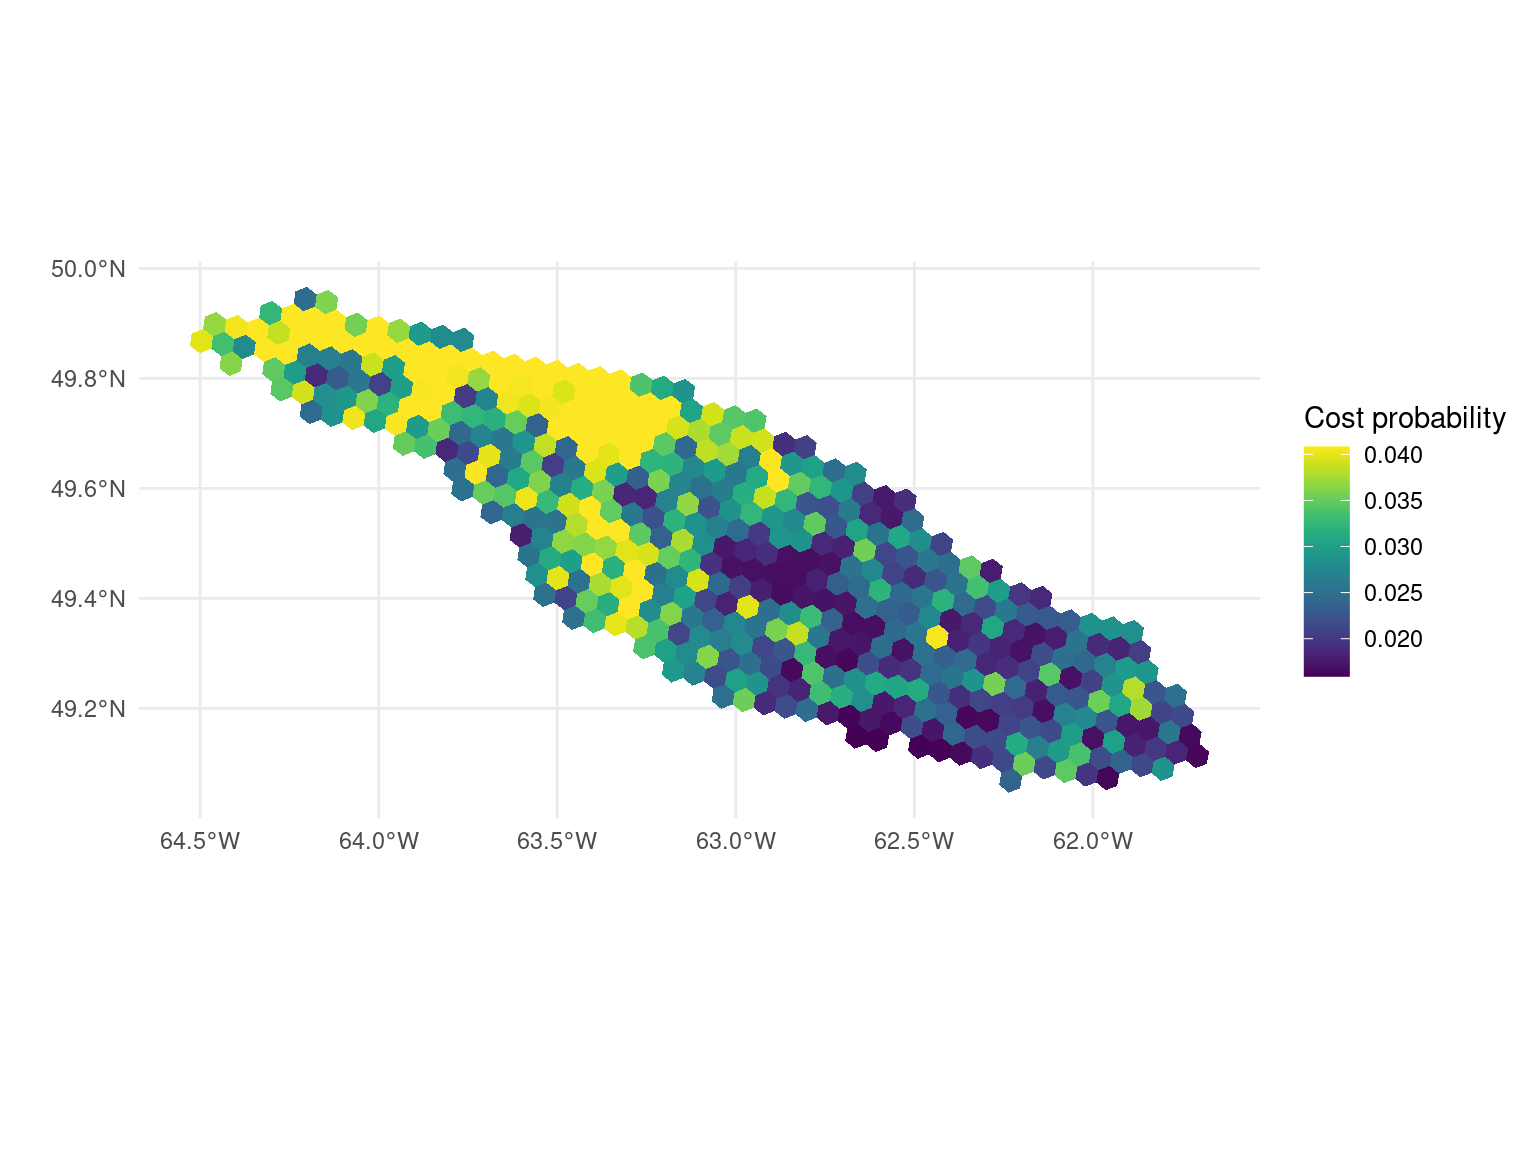
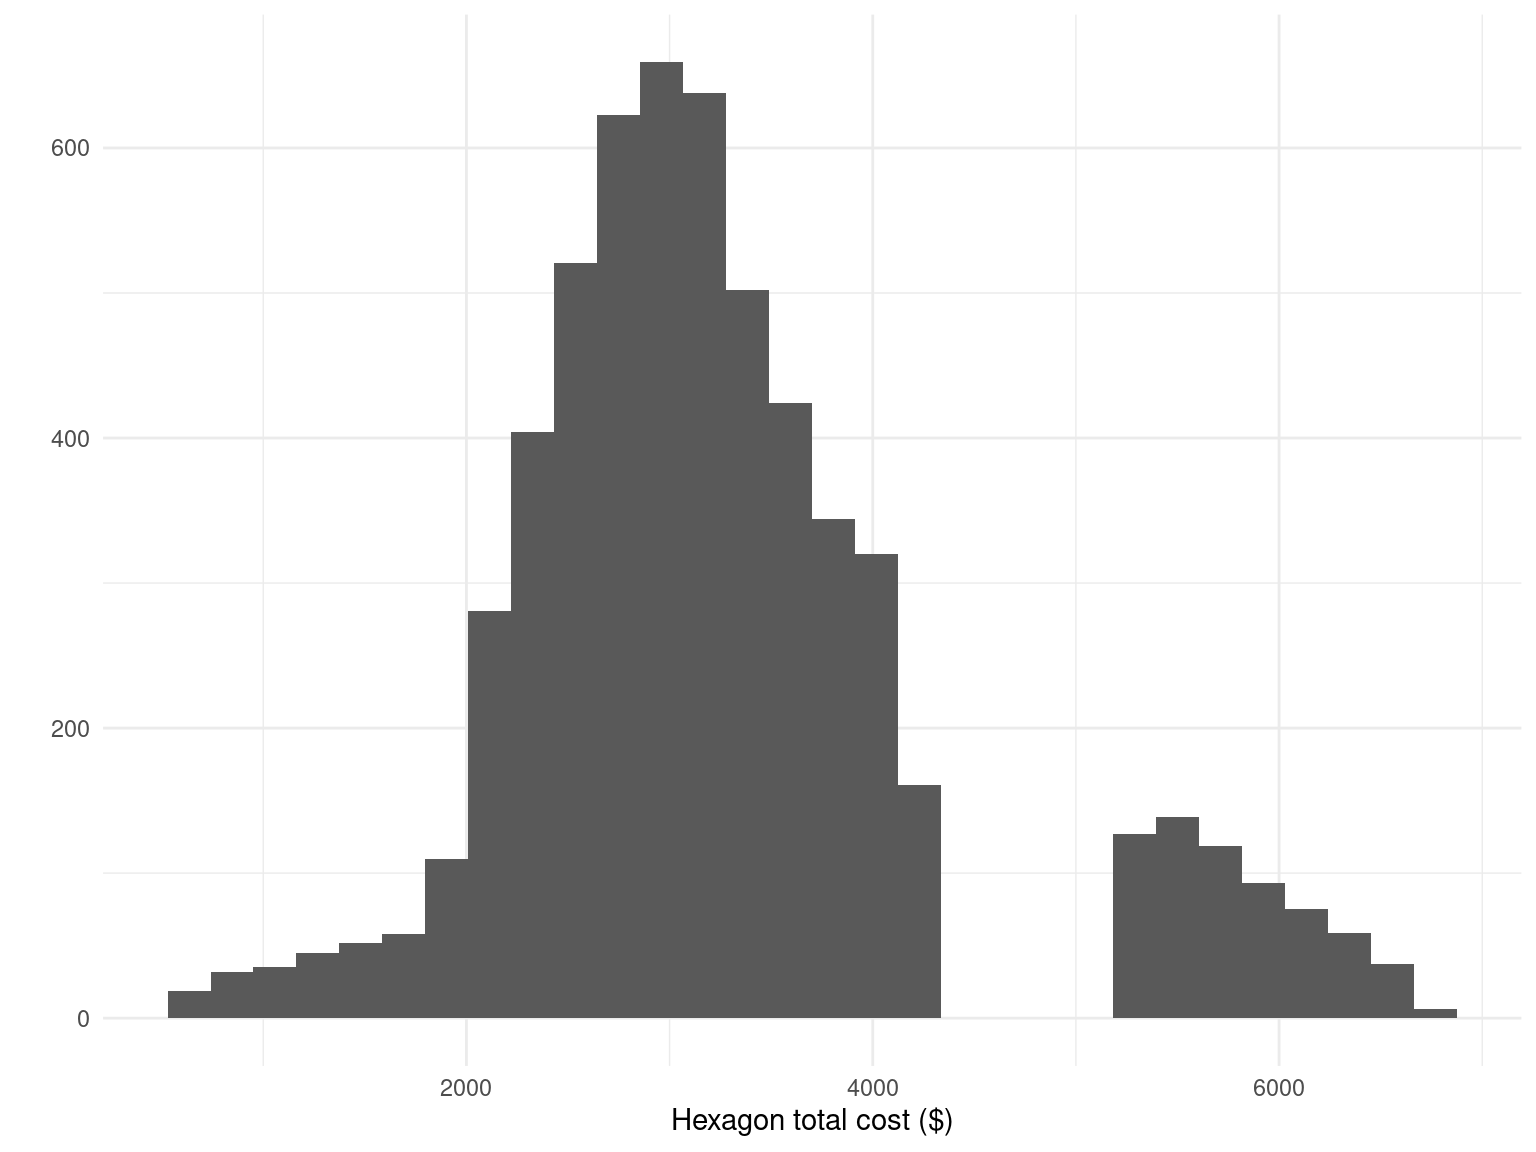
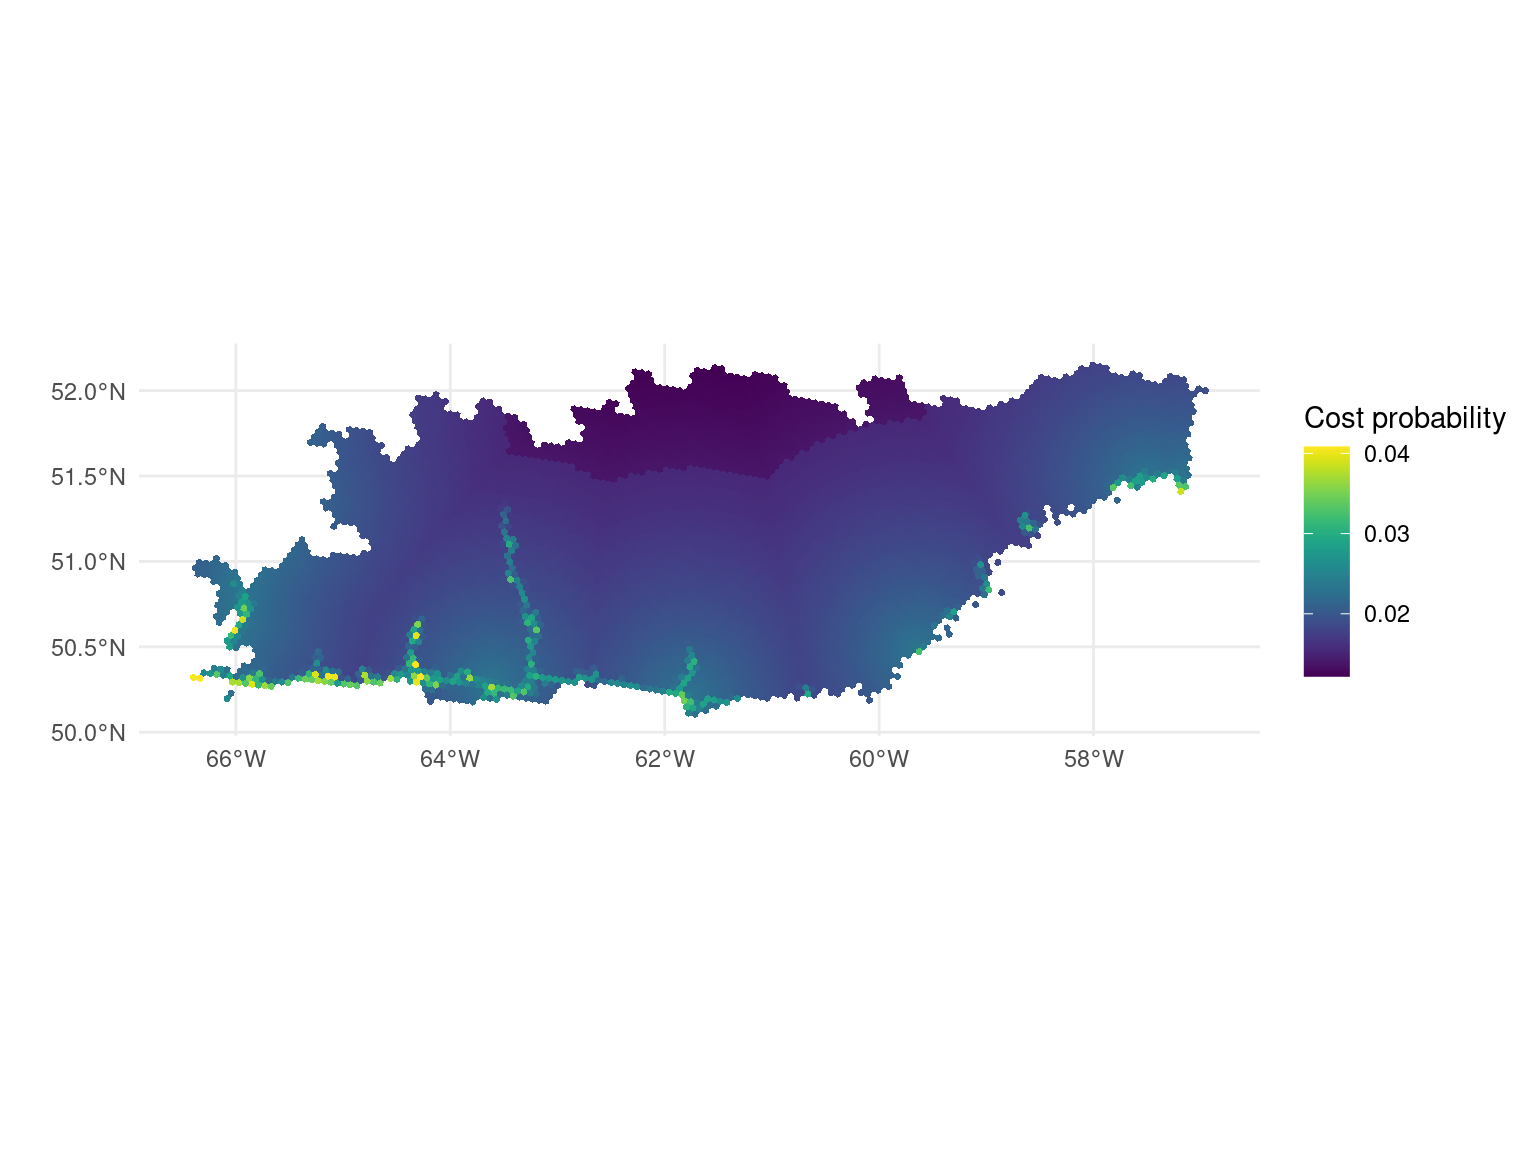
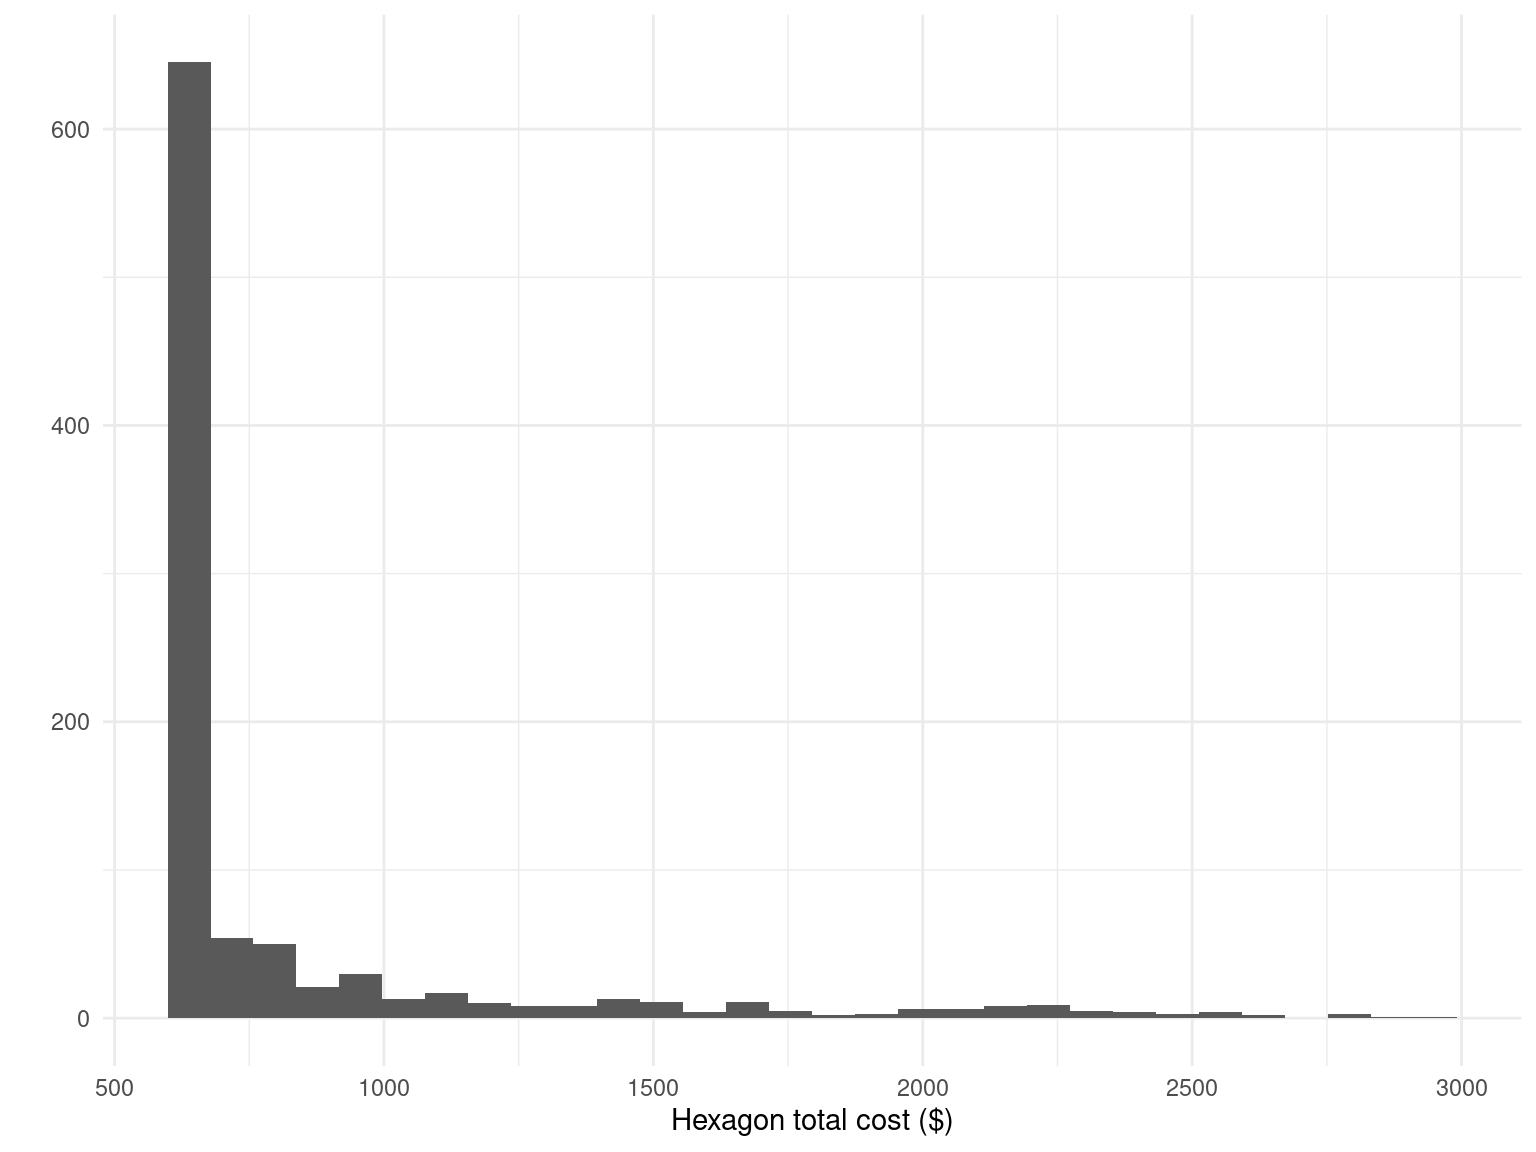
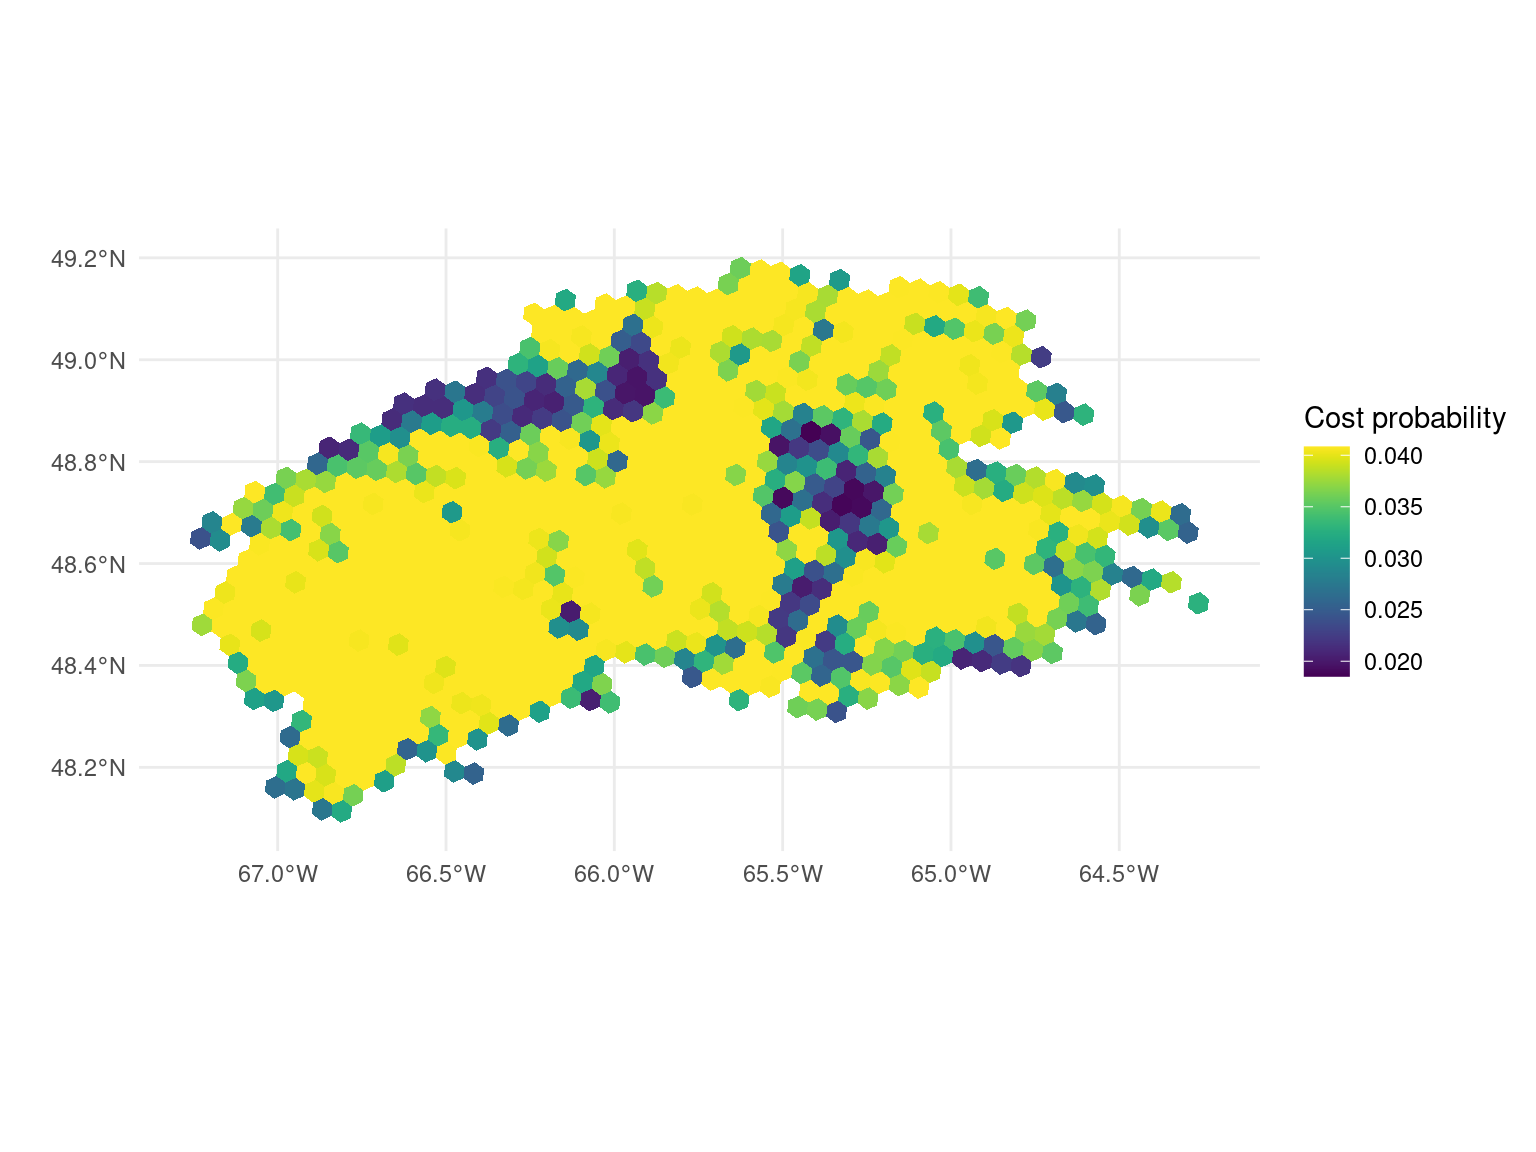
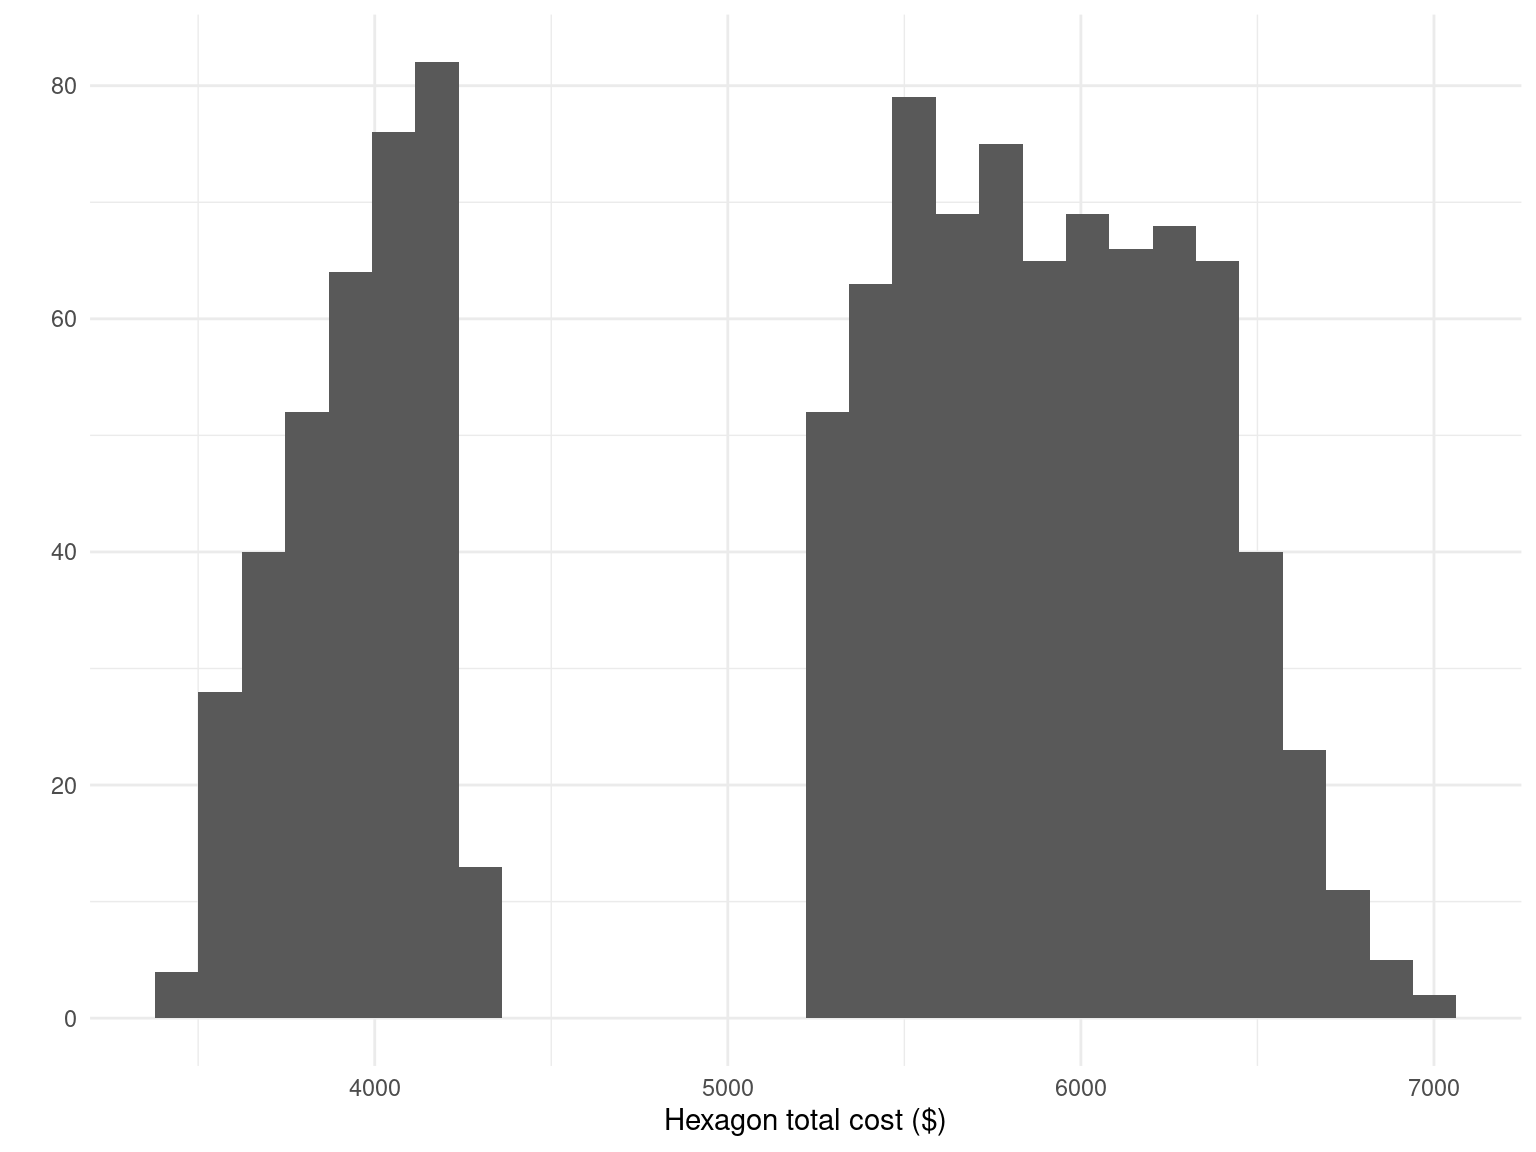
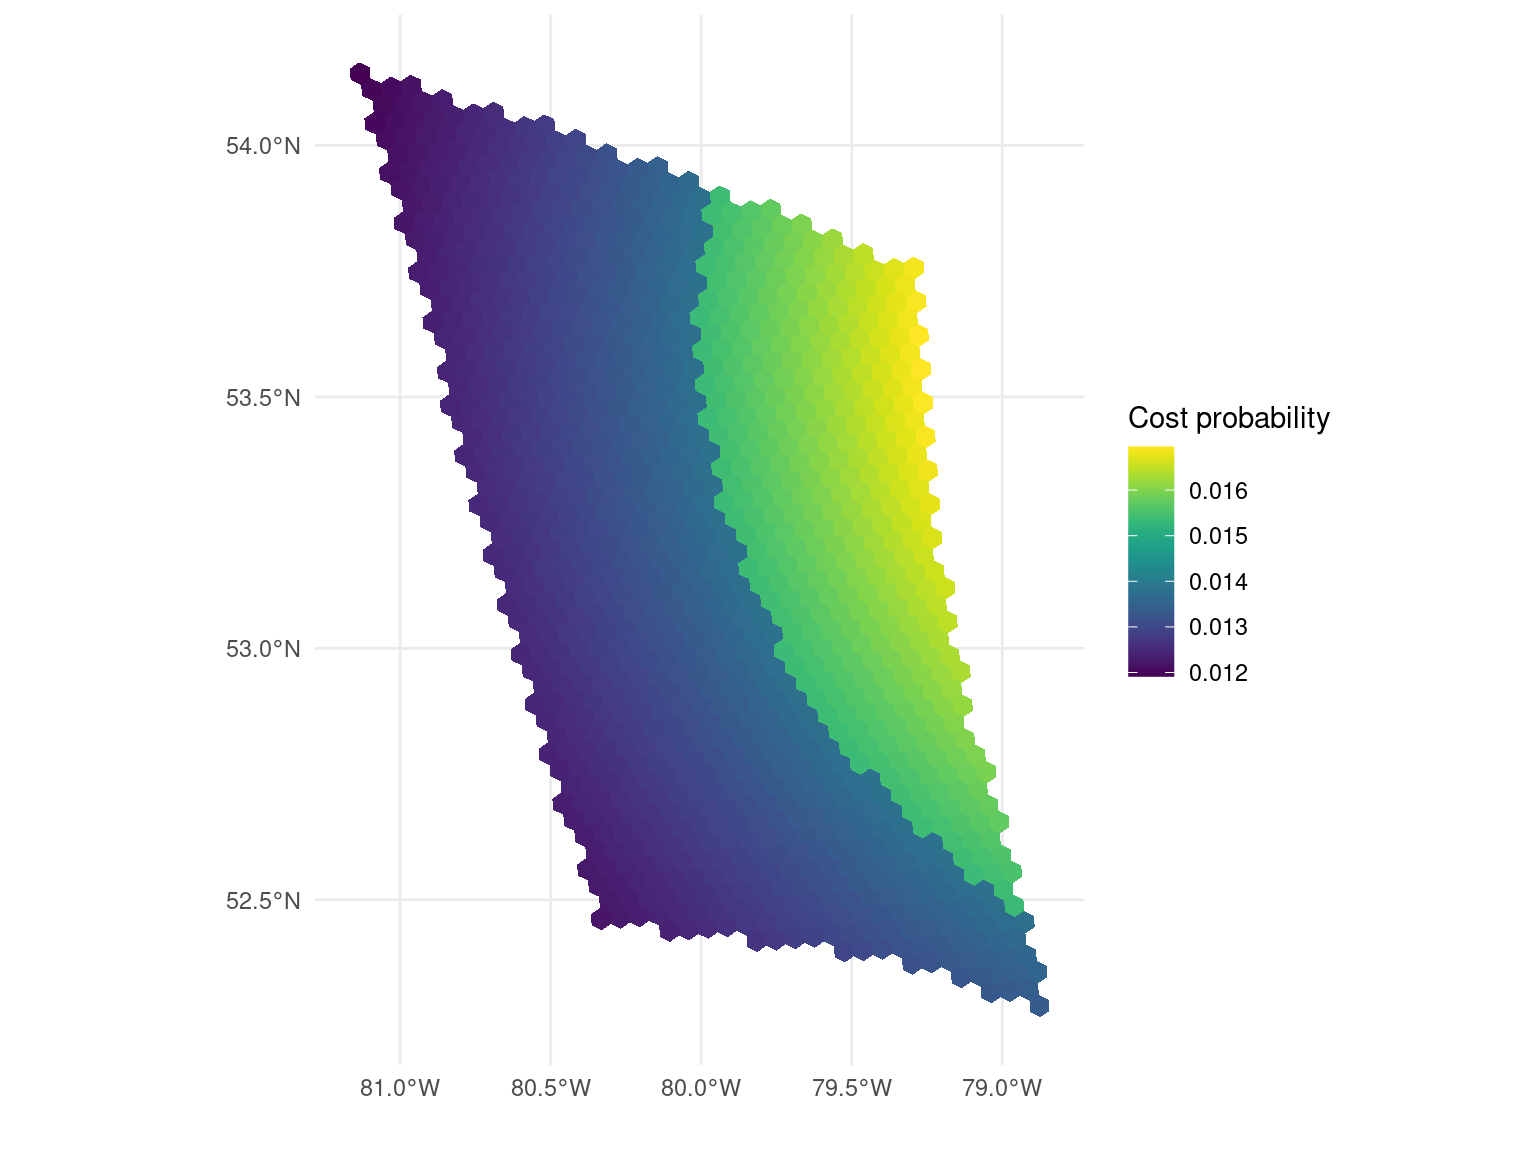
This section provides a summary of the total cost and cost inclusion probability obtained from the different layers described in Chapter 4. The first figure is the histogram of total cost distribution across the hexagons of an ecoregion. The second figure illustrates the spatial distribution of cost inclusion probability within the ecoregion.
Ecoregion 7
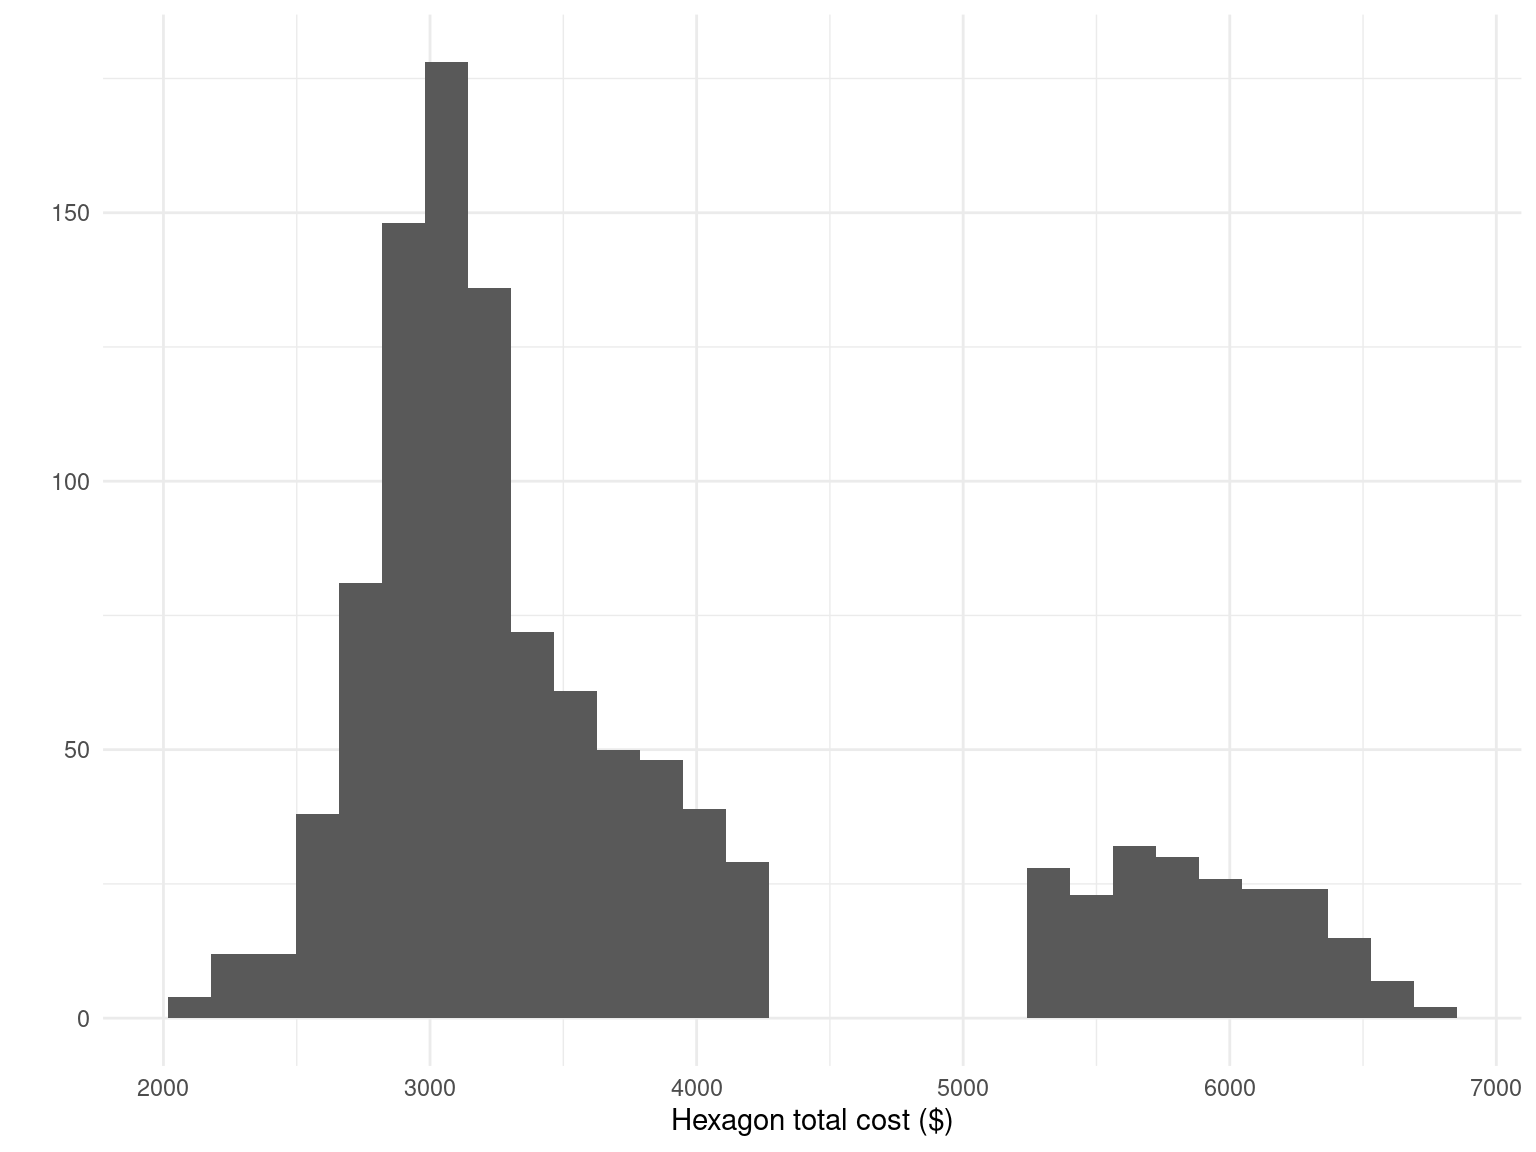
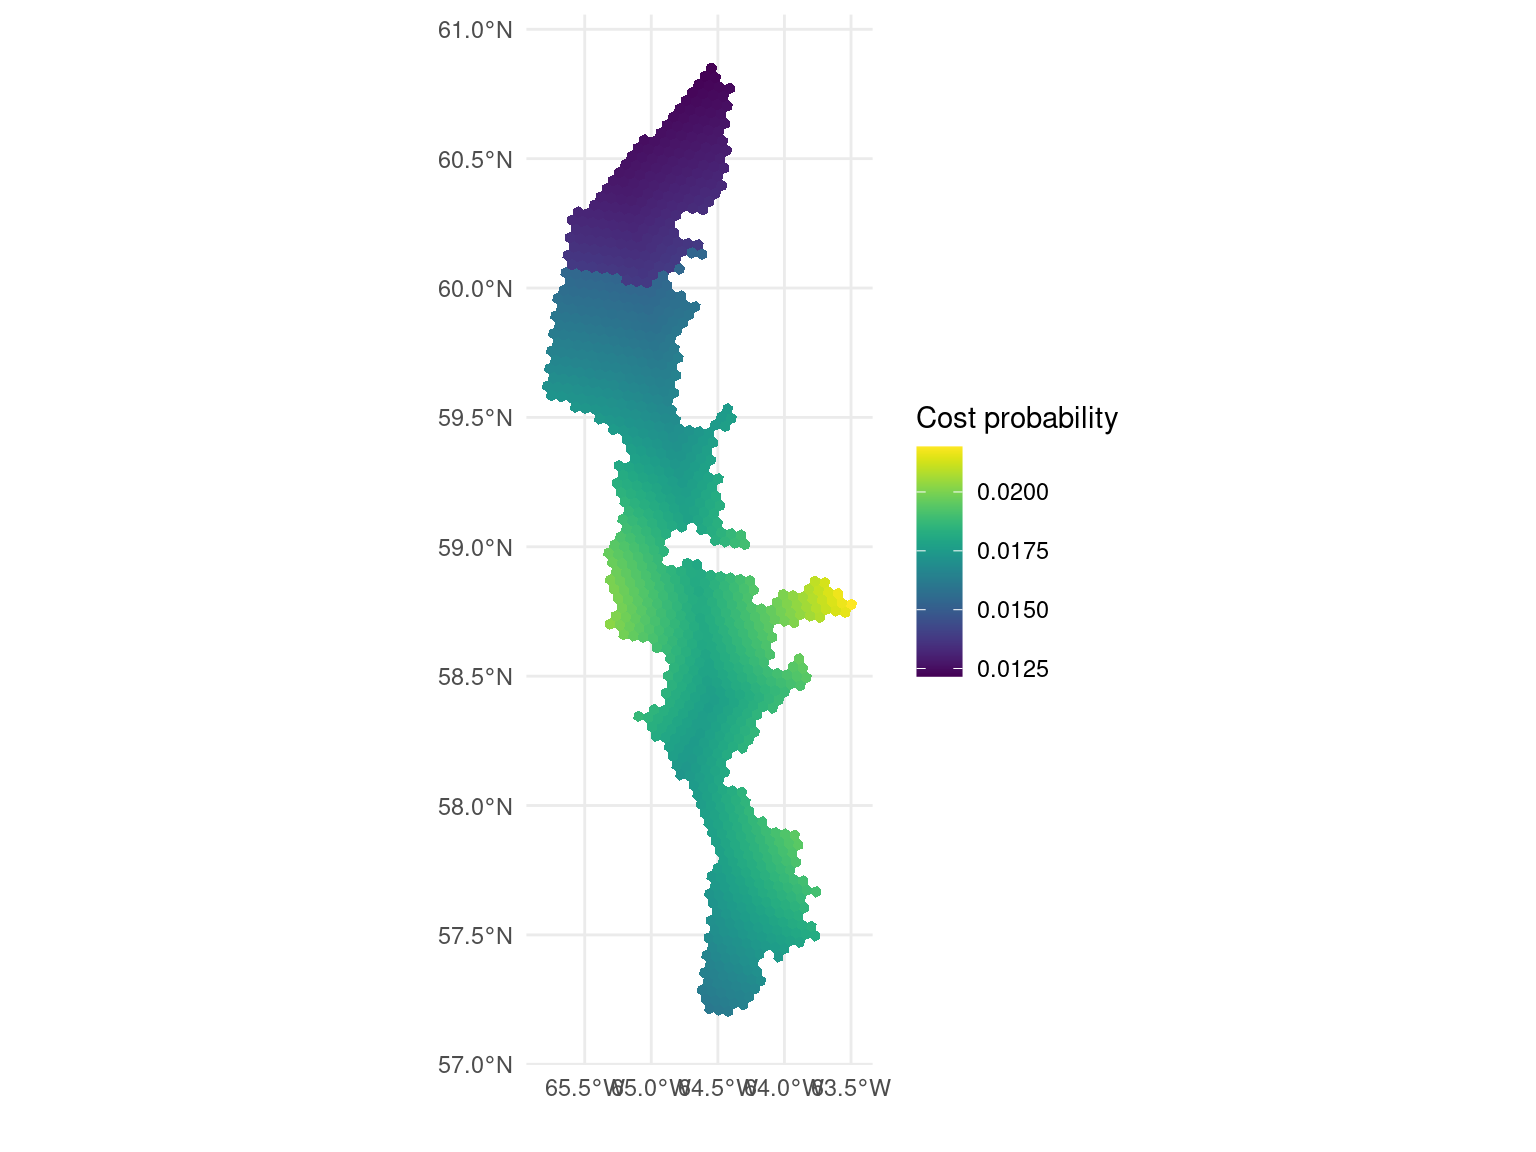 ## Ecoregion 28
 ## Ecoregion 30
 ## Ecoregion 31
 ## Ecoregion 46
 ## Ecoregion 47
 ## Ecoregion 48
 ## Ecoregion 49
 ## Ecoregion 72
 ## Ecoregion 73
 ## Ecoregion 74
 ## Ecoregion 75
 ## Ecoregion 76
 ## Ecoregion 77
 ## Ecoregion 78
 ## Ecoregion 86
 ## Ecoregion 96
 ## Ecoregion 99
 ## Ecoregion 100
 ## Ecoregion 101
 ## Ecoregion 102
 ## Ecoregion 103
 ## Ecoregion 117
 ## Ecoregion 216
 ## Ecoregion 217