Unifying individual and metapopulation scales with stochastic population models: the effect of climate and competition on tree range limits
Willian Vieira
1
Dominique Gravel
1
1 Département de biologie, Université de Sherbrooke, Sherbrooke, Québec, Canada
Supplementary Material 1
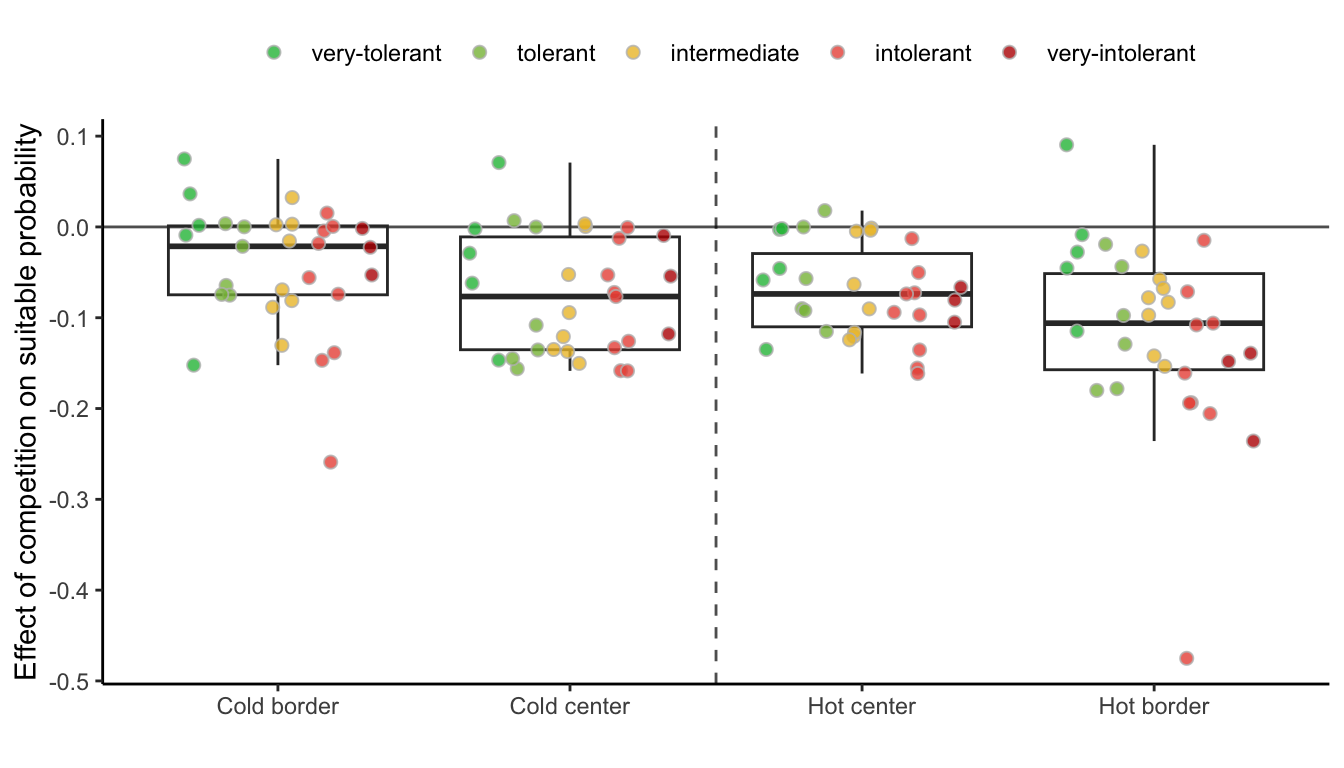
Figure 1: The effect of competition on suitable probability across the four range positions. We assessed the competition effect by subtracting suitable probability under heterospecific to suitable probability under no competition. A positive relative difference indicates an increase in suitable probability from the center towards the border, while a negative difference indicates a decrease. Each species point is color-coded based on its shade tolerance following Burns, Honkala, and others (1990).
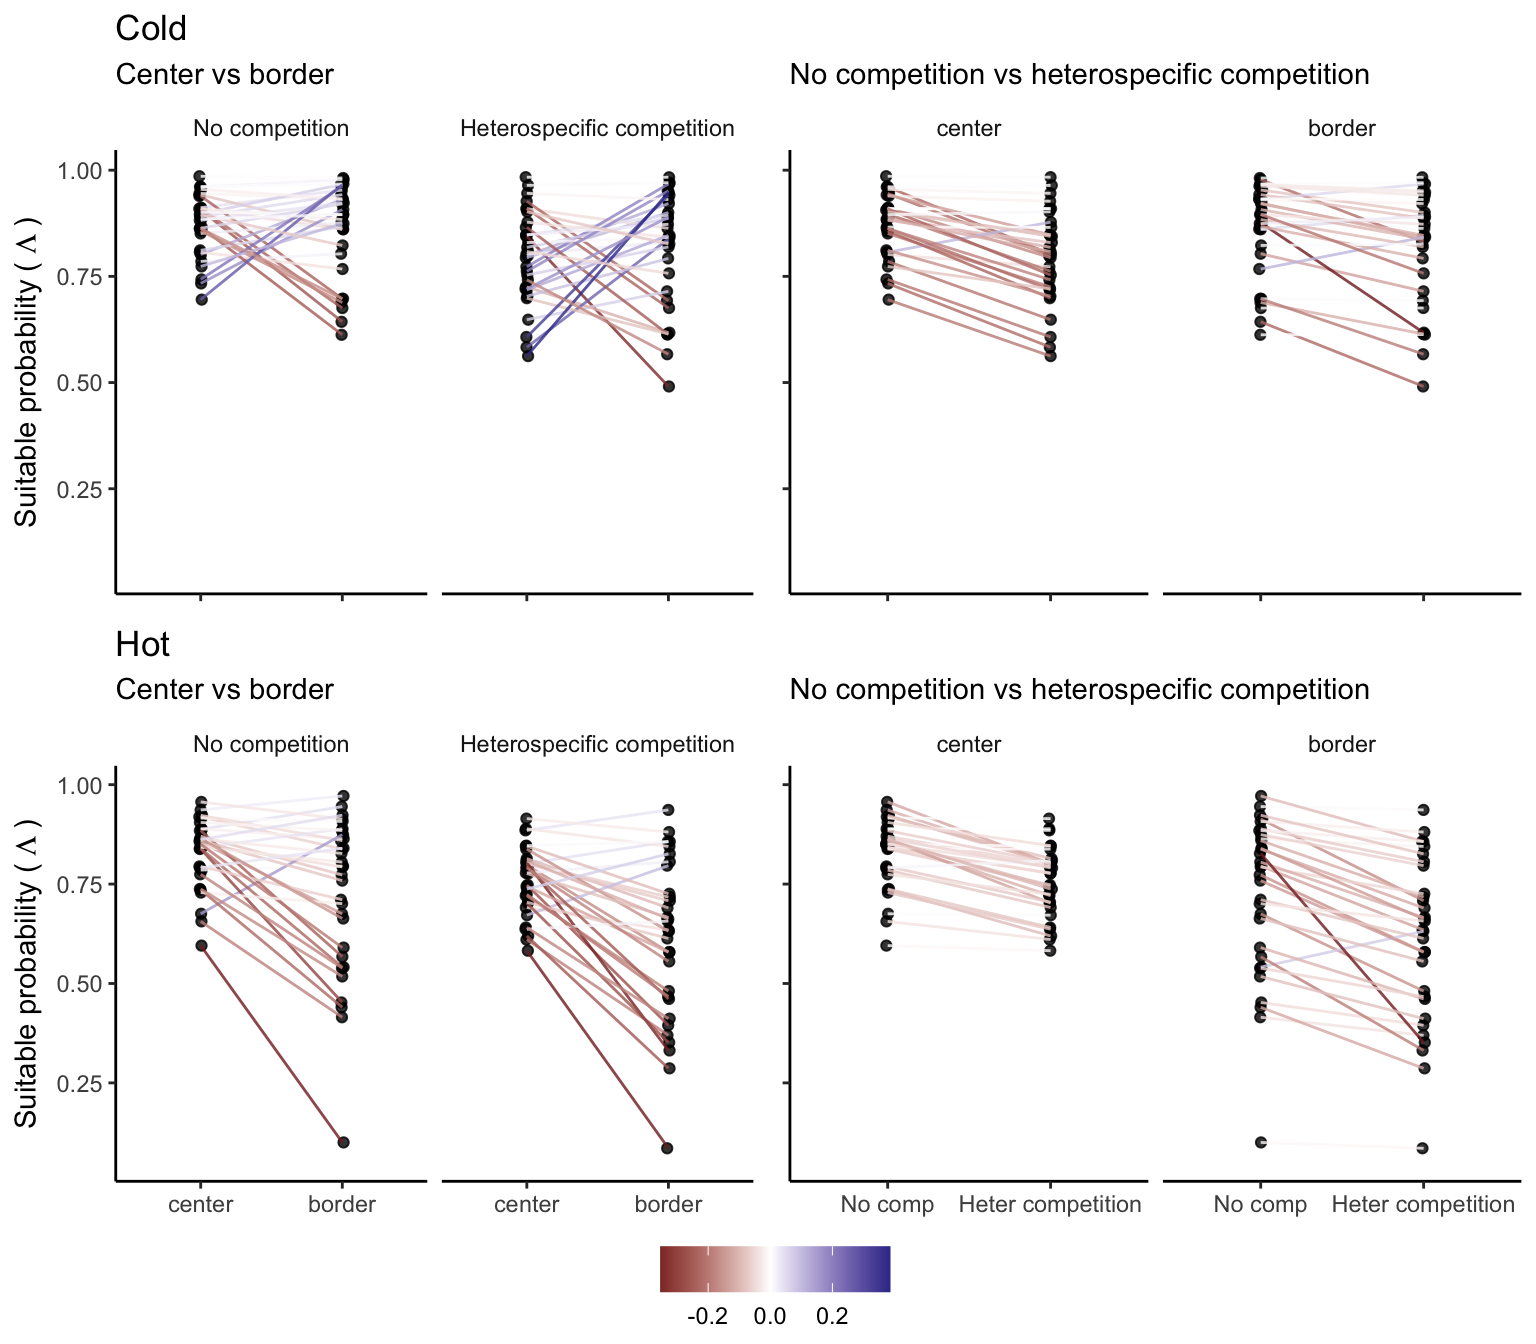
Figure 2: Difference in suitable probability between the center and border of the distribution (left panels) and no competition and heterospecific competition (right) for the cold (top) and hot (bottom) ranges. The color of the line connecting each species’ conditions represents the intensity of change in suitable probability—the more intense the color, the greater the shift between conditions.
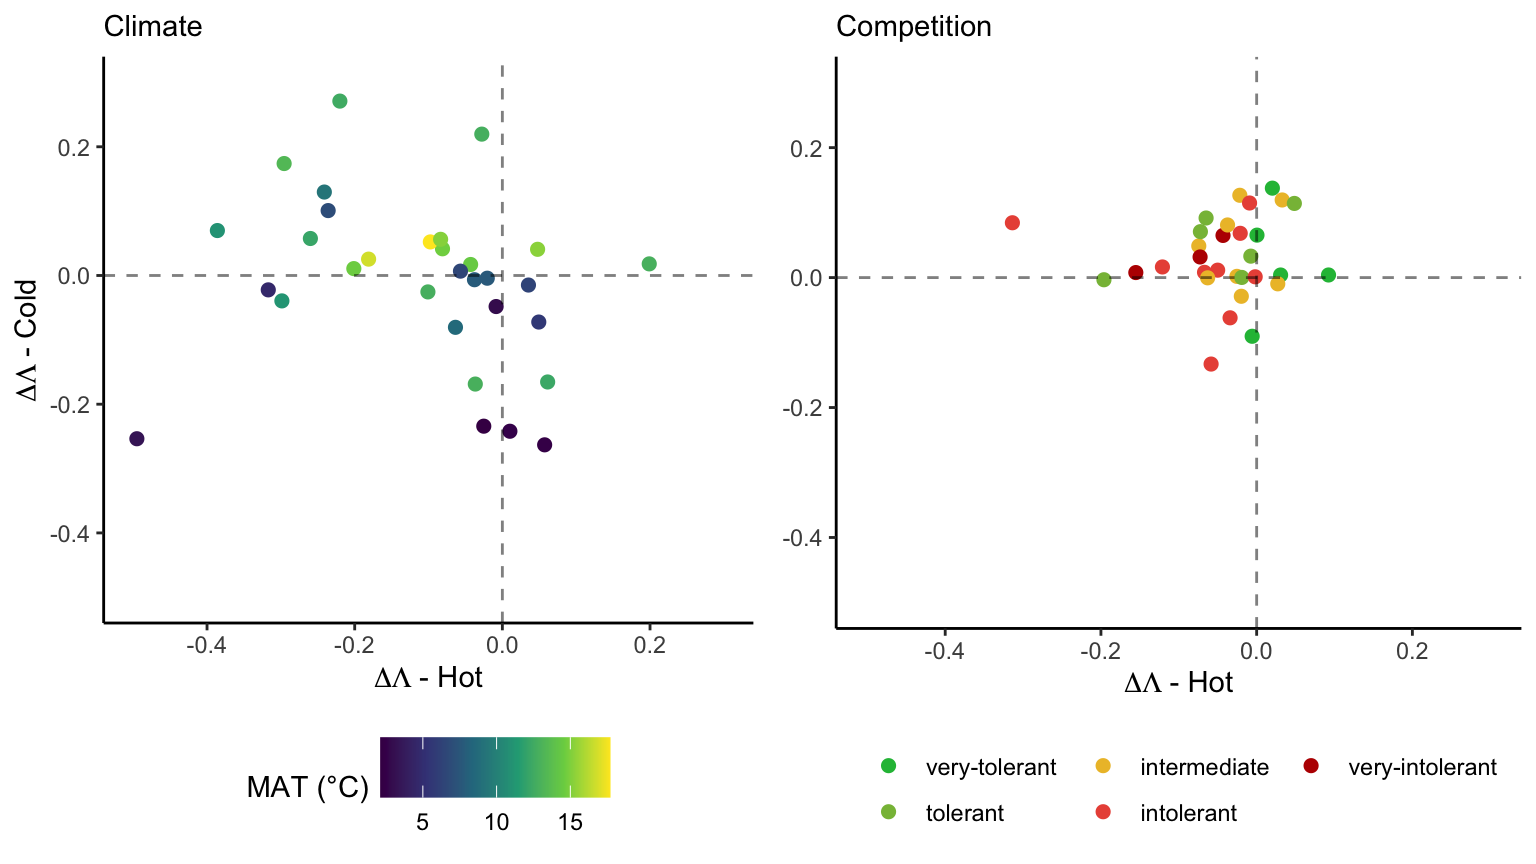
Figure 3: The relationship in the difference in suitable probability from the center to the border (\(\Delta\Lambda\)) between the cold and hot borders. A species at the bottom-left area (both \(\Delta\Lambda\) are negative) indicates an unimodal decrease in suitable probability at the borders. Conversely, species at the top-right square exhibit an inverse unimodal shape. In the top-left or bottom-right areas, suitable probability linearly decreases or increases from the cold toward the hot border, respectively. For the climate effect (left panel), species are colored following the centroid mean annual temperature among all observed plots. In the climate effect (left panel), species are color-coded based on the centroid of mean annual temperature among all observed plots. In the competition effect (right panel), species are classified by shade tolerance following Burns, Honkala, and others (1990).
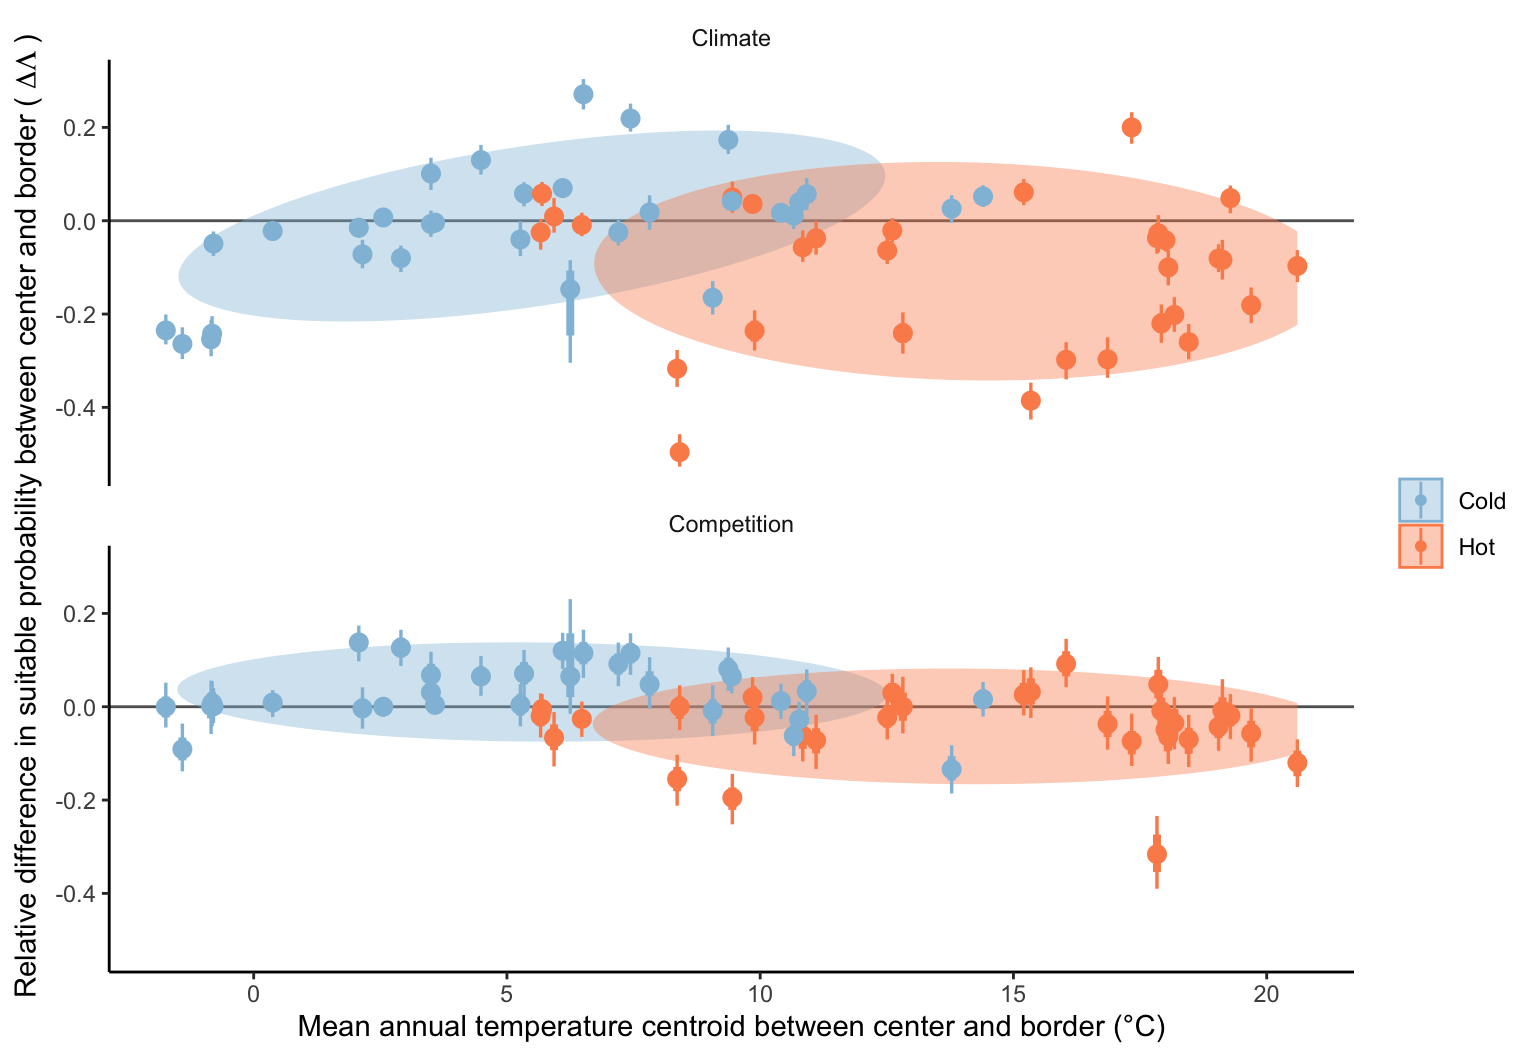
Figure 4: Relative difference in suitable probability between the center and border for climate and competition for 31 species located over the mean annual temperature gradient. Species points are grouped by a Multivariate Normal Density function with 75% probability.
Each figures represents the model fit and the estimation of suitable probability for the cold and hot ranges for each of the 31 eastern North American tree species. The model’s average line and 90% prediction intervals are estimated using 500 draws from the posterior distribution. The vertical dotted line represents the range limits of the observed mean annual temperature in the dataset.
References
Burns, Russell M, Barbara H Honkala, and others. 1990. “Silvics of North America: 1. Conifers; 2. Hardwoods Agriculture Handbook 654.” US Department of Agriculture, Forest Service, Washington, DC.