Supporting information

Paying colonization credit with forest management could accelerate the range shift of temperate trees under climate change

Willian Vieira
1, 2
 
Isabelle Boulangeat
3
 
Marie-Hélène Brice
4, 5, 2
 
Robert L. Bradley
1, 6
 
Dominique Gravel
1, 2
 
1 Département de biologie, Université de Sherbrooke, Sherbrooke, Québec, Canada

2 Québec Centre for Biodiversity Sciences, McGill University, Montréal, Québec, Canada

3 Université Grenoble Alpes, INRAE, LESSEM, St-Martin-d’Hères, France

4 Jardin botanique de Montréal, Montréal, Québec, Canada

5 Institut de recherche en biologie végétale, Département de Sciences Biologiques, Université de Montréal, Montréal, Québec, Canada

6 Centre d’étude de la forêt, Université du Québec à Montréal, Montréal, Québec, Canada

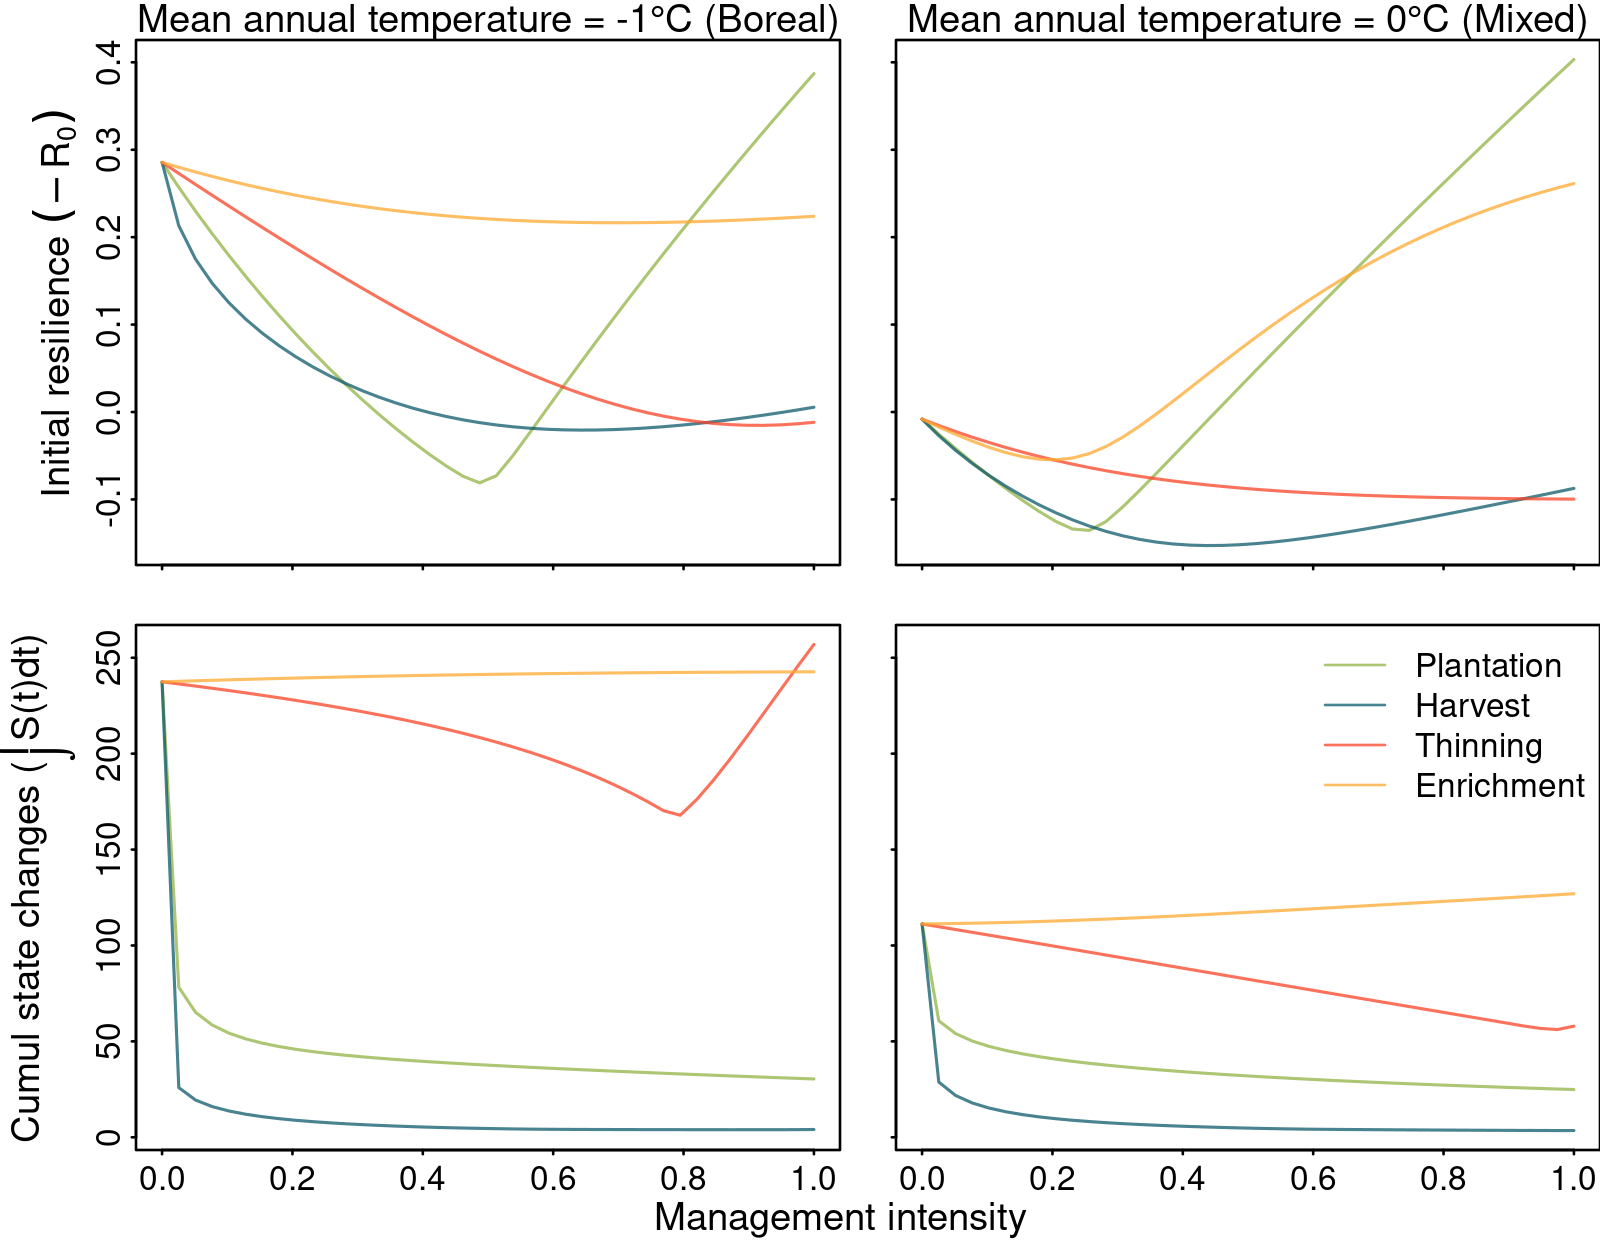
Supplementary Material 1
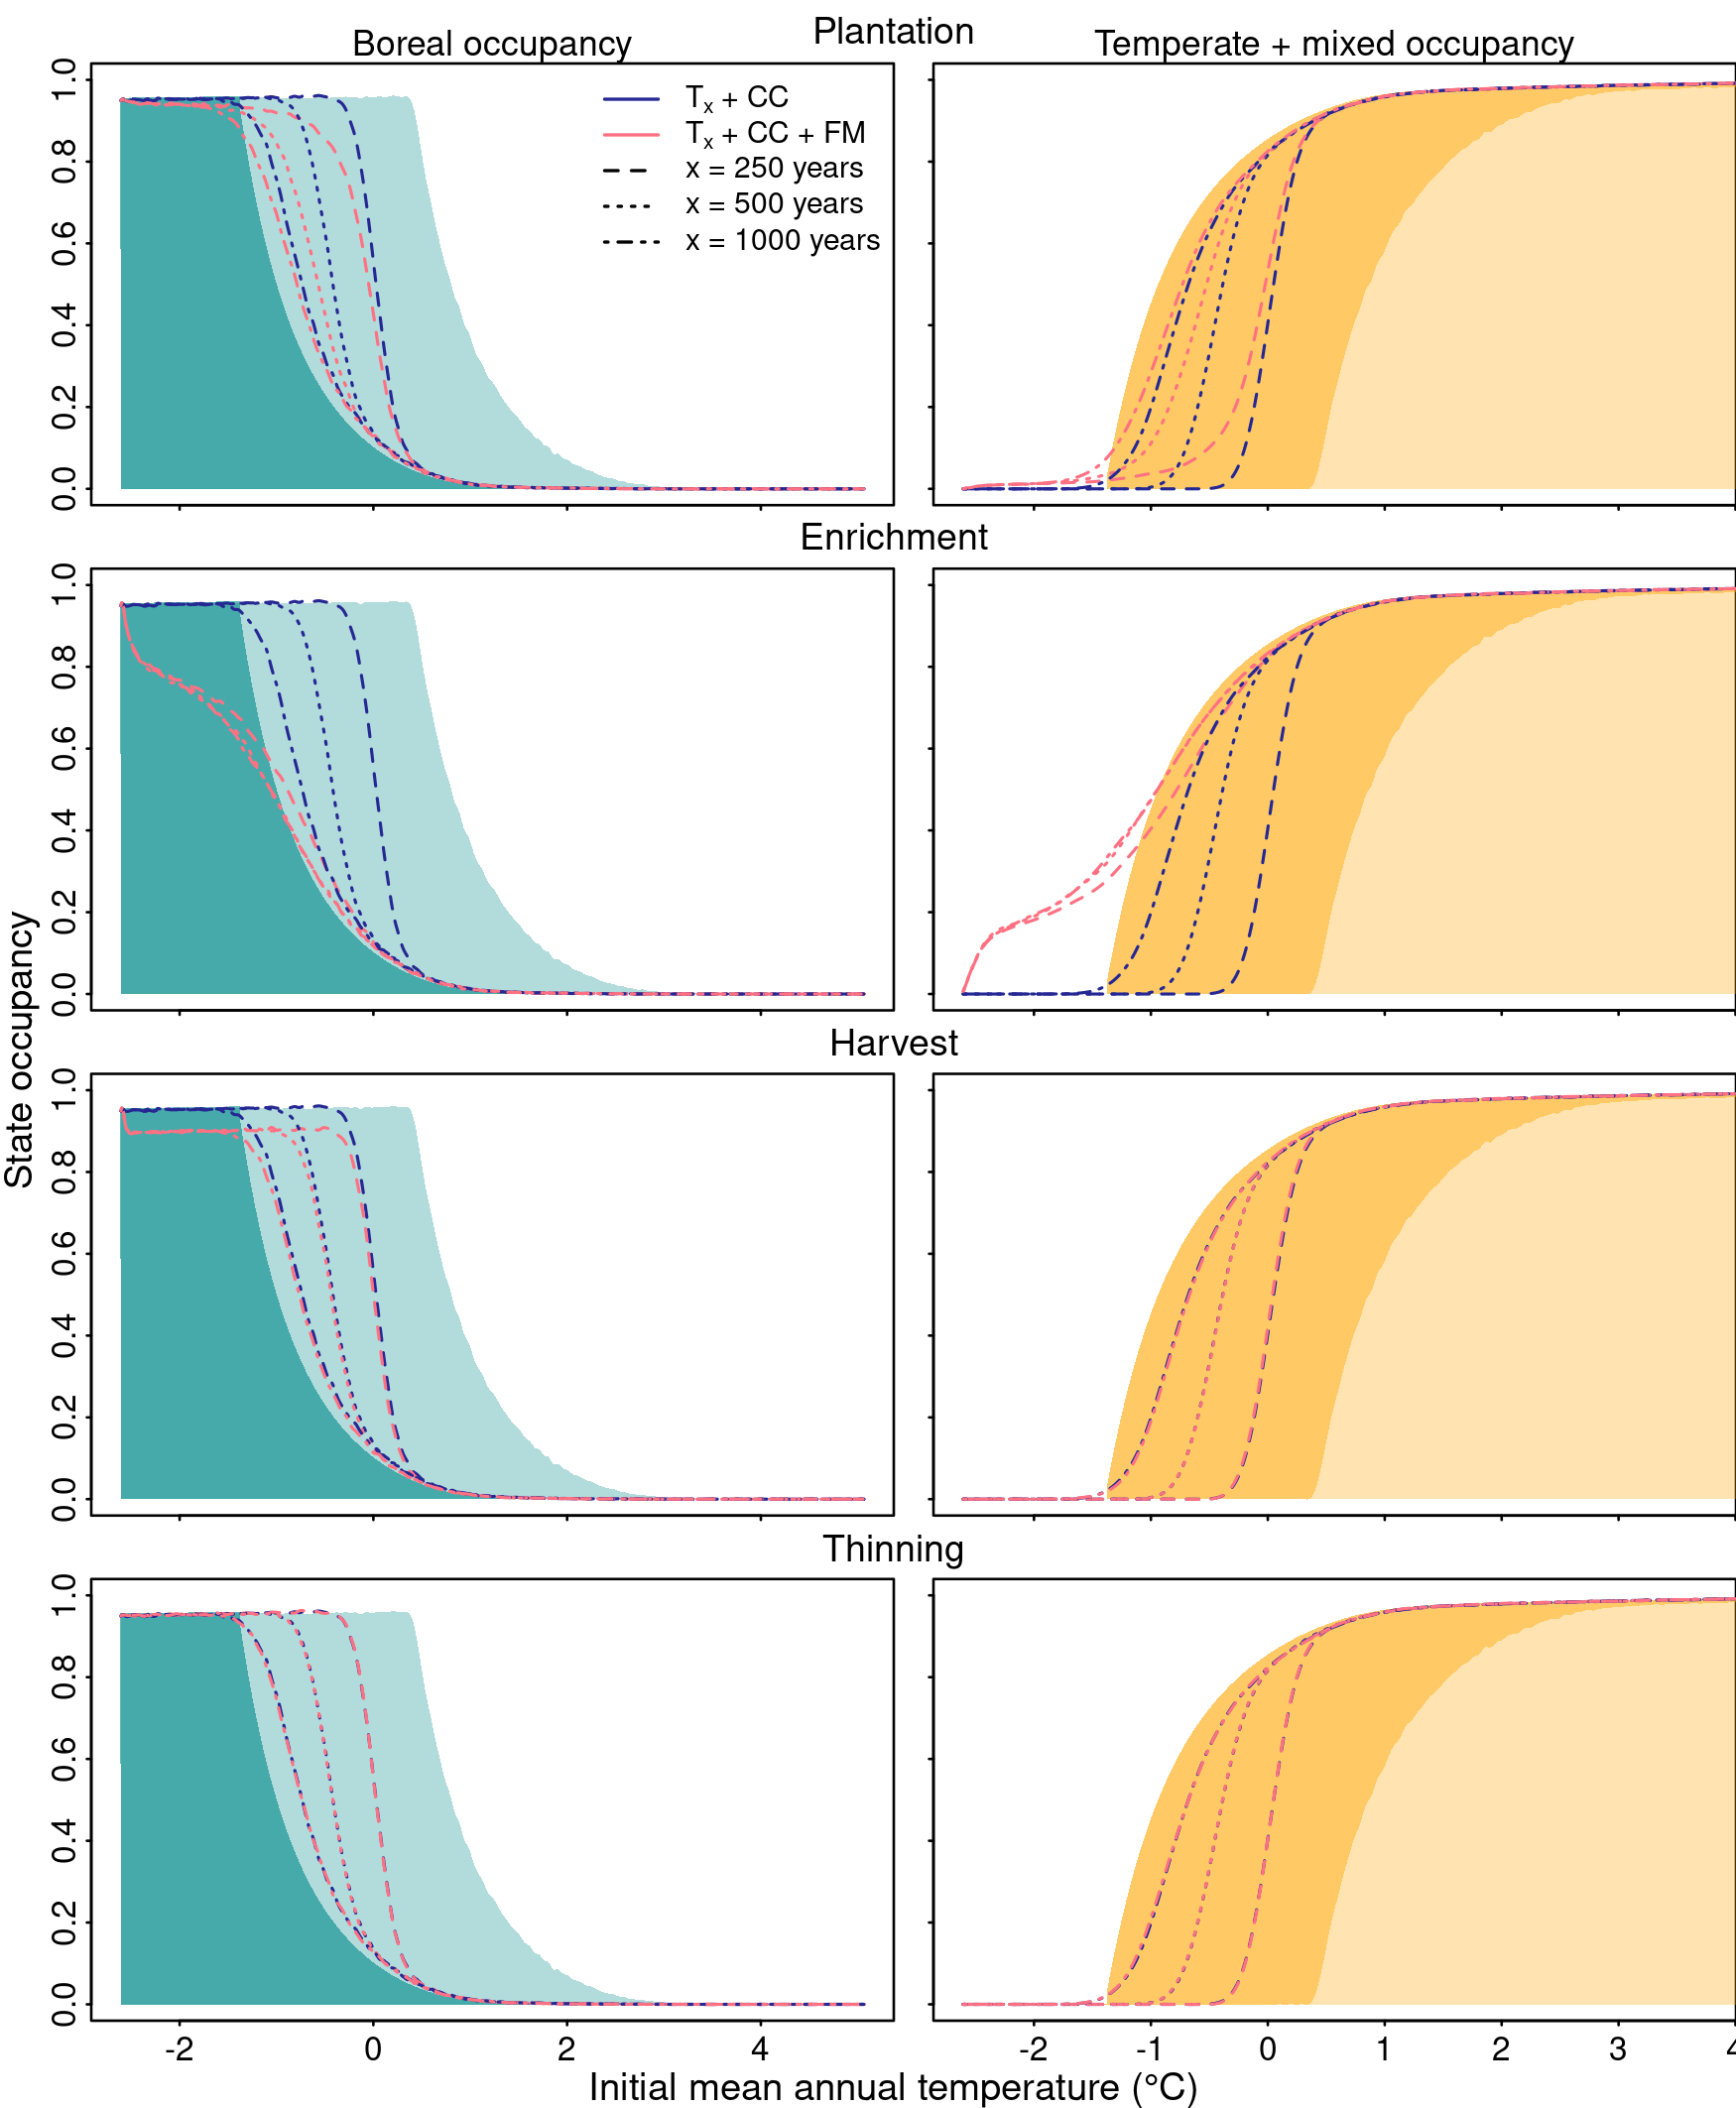
Figure 1: Sensitivity analysis of the effect of cell size on dispersal rate for different management practices. For each cell size ranging from 0.1 Km (1 ha) to 5 km (2500 ha), we warmed temperature with RCP4.5 increasing linearly for the first 100 years, and let the model run for a total of 1000 years. We specified the range limit of a forest state within the landscape grid when the occupancy of the state was less than 85%. The mean migration rate of a simulation is therefore defined as the distance the range limit of a forest state travelled, divided by the total amount of time. Note that the values of migration rate are may not be realistic, as they are dependent on the size of the theoretical landscape lattice, but are enough to compare between the different cell sizes. More information about this analysis can be found here: https://github.com/willvieira/STManaged/issues/1
Figure 2: Range shift relative to initial mean annual temperature for the boreal (dark green) and temperate-mixed (orange) states. Range shift was computed for all values of occupancy [0-1] by calculating the difference between initial state distribution (T_0), and the final distribution of a simulation. The panels in the first row show the range shift in function of occupancy for the median output of the T_{150}CC + FM simulation (Figure 5). The panels in the second and third row test whether filtering extreme occupancy values have an effect on the range shift summary.
Figure 3: Transient dynamics following warming temperature along with the increasing management intensity for plantation, harvest, thinning and enrichment planting. Climatic condition is fixed at the boreal (mean annual temperature of -1; left panels) and the boreal/mixed transition (mean annual temperature of 0; right panels) regions. Transient dynamics are described by (i) exposure or the shift of forest states to the new equilibrium; (ii) asymptotic resilience or the rate in which the system recovery to equilibrium; (iii) sensitivity or the time for the state reach equilibrium after warming temperature; (iv) initial resilience or the reactivity of the system after warming temperature; and (v) vulnerability or the cumulative amount of state changes after warming temperature.
Figure 4: Boreal (left panels) and temperate plus mixed (right panels) occupancy along the initial mean annual temperature gradient of the boreal-temperate ecotone. Light and dark shaded areas are a reference of the state occupancy at equilibrium before and after warming temperature, respectively. Each line is a different simulation to differentiate the isolated and interacting effects of climate change (CC) and forest management (FM) for a simulation time of 250, 500, and 1000 years. Management intensity was set to 0.25% for plantation, thinning and enrichment planting, and 1% for harvest. The results are the mean of 15 replications. Confidence intervals are omitted for the sake of simplicity.
Figure 5: Boreal (left panels) and temperate plus mixed (right panels) occupancy along the initial mean annual temperature gradient of the boreal-temperate ecotone. Light and dark shaded areas are a reference of the state occupancy at equilibrium before and after warming temperature, respectively. Each line is a different simulation to differentiate the isolated and interacting effects of climate change (CC) and forest management (FM) with intensity of 2, 5, 10 and 20%. Simulation time was set to 150 years. The results are the mean of 15 replications. Confidence intervals are omitted for the sake of simplicity.
Figure 6: Boreal (left panels) and temperate plus mixed (right panels) occupancy along the initial mean annual temperature gradient of the boreal-temperate ecotone. Light and dark shaded areas are a reference of the state occupancy at equilibrium before and after warming temperature, respectively. Each line is a different simulation to differentiate the isolated and interacting effects of climate change (CC) and forest management (FM). The results are the mean and 99% confidence intervals of 15 replications. Management intensity was set to 0.25% for plantation, thinning and enrichment planting, and 1% for harvest, with a simulation time of 150 years. The climate change scenario was RCP 8.5.
Figure 7: Parameters of the State and Transition Model varying as a function of initial mean annual temperature from Vissault et al. (2020). Annual mean precipitation is fixed to 998.7 mm. Parameters for (b) before and after warming temperature following (c) RCP4.5 and (d) RCP8.5 climate change scenarios over the same latitudinal position. Note that the \varepsilon_B and \varepsilon_T lines are hidden behind \varepsilon_M.
Figure 8: Distribution of management intensity adjusted by the amount of forest state available at the equilibrium to be managed. For example, at lower Mean Annual Temperature (MAT) ranges, values close to 1 indicate that nearly 100% of the region is susceptible to harvesting or enrichment planting (lines overlap). This implies that at a management intensity of 50%, approximately half of the landscape in that region will be affected. The total sum of available states for management across the MAT axis is shown in the legend.

References

Vissault, Steve, Matthew V Talluto, Isabelle Boulangeat, and Dominique Gravel. 2020. “Slow demography and limited dispersal constrain the expansion of north-eastern temperate forests under climate change.” Journal of Biogeography 47 (12): 2645–56. https://doi.org/10.1111/jbi.13978.

References